This article provides a report on advertising agencies dropping commission.
Advertising Agencies Commission Dropping:
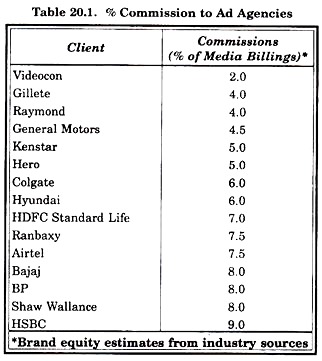
Advertising agency commission have hit rock bottom, dropping now to an all time low. A far cry from 15%, some clients are even paying their agencies commission as low as 2%. The agency of consumer electronics giant Videocon, a company with an advertising budget of Rs. 55 crores has paid only Rs. 90 lakhs as commission which comes out to be 2%.
Car major general Motors moved its business to an agency that was willing to work at 4.5%. Rival automobile company Hyundai is paying a little better to its agency at 6%. Oral care giant Colgate Palmolive is paying at the rate of 6% while Raymond’s and Gillette are paying at the rate of 4%.
There are not isolated cases and the industry as a whole is ruling under the assault on one of the longest standing payment systems in the country. The list of companies paying the commission to ad agencies is given in table 20.1.
ADVERTISEMENTS:
The table 20.1 states that the highest paid commission is 9% instead of 15% as per the system. It is specially bad with creative agencies commission, though media buying and media planning houses are feeling the heat as well.
The largest FMCG marketer in the country has dropped its commission for a second year running. An international consumer electronics grant is rumored to have signed up with one of the biggest agencies in the country for under 5% commission.
Agencies consider themselves lucky as they mange to get clients who are willing to pay 8-9% as commission. It looks like that the good old days are gone when agencies earned a commission of 15% on all services rendered.
In an interview, on his first visit to India, Peter A Schweitzer, President and Chief Executive officer, J. Walter Thompson (JWT), reacting to this controversy stated that it is much also about nothing. He believed that the commission system is dying very fast and the clients are increasingly moving to fees. Compensation system are driven by clients and the fee system will grow rapidly.
ADVERTISEMENTS:
Commissions are impact superfluous and could be dangerous since agencies are providing a lot of non-advertising services, which the client is willing to pay for. He said that many of our services are no longer related to media and there is no reason for adverting agencies to get paid in relation to media any more.
A model used by many clients is a fee computed on the basis of cost plus and upon margins along with incentives linked to performance of the brand.
ADVERTISEMENTS:
Notes:
1. The A and M Agency Report is based on information supplied by advertising agencies.
2. To calculate capitalized billings, multiplication of gross income by a factor of 6.67 has been recommended. However, some agencies have multiplied it by factors ranging from 6.666 to 6.70. These aberrations can be safely ignored as the difference is nominal. In any case, the ranking is by gross income, and not by capitalized billings.
3. Unless otherwise specified, all figures relate to 1999-2000.
ADVERTISEMENTS:
4. The calculation of growth in 1999-2000 is based on the performance of 89 agencies whose figures are available for both years.
5. Gross income figures for 1998-99 in the case of some agencies do not tally with the figures they themselves had provided last year, and which appeared in the previous A and M Agency Report. For reasons of uniformity, growth rate has been calculated on the figures that appeared in print last year.
Definitions:
1. Gross income the total value of billings to clients less the total value of payments of media owners, printers and other suppliers (film producers, typesetters, market research agencies, etc.)
2. Billings is the gross amount spent through the agency for media, supplies and services.
ADVERTISEMENTS:
It consists of:
(A) The total value of bills to clients on advertising placed with print, broadcast (TV, radio, film exhibition, video, cable and satellite TV) and outdoor media(not including point-of-purchase and merchandising) for space and time,
(B) The total value of bills to clients on account of non-media. It includes billing for artworks, film production, printing jobs, research, etc. as well as design and creative fees for jobs such as packaging design and corporate stationery etc. It also includes income from all other sources.
3. Media billings: The total value of bills to clients on advertising placed with print, broadcast (TV, radio, film exhibition, video, cable and satellite TV) and outdoor media(not including point-of-purchase and merchandising) for space and time.
ADVERTISEMENTS:
4. Capitalized billings: This can be obtained by multiplying gross income b > JS.67, the multiplying factor for the traditional 15 per cent agency commission (100/15 = 6.67).
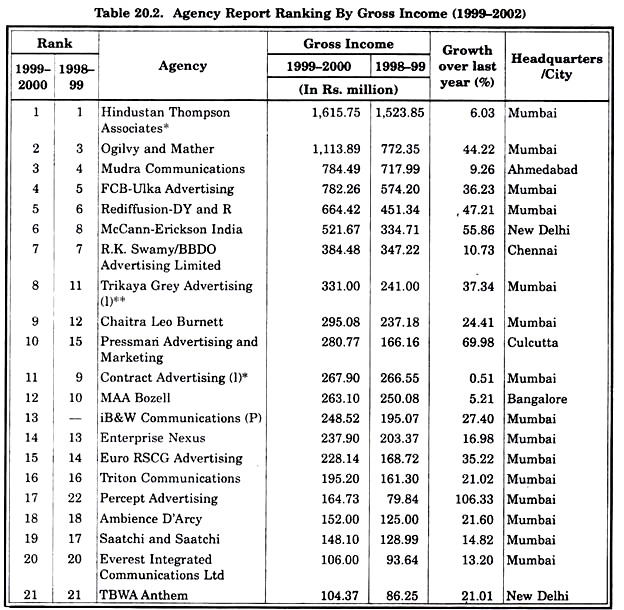
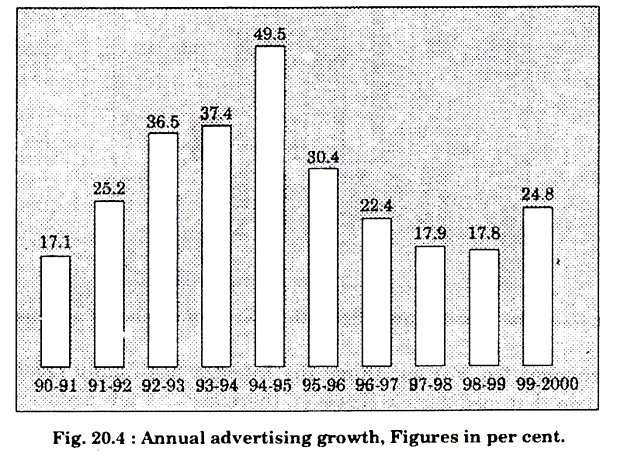
The year (99-2000) has been good. Good for most. And very good for some. Last year, or in December 1999 to be specific, the industry growth rate stood at 17.9 per cent, the same as the year before. But there was a possibility that the rate will perhaps but the 20 per cent mark in the coming year, 1999-2000. The advertising industry has witnessed unprecedented growth over last year. A growth rate of 24.83 per cent.
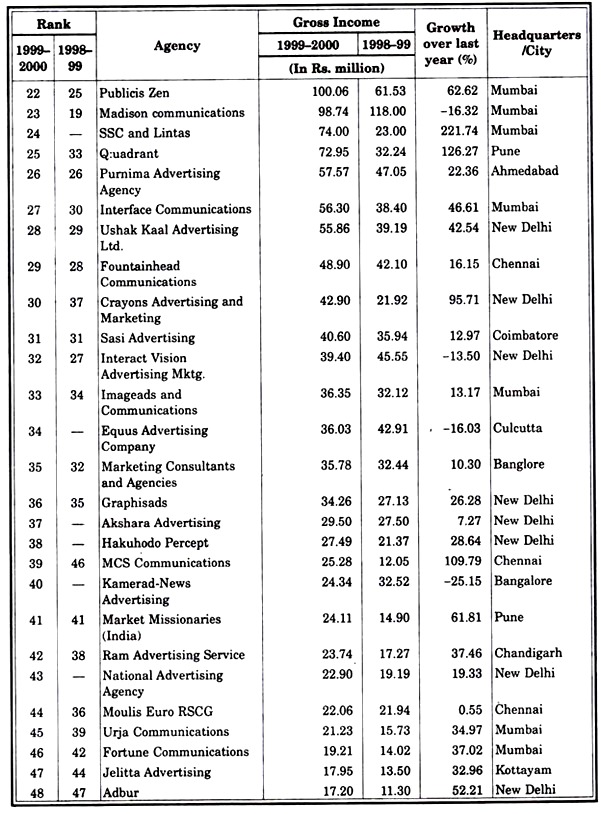
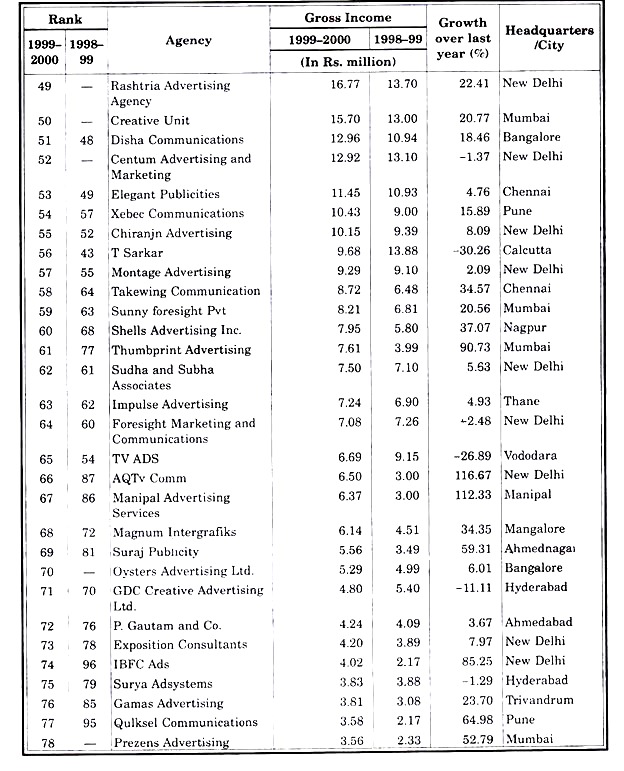
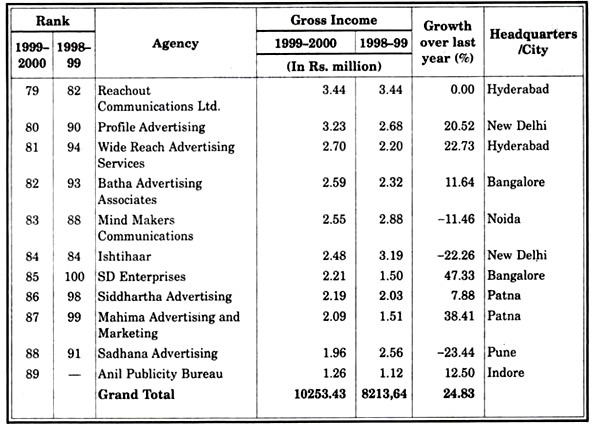
The gross income of all the agencies which have participated in the A and M Agency Report (89 in all) stands at Rs. 10,253.4 million. That’s an increase of Rs. 2,039.8 million over last year. For those who aren’t quite tuned in-this is the gross income of the Top 89 agencies that were part of the A and M Agency Report last year, as opposed to this year.
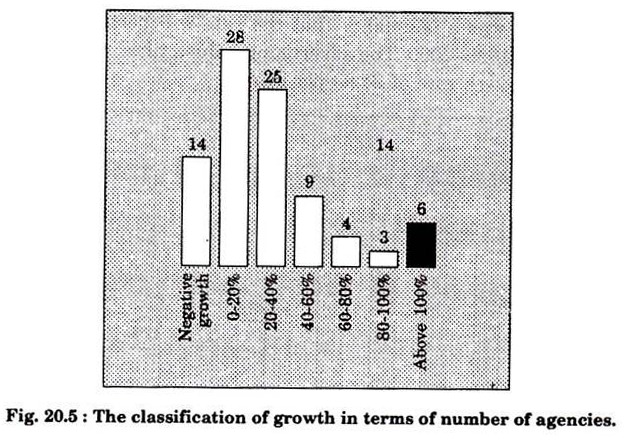
As always, there has been plenty of movement. In fact, the rate of growth may seem unbelievable to some. The fact is, there has been growth, and it is evident. But what has indeed been somewhat of a surprise is that as many as 25 agencies have shown growth rates between 20 and 40 per cent.
In fact, 53 agencies have shown growth rates of up to 40 per cent. That’s quite something. And this is exactly what takes the average up. That old, ‘sum of the parts is bigger than the whole’ rule.
ADVERTISEMENTS:
Though the number of agencies that have been included has gone down, the pattern of growth and the distribution of gross income remains the same. In all, the growth rate is substantial, and, as the results prove, achievable. But not all is peachy.
About 14 agencies have shown negative growth trends. But that apart, there is much to rejoice about. After all, advertising is the one thing that perhaps reflects the feel good factor in a country. And there’s reason for optimism. Plenty of it too. Take a look around. There is a resurgence in the need to spend, as the National Council of Applied Economic Research (NCAER) has stated. People are earning more.
It thus follows that they want more. They want more, so they need to know more. So, there has to be greater dispensing of information. That’s where advertising comes into effectively spreading the massage of a particular brand, it serves an important function, Yeah, yeah, the entertainment value and all that come later.
There have been changes too. For one thing, the Internet has finally revealed its presence, as far as the spend on that media goes. However, there are still few agencies that have given separate figures for spends on Internet space buying.
Nevertheless, as each and every individual in the industry agrees, that’s an indication of the future. It won’t take over the media per se, but will have a impact. And it has helped what is being called the traditional medium to grow. That’s one change. The second, rather obvious change is that productivity has somewhat stagnated, or, it seems, even gone down.
ADVERTISEMENTS:
Not that there’s reason to worry. For all one knows, it may be a passing phase. It probably is One can easily decipher that from the fact that many agencies, such as Pressman Advertising, iB and W, Re-diffusion-DY and R and Euro RSCG, among others have shown a healthy increase in productivity levels.
Overall, Purnima, like last year, still tops the chart as far as productivity levels go. And it has been doing that for at least the last four consecutive years. Nevertheless, its own level of productivity has actually gone down-from Rs. 59 lakh last year to Rs. 47.97 lakh per employee this year.
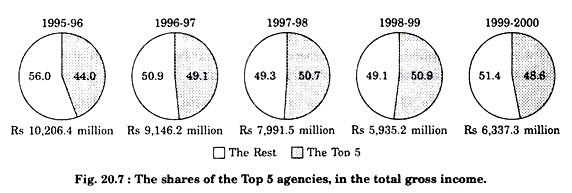
The one thing that has not changed (and perhaps never will, it seems, now) is that the Top 5 still account for almost 50 per cent of the gross income. But it has to be pointed out that the percentage has gone down, from 50.89 per cent last year to 48.6 per cent this year.
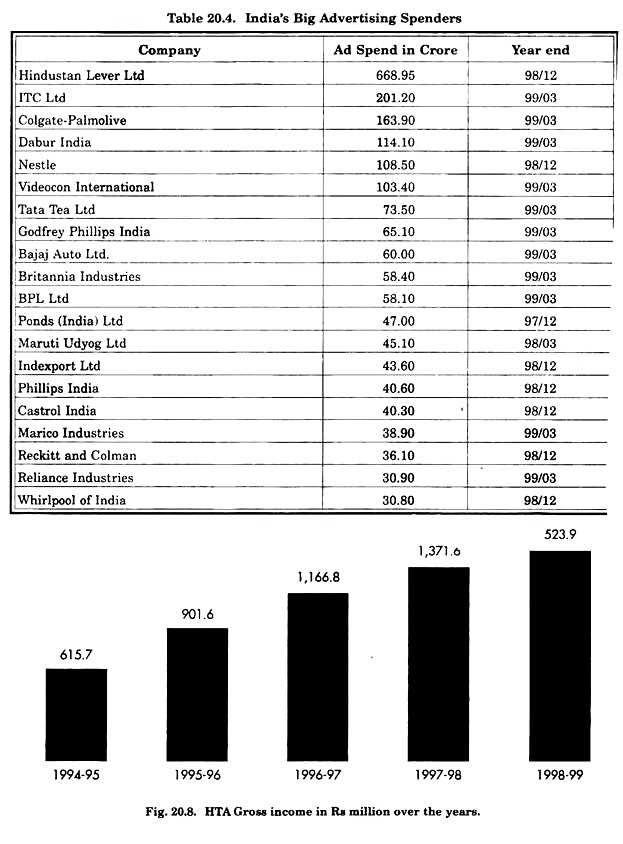
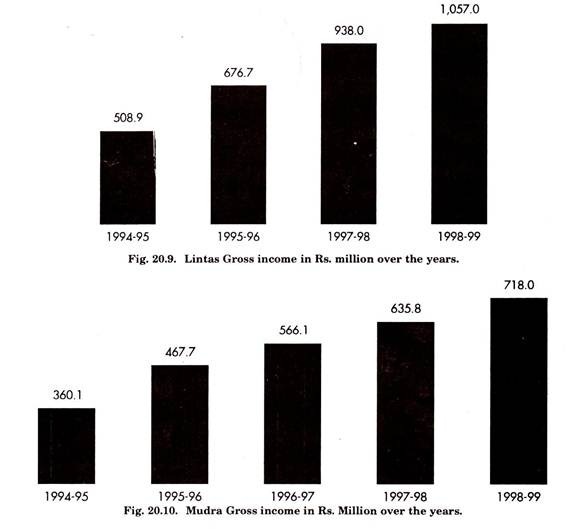
There could be a reason for it. This year, Lintas (which, worldwide, has become Lowe Lintas and Partners) has not been included, because its accounts have not been audited at the time this report was being complied. The other reason could be that both HTA (still at No 1) and Mudra (at No 3 this year) have shown rather slack growth rates, of under 10 per cent.
But as far the Top 5 go, O and M seems to be the opposite, as do FCB Ulka and Reinfusion DY and R. All of these have shown growth rates of over 30 per cent. Re-diffusion-DY and R has entered the Top 5 after a long time, though it had initially exploded on to the scene, when it was ranked at No 4 9 years back.
That’s good news. And it has also succeeded in becoming somewhat of a Yahoo! in India, with Rediffon-the-Net having become a household name.
Will things change for Re-diffusion? No one can say, but there may be a few changes given that the WPP Group has acquired Young and Rubicam (which has a 20 per cent stake in Re-diffusion-DY and R). However there’s no change as of now, at least in the Indian context.
Speaking of global change, the two words that define the international trend this year are ‘mergers’ and ‘acquisitions’. And these show no sign of stopping. Agency after agency either bought out or was bought out. The list is endless.
WPP, Dentsu, Havas, True North, Publicis … no one wanted to be left behind. Most equations changed-WPP became the world’s largest advertising company, Publicis became much stronger (and the fifth largest in the world) when it acquired Saatchi and Saatchi.
Publicis has also wanted to acquire Y and R, but it was not to be. But it more than made up for that. Haves, on the other hand, acquired Snyder Communications. And on it went, and on it went.
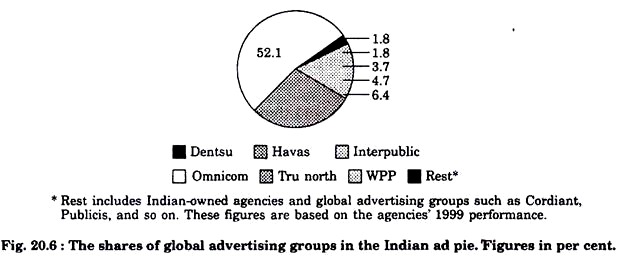
As far as the Indian scenario goes, foreign-owned agencies (which have 51 per cent or more of the equity) control 48 per cent of Indian advertising, or about half. Now, the equation looks like it is set to change. Among the major changes, if we can call them that, were that D’Arcy (once called DMB and B) acquired a 51 per cent stake in Ambience, Grey Global acquired 100 per cent stake in Trikaya Grey.
Moulis is claimedly now Moulis Euro RSCG, for the latter has presumably acquired 51 per cent in Moulis. That also puts it under the control of Havas Advertising. Another new entrant is Hakuhodo Percept—not just the old Percept, but a different agency.
Back to India (not that we ever left it). Among the major agencies that have not taken part or have not been included in this survey are Bates India (the erstwhile Bates Clarion); Concept Communication; Chadha Dhar and Hoon, Interads; FS Advertising; Arms, and of course, Lintas.
The reasons for non inclusion is either the auditing of accounts was not yet complete, or there was no way to authenticate the figures submitted, for they were provisional. In any case, only those agencies’ incomes have been considered that had either applied to the Agency Report last year, or, in other words, had supplied authenticated figures for the last year.
Some of those who weren’t there last year but have re-entered the charts are iB and W, Equus, Kamerad-News and SSC and B Lintas, among others. But enough about this year. The next year will perhaps be the same, given that the entire agency business climate is on a roll. For now, in any case. But as they say, tomorrow’s another day. One thing’s for sure-we can only be optimistic.
