Today, we see that the companies are spending crores of rupees (refer the big spenders) on advertising compaign. No doubt growing competition is a big motivator. Besides that media fragmentation and the rising clutter are the other reasons that lead to the growth of advertising expenditure of companies exponentially over the past couple of years.
But the important question is, what are the real gains? Since it is impossible to draw a direct correlation between ad volumes and sales, few marketers can say with any certainty just how much advertising is enough, and beyond what point ad spends start becoming counter productive.
In most cases, companies tend to err on the side of more, rather than less, while deciding their ad budgets. Egging them on often are their advertising agencies, that make most of their money from the 15 per cent commission on buying media. Thus, for new branches, agencies often tend to recommend spends for ‘brand building’ that verge on the absurd.
And for established brands, the formula they often flow is “share of voice” (SOV). Essentially, a brand’s share of voice is simply its advertising volume as a percentage of the volume for all brands in the same category.
ADVERTISEMENTS:
The big problem with the SOV formula is that it is directly proportional to competitive spends. Even if a single player in the market raises his ad budget, all other companies have to raise their own spends to keep their SOVs intact.
The big flaw, of course is, that it does not matter who is upping the ante first—the leader, the number two, the weakest player or even a new entrant. Is there any way of getting out of this vicious cycle? The method given below is used by the top agencies only for their biggest clients. And some of the shrewdest marketers, like Hindustan lever, use a similar model while working out their media budgets.
The starting point of this model is to first decide on the marketing objective for the brand in a particular area. For example, if the market objective is to defend share in a particular market; the media buying pattern will necessarily have to be different from what it would be if the goal is to develop a market.
Since there is only a limited amount of money that any marketer can commit to his ad budget, there could be three basic approaches he could follow:
ADVERTISEMENTS:
1. Defensive Strategy
2. Offensive Strategy
3. Market Expansion Strategy
Defensive Strategy:
Put the bulk of the budget in the area where the brand is already strong and the category sales as a whole is also growing. This is a ‘play safe’ option because the company is calculating that the ad spend will help the brand consolidate its position and increase market share, and also, keep rivals from eating into its market share.
Offensive Strategy:
ADVERTISEMENTS:
This strategy involves putting the maximum share of the budget in market where the product sales high, but the brand is not selling too well. Before this approach is used though, other factors need to be taken into account, for example, is the distribution strong enough to take advantage of the increased demand the advertising will generate? Or will the increased ad expenditure be enough to sustain the cost of development.
Market Expansion Strategy:
This can be used in markets the company thinks are under developed for the product category as a whole. That is, the market might have enough potential but no player has really put in any effort to increase sales so there is ample opportunity for the company which tries first.
The market opportunity index (MOI) helps decide which markets one should focus on.
To calculate the MOI, two other terms need to be understood.
ADVERTISEMENTS:
1. The Brand Development Index (BDI):
This is essentially the percentage of the brand’s sales in a particular market divided by the population of that market in percentage terms. To give an example, if Maharashtra accounts for 12 per cent of Videocon’s sales and 13 per cent of the country’s total population, the BDI will be 12/13 = 0.92.
2. The Category Development Index (CDI):
This is the sales of the category in percentage terms for a particular market divided by the population, again in percentage terms. For example, if Maharashtra accounts for 20 per cent of all colour television sales its CDI will be
The MOI (market opportunity index) is the ratio of CDI to BDI.
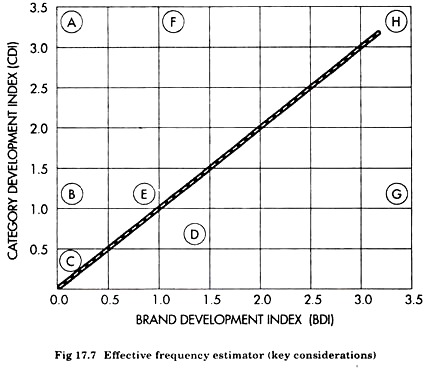
Now let’s take a look at how the MOI can be used. Consider Fig. 17.7, which can be used to chart out the MOI for brand X.
The area around (F) shows that while the BDI is high, the CDI is even higher. That means the brand still has scope to grow in that market.
ADVERTISEMENTS:
The area surrounding (D) has a very high BDI composed to the CDI. Thus it is a market where brand is very strong vis-a-vis competitors.
The area near (E) has both a BDI which is almost exactly balanced by the CDI. That means that the brand is doing as well as it competitors in that particular market.
Thus all the three markets would be key priority areas for the company for different reasons. The area around (F) simply because the company can do better in that particular market. The area around (D) because the company needs to keeps its dominant position intact in that territory. And the area near (E) because the company could lose market share to competitors if it does not pay attention.
Then again, the area near (A) has a high CID but low BDI. that means the brand is almost non-existent in that area but market is highly developed as for as the product category is concerned. So this would be a high market opportunity area where the company could only gain by increasing its advertising.
ADVERTISEMENTS:
The area around (C) has both a low CDI as well as low BDI. So it is not a particularly good market to put large amounts of advertising money in—unless we have found a way to turn this market on.
Typically, a company can use the MOI this way while deciding its ad budgets.
In areas where both the CDI and BDI are high, and in all areas where BDI is high, but CDI is low, the company can maintain its ad spends at more or less at the current levels unless competitors radically increase their ad spendings.
On the other hand, in all the areas where CDI is high but BDI is low, MOI is greater than 1, the company needs to increase its ad budgets simply because it is not doing as well as it should be doing.
Of course, the MOI is only the first step. Essentially, it provides the tools to a company to prioritise the different markets (states) and each market’s potential. After that there are other factors that need to be weighed in.
Some of the important ones are:
ADVERTISEMENTS:
(a) Competitive Advertising Noise:
The MOI will essentially show just the potential of the market for the brand and not what kind of advertising the competitors are doing. So after deciding on the priority areas, the competitive ad noise has to be factored in.
(b) Other Marketing Factors like Distribution Strengths:
This is necessary simply because no amount of advertising in a high MOI area will help if the brand’s distribution net-work is too weak to take advantage of the same.
(c) Delivery Pattern of National Advertising:
This is necessary to estimate local market requirements.
ADVERTISEMENTS:
(d) The Kind of Reach Different Media Present in the Market:
The next issue is to decide the effective frequency. Effective frequency is essentially how many times the brand needs the target audience to see the ad in order to elicit a response. For example, it may be decided for a particular campaign ideally the target audience should see five or more advertisements over five months. And the effective reach of the schedule would simply be the percentage of the target audience seeing five or more ads within that time.
Of course, effective frequency cannot be pertinent without taking into account to other points:
1. Frequency of what?
2. Frequency when.
Frequency of what? essentially looks at what a particular media can deliver. The old opportunity-to-see (OTS) promised by various media can help in deciding on which media to pick in a particular market.
ADVERTISEMENTS:
Frequency when takes a look at the time span when the effective frequency can be maximised. For example, for a consumer non-durable like soaps, say, the ideal time frame would be four weeks, which reflects a typical house hold purchase cycle.
The issue of effective frequency is best solved by asking the following question:
“How many times does a typical number of the target audience need to see this particular advertisement within the evaluation period to stand a reasonable chance of responding to its message?”
Here, media research studies can help advertisers get a hold on what is a suitable baseline for different products and services, based on local competitive environment.
From the base line, it is possible to arrive at an effective frequency target for a particular campaign.
Different campaigns will have very different frequency targets. For example:
ADVERTISEMENTS:
1. A new product launch or new positioning. (That’s easy: at the launch phase, for its vaccumizer, Real value needs to place the greater weight at the launch phase to announce its arrival).
2. Deep rooted attitudes to be changed (Therefore, cadbury’s Dairy milk will need a greater message frequency if it attempts to change attitudes among adults towards chocolates).
3. A particularly unreceptive audience (who cares about car batteries, anyway?)
4. A new message to put across.
5. A new advertisement.
6. A complicated message (what did the Compaq ad try to communicate?)
ADVERTISEMENTS:
7. An obtrusive advertisement (any danger of the OCM ad getting lost in the feature film capsule?)
8. A low level of advertising in the recent past.
9. A large amount of competition.
10. A high level of media clutter (it seems there are few brands that aren’t on DD metro feature film!)
11. Use of medium with low involvement of target audience.
In setting an upper threshold, two other questions need to be asked:
1. “What is the greatest number of times a typical member of the target audience could see the advertisement without becoming bored or irritated””
2. How many times does a member of the target audience have to see a commercial before we are sure that an additional exposure will not produce any additional response?
The first question leads to the use of effective reach as a measure of effectiveness, the second, a measure of efficiency.
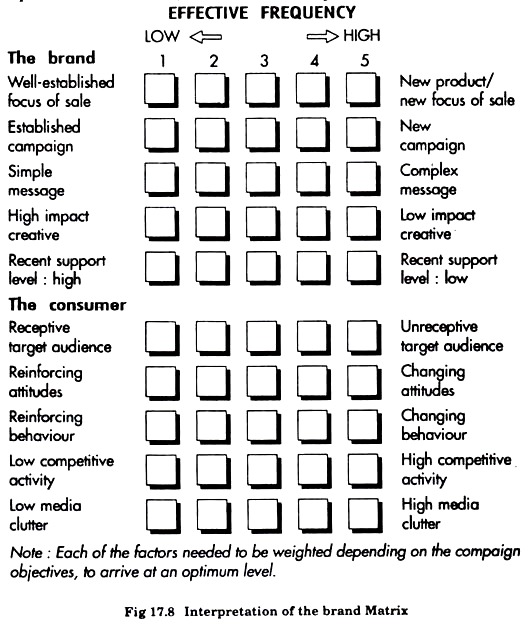
That’s where the frequency estimator (Fig 17.8) can play an useful role.
The Issue of Effective Reach:
Having defined objectives for effective frequency it is possible to arrive at likely levels at effective reach for different types of media schedule if the media budget is limited. Take for example, the effective reach of a campaign for a brand like vanity fair, a women’s brand of lingerie.
Now, the build-up coverage and frequency of a TV schedule using a high proportion of prime-time national net-work will clearly differ from one using the same budget scheduled over the after-noon-slot. While prime time gives high coverage (reach) but low frequency, the afternoon slot gives high frequency against the small group of housewives who are at home also watching during the day.


