Inter-firm Comparison has also been defined as … a technique, which detects the short- comings in production efficiencies of the participating firms in a given industry.
Inter-firm comparison may be defined as “A management technique by the use of which it is made possible for an organisation to compare its performance with that of the other units engaged in the same activity.”
In other words, inter-firm comparison is a technique of evaluating the relative performance, efficiency, costs and profits of different firms in an industry engaged in the same line of business activity. Inter-firm comparison is not possible unless the like is compared with the like.
Contents
- An Overview of Inter Firm Comparison
- Introduction to Inter Firm Comparison
- Definitions of Inter Firm Comparison
- Purposes of of Inter Firm Comparison
- Objectives of Inter Firm Comparison
- Requirements of Inter Firm Comparison
- Difference between Inter Firm Comparison and Uniform Costing
- Advantages of Inter Firm Comparison
- Limitations of Inter Firm Comparison
What is Inter Firm Comparison: Overview, Introduction, Definitions, Examples, Purposes, Objectives, Requirements, Difference, Advantages and Limitations
What is Inter Firm Comparison – An Overview
Each industry comprises a number of industrial undertakings engaged in the production and sale of similar type of goods and services. These undertakings differ in their size, degree of automation, sales, capital invested and employed, territorial operation, production capacity, number of employees, ownership, etc.
ADVERTISEMENTS:
Though the efficiency, profitability, utilization of resources, debt paying ability, etc., of an undertaking can be evaluated by comparing its performance during the current year with that of immediately preceding three to four years, its success cannot usefully and gainfully be judged in isolation.
For example, the information that Anamika Company has earned Rs.1 crore of profit or 10% return on its capital or both do not enable to conclude whether the amount of profit or the rate of profit is satisfactory or not, whether it is higher or not. One should, therefore, compare its results with that of other firms in the industry as the norms set, or the results achieved, by other firms act as better yardsticks to measure, assess and judge its success.
This type of comparison of both the financial performance and the physical performance of an organization with that of other firms in the industry enables the managerial personnel to identify the weak spots and to identify the probable reasons for the purpose of taking suitable remedial measures, it is due to this factor that this technique (viz., Inter-firm Comparison) is gaining popularity in the recent years slowly but steadily.
Inter Firm Comparison – Introduction
In a competitive situation, it is mandatory to have a comparison with the other similar organisation for finding out sales, profits and other matters. When the profit of one organisation is compared with the profit of another organisation, it is known as inter-firm comparison. Inter-firm comparison is important for serving any organisation. If the profits are less in comparison to other organisation, efforts are to be made to increase this position.
ADVERTISEMENTS:
It is a management technique, which makes it possible to compare the performance of one organisation with the other organisation. This performance is compared in terms of efficiency. Cost and profits.
This information is pooled voluntarily by the firms, then inter-firm comparison is made. This comparison is made in code with the help of various rate under it, and each firm is given a code number, so that the information may be kept secret, and confidential.
Inter Firm Comparison – Definitions
Many experts have made endeavour to define Inter-firm Comparison (IFC) in different ways emphasizing on one or the other. And all these definitions lay emphasis on the procedural mechanism of Inter-firm Comparison bringing out simultaneously the importance of the technique.
ADVERTISEMENTS:
This point becomes obvious from the following excerpts:
Inter-firm Comparison has been defined as………… a voluntary, confidential and anonymous pooling of key management data for the purpose of providing to the management of each participating firm with figures which will help to show how the performance of its firm compares with that of other similar ones and what the reasons for the differences are.
It has also been defined as … a form of co-operation – co-operation for exchange of experience and information between firms – with a view to increasing productivity and contributing to the economic welfare of the community as a whole.
Inter-firm Comparison has also been defined as … a technique, which detects the short- comings in production efficiencies of the participating firms in a given industry.
ADVERTISEMENTS:
Bhar has defined Inter-firm Comparison as … the technique of evaluating the performance, efficiencies, costs and profits of firms in an industry.
The above definitions are self-explanatory in nature. If an attempt is made to put these definitions into a detailed analysis, it spells out three important aspects viz.,
(a) role and importance of Inter-firm Comparison
(b) some of the pre-requisites for the introduction of an effective scheme for Inter-firm Comparison and
ADVERTISEMENTS:
(c) the procedure for establishing a sound scheme for Inter-firm Comparison among the companies in an industry.
It is necessary to identify one important aspect at this stage. In the above definitions, one can notice the phrases participating firms, between firms, participating firms in a given industry, firms in an industry, etc. These imply that the performance of one company with that of another company in the same industry may usefully be compared.
For example, the profitability of Karnataka State Road Transport Corporation may be compared with that of Rajasthan State Road Transport Corporation.
It is because of the reason that both the organizations are engaged in rendering transport service to the traveling public. Further, their primary objective is to render more qualitative transport service to the general public with minimum possible fares. And the profit objective is kept as secondary.
ADVERTISEMENTS:
As a result, the profitability of a state road transport corporation cannot usefully be compared with that of a company in the Electronics Industry. Of course, inter-industry comparison may also be made but with limited scope and use.
Inter-firm comparison may be defined as “A management technique by the use of which it is made possible for an organisation to compare its performance with that of the other units engaged in the same activity.”
In other words, inter-firm comparison is a technique of evaluating the relative performance, efficiency, costs and profits of different firms in an industry engaged in the same line of business activity. Inter-firm comparison is not possible unless the like is compared with the like.
Consequently, uniform costing system is a prerequisite to inter-firm comparison. This management technique involves pooling of relevant information by the various units of an industry through a central coordinating organisation. The information thus pooled is analysed and presented in a suitable form for the benefit of the member-units.
Inter Firm Comparison – Purposes
The main purpose of inter-firm comparison is to identify weak spots which may exist in the member units and improve operating efficiency.
ADVERTISEMENTS:
When production and cost data are presented by way of voluntary exchange of information, the less efficient firms will have the opportunity of comparing the achievements – Self-assessment by such firms may reveal weaknesses and inefficiency In the light of information pertaining to more efficient firms; the less efficient ones will be able to improve their efficiency.
For purposes of inter-firm comparison, firms supply relevant information on costs, profits and production to an impartial central body which acts as a coordinating organisation. The information supplied is not in absolute terms. With a view to maintaining secrecy of information, data are analysed and presented in the form of ratios. In the first instance, however, differences in production and cost structures are taken into consideration.
Later, a performance standard which is fair and reasonable to all the units is established. Subsequently, the information received from the different units is pooled, analysed and supplied to all the units in the form of ratios.
Performance and results of the less efficient units are compared with those of more efficient ones with the help of the ratios supplied by the central body. Self-assessment by the less efficient units may reveal their own weaknesses which these units try to overcome by improving their standards of efficiency.
Inter Firm Comparison – Top 4 Objectives
(1) Act as an Incentive
ADVERTISEMENTS:
The main aim of inter-firm comparison is to act as an incentive to increase productivity and efficiency of the organisation.
(2) Challenging the Standards
It enables the management to challenge the standards set by the firms.
(3) Comparison
It compares the performance with other firms in order to know the relative position of other organisations.
(4) Improvement Chances
ADVERTISEMENTS:
Under this system, chances of improvements are there for the other units, and they are given chances for further improvement in the working of their units.
Inter Firm Comparison Requirements – Establishment of a Central Organization, Comparability of Firms, Method of Presentation and More
While introducing a scheme for Inter-firm Comparison, it is necessary to consider, ensure, decide and follow the following:
Requirement # 1. Establishment of a Central Organization:
There is a need for a central organization which is of course a neutral body enjoying the confidence of all the participating firms. It should not belong to, or identify itself with, any one organization.
Collection of data from the member-units, analysis of the data so collected, making a comparative study, presentation of results of such a comparative study, carrying out researches, organizing workshops, seminars and conferences, and extending consultancy service, etc., are some of the important functions of the central organization.
All these must be done by the centre for the benefit of not one or the other but for the benefit of all the participating firms and the economy as a whole.
ADVERTISEMENTS:
The centre is able to discharge its responsibility only when it is able to win the confidence of the participating firms which depends upon its actions, service, contribution, credibility, etc. Otherwise, no firm furnishes the required data which is very essential for Inter-firm Comparison.
Because, if the participating firms are given to understand that the centre is striving to promote the interest of one or few companies, other firms certainly refuse to furnish the data as the furnishing of data is not mandatory but voluntary.
Further, the firms in an industry may refuse to become the members of the centre and to participate in the scheme. Thus, setting up of a central organization is a prerequisite and the extent to which the firms extend their co-operation and take active participation and also the extent to which the firms are benefited from the scheme depend on the ability, honesty, dedication, etc., with which the centre functions.
Inter-firm comparison has made a rapid headway in the industrially developed economies by setting up special organizations. For example, the Centre for Inter-Firm Comparison was established by the British Institute of Management and the British Productivity Council way back in 1959.
The government expects the following, among others, from the Centre – spreading the knowledge of Inter-firm Comparison technique widely throughout the industry, ensure that more such comparative studies are undertaken and make a real contribution to the improvement of industrial efficiency and productivity.
The Government provides even the financial assistance to the Centre. In the same way, one can find the British Federation of Master Printers, The British Steel Founders Association, etc., in the United Kingdom exclusively for this purpose.
ADVERTISEMENTS:
But unfortunately, there is no such central organization in India for Inter-firm Comparison. Hence, the managerial personnel have to rely on journals and periodicals which publish useful statistics periodically.
However, the industrial undertakings in each industry have formed their own associations (e.g., Association of State Road Transport Undertakings, Pune) and these associations, National Productivity Council, Chambers of Commerce, Research and Statistical Department of Government of India, associations of manufacturers, Bureau of Public Enterprises, etc., are functioning as centres for Inter-firm Comparison though not exclusively for this purpose.
Thus, in order to introduce a scheme for Inter-firm Comparison, it is necessary to establish a central organization to which the entire responsibility of comparing the performance and position of one organization with that of other firms may be entrusted. It may be in the form of either a manufacturers’ association or a chamber or a federation of business houses or a specially set up centre for introducing and implementing Inter-firm Comparison scheme or in any other convenient form.
Requirement # 2. Adoption of Uniform Costing Principles and Practices:
Inter-firm Comparison stands on a sound principle of like should be compared with likes. The adoption of Uniform Costing is, therefore, a pre-requisite for the successful implementation of Inter-firm Comparison scheme.
Diverse accounting principles, practices, methods, etc., pursued and followed by the member-firms vitiate the comparability of the data collected by the central organization from the member-organizations.
ADVERTISEMENTS:
For instance, assume that the purchase price of a Leyland Bus (heavy vehicle) is Rs.4 lakh with a scrap value of Rs.25,000 at the end of its estimated useful life of 15 years or 7,24,050 kilometres whichever is earlier.
It may be remembered here that the business enterprises are having a number of approaches to compute the annual depreciation and all the approaches have the acceptance of the competent authority as based on sound accounting principles.
Two such approaches, most relevant to this situation, are Straight Line Method and Production Units Method. Assume that the Karnataka State Road Transport Corporation (KSRTC) prefers Straight Line Method and Andhra Pradesh State Road Transport Corporation (APSRTC) prefers Production Units Method. Assume further that both the corporations have operated their vehicles for 1,07,310 kilometres each during the first year.
Now the annual depreciation can be calculated for one year for both the corporations as shown below:
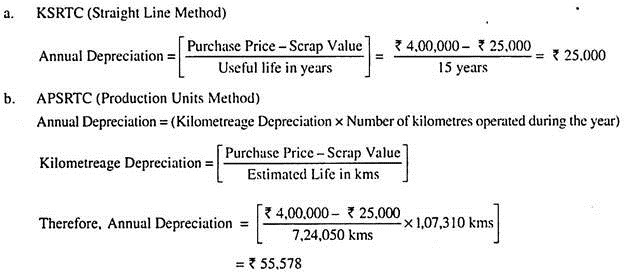 From the above computations, it is certain that APSRTC charges Rs.30,578 more depreciation than KSRTC to its operating cost. As a result, its profit will be lowered by Rs.30,578. Because of this difference in the method of depreciation, KSRTC reports Rs.30,578 more profit than APSRTC.
As it is known, it is not due to its efficiency. As the corporations are following diverse accounting methods, it is not possible to obtain the profit figures and/or cost figures of comparable value.
It is, therefore, necessary to persuade the member-units to follow the same Costing principles and practices so that the central organization receives the data which are having maximum comparable value.
What the central organization has to do in the above case is to convince these corporations and also other participating corporations to follow either the Straight Line Method or Production Units Method uniformly.
That means, all the participating firms must use either the Straight Line Method or the Production Units Method. Then only, the central organization is able to obtain information of comparable value. The Association of State Road Transport Undertakings, Pune has suggested an alternative but a uniform method to its member-corporations to compute the depreciation on their fleet.
The method is to compute the depreciation under both the methods and to take the amount whichever is higher to the Profit and Loss Account as the vehicles depreciate due to both the age and usage.
From this illustrative analysis, it is unequivocal that a sound and an effective Inter-firm Comparison is impossible unless uniform principles and practices of Costing are adopted by the participating firms.
Requirement # 3. Comparability of Firms:
Each industry comprises of a large number of small scale organizations, a small number of large scale organizations and also a moderate number of medium scale organizations from the view point of sales turnover, capital employed, number of employees, production, etc.
For example, Out of 57 state road transport corporations (which are members of the Association of State Road Transport Undertakings, Pune) for which the fleet data is available, 42 corporations are having up to 1,500 vehicles each, 5 corporations are having above 6,000 vehicles each and the rest of 10 corporations are having 1,500 to 6,000 vehicles each.
Though all the enterprises in the industry provide comparable data (if they follow Uniform Accounting procedure), the difference in size, degree of mechanization, capital employed, sales volume, production, etc., pose some practical difficulties.
Even in this situation of difference in size, certain overall indicators (such as Profit as a percentage of Capital Employed, Profit as a percentage of Sales Revenue, etc.,) can be computed and used for Inter-firm Comparison.
As far as the detailed analysis is concerned, it is advisable (with the objective of obtaining the best result from a scheme of Inter-firm Comparison) to classify the organizations into two or more convenient categories on some sound and suitable basis such as – capital employed, sales turnover, operational territory, production capacity, etc. This is necessary as a number of items of revenue, cost, etc., are influenced by the size of the organization.
For instance, the amounts of revenue, cost, profit, etc., differ from Mofussil service to city service in the case of passenger road transport. Though one can apply some yardsticks to compare the performance of corporations, it is desirable, for the purpose of meaningful comparison, to classify the corporations into a few groups on the basis of their area of operation.
On the basis of whether a corporation is operating only in city area or Mofussil area or both city and Mofussil area, the state road transport corporations in India can be classified into three broad categories. The last category (viz., operating both city and Mofussil services) can further be classified into few groups on the basis of the percentage of kilometres operated in city area to the total kilometres operated (in both city and Mofussil area) by a corporation.
The classification is shown below:
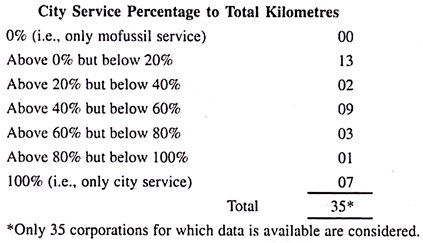
This way, the participating firms shall be classified into few convenient groups according to some common characteristics so that both the overall and the detailed performance can effectively and gainfully be evaluated and compared.
Requirement # 4. Nature and Extent of Information to be Collected:
In the earlier years, the scope of Inter-firm Comparison was confined only to the financial performance of the participating firms. As a result, the data collected during those days was restricted to the financial performance data. But with the passage of time, the scope of Inter-firm Comparison has been extended even to cover the comparison of physical performance accomplished by the firms.
Due to the realization and recognition of the importance of Inter-firm Comparison and also due to the rapid widening in the scope and coverage of Inter-firm Comparison in the recent years, practically there is no limit for the type, extent, nature, quantum, etc., of information to be collected from the participating firms by the central organization.
Anyhow this is largely influenced by a number of factors such as the scope and purpose of Inter-firm Comparison, the expectations of the participating firms, ability of the central organization and the extent of co-operation extended by the member-units in the form of providing information to the central organization.
Further, collection of data in a mass scale may not be a desirable one as the same may lead to a sort of confusion and to a situation wherein all the data so collected may not be utilized fully and gainfully.
This may simply increase the cost of collection of information. It is, therefore, necessary to collect only the minimum required information which is adequate for a comprehensive study and comparison.
However, it is almost an impossible task to present a list of information which would suit all the industries, as it differs from one situation to another.
Anyhow, information is usually collected about the following but not restricted only to these:
i. Element-wise and behaviour-wise costs and total cost,
ii. Stock of raw materials, their consumption and inventory turnover ratio,
iii. Wage structure, labour cost and incidence,
iv. Labour productivity, idle time and overtime work,
v. Capacity utilization,
vi. Wastage of raw materials and labour time,
vii. Production methods and other technical aspects (if they are not confidential),
viii. Reserves, return on capital employed, appropriation of profit,
ix. Position of debtors and creditors,
x. Liquidity,
xi. Gross profit, net profit, and their percentages to sales,
xii. Capital turnover,
xiii. Output per employee per hour, etc.
Requirement # 5. Method of Collection of Information:
The required information which constitutes the base for Inter-firm Comparison shall be collected from the participating firms periodically say, once in a year. Because, most of the figures can be obtained only at the end of the accounting year from the annual reports prepared and published by the participating firms by using Uniform Accounting principles and practices.
One can witness a significant improvement in the preparation and contents of corporate annual reports and these comprise not only the financial data but also the physical performance data; not only the data about the current year but also about the immediate previous year/s.
As a result, much of the required data can be gathered from these reports. But care should be taken by the centre to ensure that the firms have followed the uniform procedure.
Additional information may be obtained whenever required by asking the member-firms to furnish them in a suitably designed standard form. Normally, the central organization supplies the standard form to all the member-units well in advance.
The centre must request the participants to furnish their accounting and performance data using the standard definitions of the terms provided and also uniform procedure evolved and communicated to the participating firms.
Requirement # 6. Method of Presentation:
The above information so collected by the central organization is properly sorted out for analysis, interpretation and presentation to the member-firms. For the sake of maintaining secrecy,
i. The data shall be handled under security conditions and shall appear anonymously in the consolidated report which shall be made available only to the member-firms and not to any other firm,
ii. Only the ratios with respect to various functional performances – both physical and financial performances are included in the consolidated report but not the absolute figures even if they are supplied by the member-organizations, and
iii. Each member-firm is allotted a code number by the central organization and the identity of the organization is not disclosed in the comprehensive report but the organization is supplied with the key to its own number and not with the key to code numbers of other organizations.
In recent years, a number of ratios have been devised for Inter-firm Comparison as they establish a meaningful relationship between various factors having cause and effect relationship in a firm and compare each such relationship with those obtained for other member-organizations. The ratios indicate the relative efficiency, profitability, etc., of an organization and assist in planning for the future.
Some of the very important and useful ratios which are presented here in under are that of the ratios and the practice followed by the British Federation of Master Printers:
i. First Level Ratio:
First level ratio is known as primary ratio as it indicates the overall performance of an organization by establishing the relationship between the amount of profit and one of its determinants viz., value of assets employed. As it is always expressed in terms of percentage, it indicates the amount of operating profit earned for every one hundred rupees of capital employed on assets.
For example, assume that Aniketana Company and Sahyadri Company are the two companies engaged in similar type of activities. The average capital employed during a year in these companies comes to Rs.20 crore and Rs.30 crore respectively. During the same year, they have earned an operating profit of Rs.3 crore and Rs.4 crore respectively. Therefore,
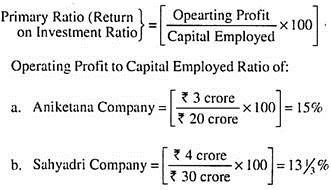
From the profit figures available in the illustration, it can be concluded that Sahyadri Company is more profitable than Aniketana Company which has been proved wrong from the ratios calculated and presented above.
Aniketana Company is more profitable than Sahyadri Company as it has earned a profit of Rs.15 for every Rs.100 of capital employed as against Rs.13⅓% for every Rs.100 of capital employed in Sahyadri Company.
Anyhow, the difference in the rates is certainly due to the difference in the determinants. The reason for this difference may be identified by computing the second level ratios.
ii. Second Level Ratios:
The primary ratio is further analysed into its constituent ratios which form the second level ratios and which are also known as the secondary or explanatory or supporting ratios explaining the reason for the high or low Operating Profit to Assets Employed.
It may be remembered here that the first level ratio viz., Operating Profit to Capital Employed is the product of two ratios (i.e., second level ratios) viz., Operating Profit to Sales and Sales to Assets Employed. Therefore,

Operating Profit to Sales Ratio shows the percentage of sales revenue remaining left after the cost of sales is deducted from the revenue. As the profit is earned on the sales, increase in the amount of profit leads, usually, to increase in return on capital employed on assets.
Sales to Assets Employed Ratio indicates the revenue generated by each rupee of capital employed on assets. Assume, therefore, that Aniketana Company and Sahyadri Company have earned sales revenue of Rs. 20 crore and Rs. 30 crore respectively during the year.
Therefore,

From the above calculations, it is categorical that both the companies are equally efficient from the view point of sales to capital employed as both the companies have earned Rs.1 sales revenue for every Rs.1 of capital employed on their assets. That means, the difference in the Operating Profit to Assets Employed is not due to the Sales to Capital Ratio (popularly called Capital Turnover Ratio).
But it is due to the other determinant viz., operating profit which is unequivocal from Operating Profit to Sales Ratio. It is also clear from the Operating Profit to Sales Ratio calculated above that Sahyadri Company’s profit has not increased proportionately. Because, the amount of capital employed in Sahyadri Company is 50% more than that of Aniketana Company.
Further, Sahyadri Company has earned 50% more revenue than Aniketana Company. But its (i.e., of Sahyadri) profit is only 33⅓% more than that of Aniketana Company.
At this stage of analysis, it can be said that failure of Sahyadri Company to keep a vigilant eye on various elements of costs is responsible for its comparatively poor performance. The reasons for the difference in the profits may further be analysed and identified by computing third level ratios.
iii. Third Level Ratios:
The third level ratios are in the form of General Explanatory Ratios accounting for the differences in the second level ratios. For example, in the illustration used above, if Aniketana company has incurred Rs.14 crore, Rs.1 crore and Rs.2 crore of factory cost, administrative expenses, and selling and distribution expenses respectively; whereas these items of expenses for Sahyadri Company come to Rs.22 crore, Rs.1.5 crore and Rs.2.5 crore respectively.
With this information, a few third level ratios can be computed to find out the extent to which different items of costs have caused the difference in the profit and the rate of profit.
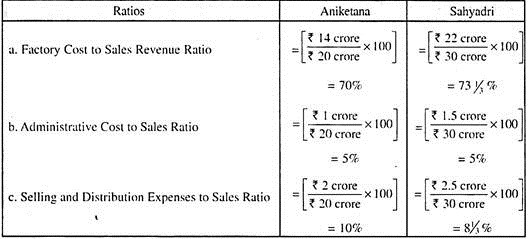
From the above calculations, the following conclusions may be drawn:
a. The Operating Profit to Sales Ratio of Sahyadri Company has lowered by 3⅓% by the excess factory cost. It is because of the increase in the factory cost at a higher rate than that of the sales revenue. If factory cost and sales revenue of both the companies are compared, it reveals that the factory cost of Sahyadri Company is 57.14% more than that of Aniketana Company whereas revenue is only 50% higher than that of Aniketana,
b. As far as administration cost is concerned, there is a proportionate increase compared to the increase in the sales revenue of Sahyadri Company. Therefore, it has not affected the profit either favourably or adversely, and
c. From the view point of selling and distribution expenses to sales, Sahyadri Company has achieved some savings. Though there has been an increase in the absolute figure, it has not increased proportionately but less than proportionately. Consequently, Sahyadri Company’s Profit Ratio has increased by 1⅔% compared to Aniketana Company.
With these, the Operating Profit Ratio accomplished by Aniketana Company can be reconciled with that of Sahyadri Company listing out the broad factors responsible for the difference.
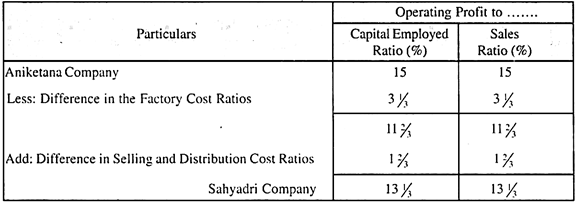
Factory cost comprises of Direct Material Cost, Direct Labour Cost and Factory-on-cost (i.e., Factory Overhead Expenses). The difference in the Factory Cost Ratios might have been influenced by any one or all or any combination of these three elements. The element/s of cost which is/are responsible for the reported difference can be located by computing the fourth level ratios.
iv. Fourth Level Ratios:
Fourth Level Ratios are Specific Explanatory Ratios accounting for the differences in the General Explanatory Ratios. These ratios pinpoint the specific reasons for the poor performance or otherwise of an organization.
Assume that, factory cost of Aniketana Company comprises of Rs.6 crore, Rs.4 crore and Rs.4 crore of direct material cost, direct labour cost and factor-on-cost respectively; whereas these figures for Sahyadri Company come to Rs.10 crore, Rs.7 crore and Rs.5 crore respectively.
With the help of these figures, various cost ratios can be computed as shown below:
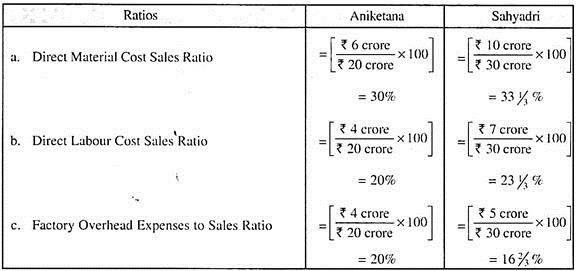
From the above calculations, it is obvious that Sahyadri Company has achieved more economies in factory overhead expenses compared to Aniketana Company but failed to achieve the same in respect of direct material cost and labour cost which has an adverse impact on the profit and profitability. With this, the reasons for the difference in the Factory Cost Ratios can be summarized in the form of a reconciliation.

This way, different level ratios may effectively be used to unearth the exact reasons for the difference in the reported results of the participating firms. It may be noted here that the ratios presented in the pyramid structure considered only the operating profit but the central organization reckons not only the operating profit but also the net profit which can be arrived at after considering the non-operating expenses and revenues.
It also considers the appropriation policy and the physical performance accomplished by the participating firms with respect to various items of input factors. That means, the number of ratios that the central organization uses for the purpose of comparative evaluation is not restricted only to the above ratios.
Normally, it uses some other ratios also for the purpose of assessing liquidity, solvency, physical performance, etc., of the member-organizations. Some other ratios which are of great significance are rate of growth in sales, and share of the company in the market.
The central organization must take special care while interpreting the results of the comparative analysis to highlight why the performance indicators of an organization differ from those in the industry. At the end of this, a comprehensive report is prepared and supplied to the member-firms for taking corrective action.
The comparative data included in the comprehensive report enable the participating firms to check their efficiency against that of other firms in the industry and to track down areas of weaknesses and strengths within the firm which may be responsible for differences between its profitability, efficiency, stability, etc., and that of other firms.
Difference between Inter Firm Comparison and Uniform Costing
The difference between inter firm comparison and uniform costing are given below:
Inter-Firm Comparison:
1. Inter-firm comparison is the technique by which performances, efficiencies, productivity, costs and profits of various firms in the same industry are evaluated and compared.
2. The prerequisite for the above comparison is the adoption of uniform costing system.
3. In the absence of uniform costing, it may not be possible to have a meaningful inter-firm comparison.
4. Inter-firm comparison is a better tool for managerial control because the standard set within the organisation may be improved upon by means of a comparison with the other firms in the same industry so that efficiency is increased in the various aspects and profits are maximised.
Uniform Costing:
1. Uniform Costing means the use of same costing principles and/or practices by the several firms of the same industry.
2. It provides a complete system of costing for adoption by all the units in the same industry.
3. It facilitates inter-firm comparison.
4. When the uniform costing system is followed by the individual firms and units, the cost figures will indicate a comparative position. Then comparison of performance is made for the benefit of all the constituent units.
Inter Firm Comparison – Main Advantages
Uniform costing is the basis of inter-firm comparison. As such, all the advantages of uniform costing are also the advantages of inter-firm comparison.
These advantages are:
(a) Improved methods of production and technical knowledge of the superior firms become available to the less efficient firms also.
(b) Fixation of performance standards reveals operating inefficiencies which can be removed by remedial action.
(c) Inter-firm comparison facilitates research and development.
(d) It improves productivity of labour, usage of material and utilisation capacity.
(e) Promotes standardisation of materials, labour operations and equipment.
(f) Guards secrecy of absolute data.
(g) Eliminates unfair competition.
(h) Acts as a tool of cost reduction.
(i) Assists Government in industrial development and regulation through appropriate policy measures.
(j) Facilitates export promotion by increasing the competitive strength of the industry.
(k) Makes possible the fullest utilisation of available resources.
(I) Promotes cost consciousness among the participating units.
(m) Helps negotiate with trade unions.
Some other advantages can also be obtained from Inter-firm Comparison:
1. The extent of weakness or improvement in the performance of the participating firms is spotlighted and therefore, each organization may make attempts and put their best effort to improve the productivities of all the input factors by taking suitable remedial actions.
2. It creates and develops a sense of cost consciousness among the member-units resulting in a tendency to control and reduce unnecessary costs which add neither to the quality nor to the life nor to the utility, etc., of the product,
3. It creates a healthy competition among the member-units wherein each firm tries to improve its performance in relation to that of other manufacturers. This healthy competition is possible as the central organization provides a common platform to all its member-units to participate and contribute to the successful implementation of the scheme, and
4. The central organization extends its helping hand to all the firms, if they need. Further, the central organization may undertake some research and development projects for the benefit of all the units which in turn benefit the industry.
It can also take up the problems of the members and the industry with the government as the central organization represents the member-units and has a complete idea and data about the problems of the industry.
Inter Firm Comparison – Limitations
The various limitations of inter firm comparison are:
(i) The need for inter-firm comparison may not be appreciated by the more efficient firms in the absence of goodwill and cooperation extended by them.
(ii) A number of firms in the industry may rest content with the existing level of profit.
(iii) Firms may not be prepared to disclose information relating to their production and cost structure.
(iv) The information supplied, may not, in a large number of cases, be reliable.
(v) Comparison may be rendered difficult due to non-availability of proper bases.
(vi) Establishment of a central organisation is also difficult.