
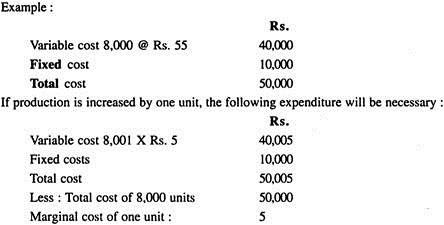
Marginal cost means the same thing as variable cost. The term is not a new one. The accountants’ concept of marginal cost differs from Economists’ concept of marginal cost. Economists define marginal cost as the additional cost of producing one additional unit.
The Institute of Cost and Works Accountants of India defined marginal cost as, “the amount at any given volume of output by which aggregate costs are changed, if the volume of output is increased or decreased by one unit”.
According to Dr. Joseph, Marginal costing is a technique of determining the amount of change in the aggregate costs due to an increase of one unit over the existing level of production. As such, it arises from the production of additional increments of output.
Contents
- Definitions of Marginal Cost and Marginal Costing
- Features of Marginal Cost
- Basic Characteristics of Marginal Cost
- Key Factor or Limiting Factor
- Profit-Volume Ratio
- Profit/Volume Graph
- Margin of Safety
- Break Even Point
- Break-Even Chart
- Contribution in Marginal Costing
- Decision Making
- Difference between Marginal Costing and Absorption Costing
- Advantages of Marginal Cost
- Disadvantages of Marginal Cost
Marginal Cost: Definitions, Features, Formula, Profit-Volume Ratio, Example, Break Even Point, Difference, Advantages, Disadvantages and More
Definitions of Marginal Cost and Marginal Costing
Marginal cost means the same thing as variable cost. The term is not a new one. The accountants’ concept of marginal cost differs from Economists’ concept of marginal cost. Economists define marginal cost as the additional cost of producing one additional unit.
ADVERTISEMENTS:
This shall include an element of fixed cost also. Moreover, the economists’ marginal cost per unit cannot be uniform with the additional production since the law of diminishing or increasing returns is applicable; whereas the accountants’ marginal cost shall be constant per unit of output with the additional production.
The Institute of Cost and Works Accountants of India defined marginal cost as, “the amount at any given volume of output by which aggregate costs are changed, if the volume of output is increased or decreased by one unit”.
Here a unit may be a single article, a batch of articles, an order, a stage of production capacity, a process or a department.
ADVERTISEMENTS:
To ascertain the marginal cost, we need the following elements of cost:
(a) Direct materials
(b) Direct labour
(c) Other direct expenses, and
ADVERTISEMENTS:
(d) Total variable overheads.
That is, Marginal cost = Prime cost + Total variable overheads.
OR
Marginal Cost = Total Cost – Fixed Cost.
ADVERTISEMENTS:
Marginal costing is defined by the ICWA as, “the ascertainment by differentiating between fixed costs, and variable costs, of marginal costs and of the effect on profit of changes in volume or type of output”.
According to Dr. Joseph, Marginal costing is a technique of determining the amount of change in the aggregate costs due to an increase of one unit over the existing level of production. As such, it arises from the production of additional increments of output.
Batty defines Marginal Costing as “a technique of cost accounting which pays special attention to the behaviour of costs with changes in the volume of output”.
Marginal Cost – Features
The features of marginal cost are:
ADVERTISEMENTS:
(a) It is a cost accounting system.
(b) It is evolved to ascertain the cost of products, services or activities.
(c) It distinguishes clearly between fixed costs and variable costs.
ADVERTISEMENTS:
(d) Under this system only variable costs are charged to cost units.
(e) Fixed costs, which are treated as period costs, are written off in full against the aggregate contribution.
(f) Work-in-progress and finished goods inventories are valued at variable cost.
(g) Sales minus variable cost is the contribution which is the index of profitability of each product line.
ADVERTISEMENTS:
(h) Contribution minus fixed cost gives us net profit.
(i) Besides being a technique of product costing, it is also a tool of decision-making.
Marginal Cost – Basic Characteristics
Basic Characteristics of Marginal Costing:
1. It is a technique of analysis and presentation of cost rather than an independent method of costing. It can be applied with any method of costing.
2. Basically it involves differentiation of variable costs from fixed costs. It considers only variable costs in its analysis.
3. It guides pricing and other managerial decisions on the basis of ‘contribution’ which is the difference between sales value and variable costs of sales.
ADVERTISEMENTS:
4. The stock of finished goods and work-in-progress are valued at marginal cost.
5. Fixed costs are charged against the ‘contribution’ earned during a period. No portion of fixed cost is carried forward to the next period.
6. The difference between the ‘contribution’ and fixed cost represents either profit or loss. Excess of contribution over fixed cost is the profit and the deficiency of contribution to fixed cost is the loss.
Marginal Cost – Key Factor or Limiting Factor (With Formula)
Limiting factor is that factor the extent of whose influence must first be ascertained for maximum utilization of factors of production using managerial decisions, or, it is that factor which limits the quantum of activity of a firm at a particular time.
For maximisation of profit a concern should use all its resources to produce and sell maximum quantities of those products which give maximum contribution under the particular situation. Various situations arise in practice which restrict the output.
In such a situation, a contribution analysis based on the limiting factor can help maximising profit, e.g., if availability of machines is the key factor, then machine hour utilization by each product shall be assessed first and contribution shall be expressed in rupees per machine hour used.
ADVERTISEMENTS:
The product which yields the maximum contribution per unit of the key factor is most profitable and should be selected. Key factors arise due to shortage of one or more factors of production and sales like skilled labour, capital, plant and machinery, raw materials, etc.
Profitability can be determined by using the formula:
![]()
When material is in short supply, profitability is expressed as contribution per kg of raw material and so on. If there are more than one limiting factor, the factor which keeps the activity level at a minimum is considered as the limiting factor. In such cases linear programming technique is used to find the optimum level of activity.
Marginal Cost – Profit-Volume Ratio (With Formulae, Calculation, P/V Ratio of Multi-Product Concerns, Computation and Improvement)
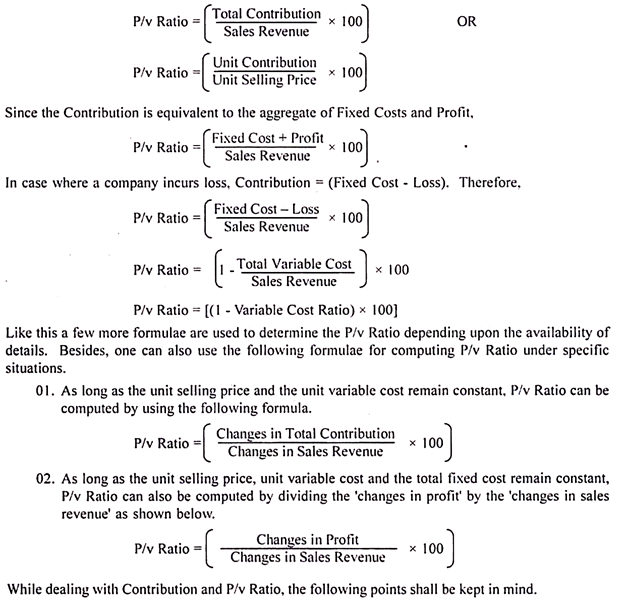
Profit-volume Ratio which is popularly known as P/v Ratio establishes the meaningful relationship between contribution and sales revenue. Therefore, this ratio is also called Marginal Income Ratio or Contribution to Sales Ratio.
For the purpose of computing P/v Ratio, the difference between the sales revenue and the total variable costs (or the difference between the unit selling price and the unit variable cost) is used to represent the contribution irrespective of the composition of fixed costs. Sales revenue includes both cash and credit sales revenue.
ADVERTISEMENTS:
The ratio is, therefore, calculated by using the following formulae:
3. As long as the unit selling price, unit variable cost and the total fixed cost remain constant, any change in the amount of contribution changes the amount of profit by an equivalent amount. That means, Change in Contribution = Change in Profit.
4. If a company is operating above the break-even level (i.e., earning some profit), an increase in the contribution increases the profit by an equivalent amount provided the fixed cost remains constant. That means, there may be some change in either the unit selling price or unit variable cost or both.
5. When a company is operating below the break-even level (i.e., incurring loss), any increase in the contribution either-
ADVERTISEMENTS:
i. Reduces the amount of loss or
ii. Converts the loss situation into ‘no-loss, no-profit’ situation or
iii. Changes the loss into profit situation depending upon the changes in the amount of contribution provided the fixed cost remains constant.
A Note on P/V Ratio of Multi-Product Concerns:
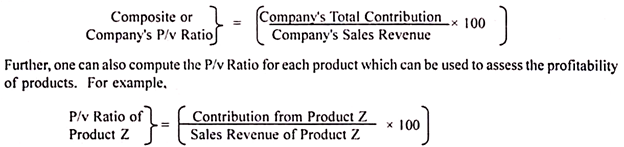
In the case of multi-product companies (i.e., the companies manufacturing two or more products each), the P/v Ratio is computed in the same manner as for mono-product companies.
The only difference is the consideration of contribution of the company (i.e., the aggregate of contributions from all the products) in the numerator of the formula. In the denominator also, total sales revenue earned by the company from the sale of all its products is considered.
ADVERTISEMENTS:
Therefore, P/v Ratio (also called, Composite P/v Ratio) is computed by using the following formula:
Improvement of P/v Ratio:
Since the companies aim at improving their profitability, they usually aim at improving their P/v Ratio. It may be remembered here that the determinants of P/v Ratio are two in number. They are variable costs and selling prices. It is, therefore, necessary to widen the gap between the selling price and the variable costs.
The important ways of improving P/V ratio are as identified below:
1. Increasing the selling price without allowing the unit variable cost to increase,
2. Reducing the unit variable cost without downward revision of selling price,
3. Increasing the selling price at a higher rate than the rate of increase in the unit variable cost,
4. Reducing the unit variable cost at higher rate than the rate of reduction in the selling price so that the reduction in the amount of unit variable cost exceeds the reduction in the selling price,
5. Increasing the selling price and reducing the unit variable cost, and
6. Selecting the most profitable sales mix by increasing the sale of more profitable products even by reducing the sale of less profitable products.
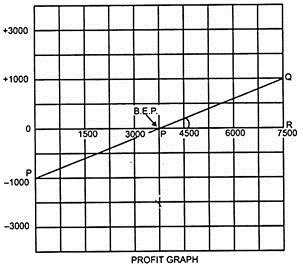
Marginal Cost – Profit/Volume Graph (With Uses and Limitations)
The profit/volume graph shows the relationship between profit and volume of sales. It is also called a profit graph.
Uses of Profit/Volume Graph:
(a) To determine BEP.
(b) To show impact on profits on selling at different prices for a product.
(c) To forecast costs and profits resulting from changes in sales volume.
(d) To show relative profitability under conditions of low demand and high demand.
(e) To show deviations of actual profit from anticipated profit.
(f) To indicate the product-wise profitability.
The limitations of a profit volume graph are similar to those of break-even graph and are as follows:
(a) Fixed costs cannot be a constant amount over the full range of activity.
(b) Similarly, marginal costs and Sales revenue cannot be linear over the full range of activity.
(c) Opening stock and closing stock do not appear in the graph. Hence, it would not be proper to take decisions by seeing the graph which does not depict the changes in the stock.
(d) Capital employed is not shown in the graph. Only cost and revenue are shown.
(e) A constant sales mix is assumed where more than one product are sold.
Marginal Cost – Margin of Safety (With Formula and Example)
Total sales minus the sales at break-even point is known as the ‘margin of safety’. Margin of safety can be expressed as a percentage to total sales also.
Thus the formula is:
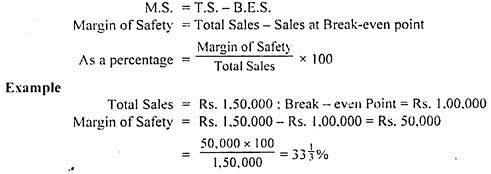
If the margin of safety is large, it is a sign of soundness of the business since even with a substantial reduction in sales, profit shall be earned by the business.
If the margin is small, reduction in sales even to a small tune may affect the profit position very adversely and larger reduction of sales value may even result in losses. Thus, margin of safety serves as a guide to the strength of the business.
For rectifying the unsatisfactory margin of safety, the management can take any of the following steps:
(i) Selling prices may be increased but it should not affect the demand adversely otherwise the revenue in sales net shall not be able to cope up with the requirements.
(ii) Fixed or the variable cost may be reduced.
(iii) Production may be enhanced, but it should be at a lower cost.
(iv) Unprofitable products may be substituted by profitable ones.
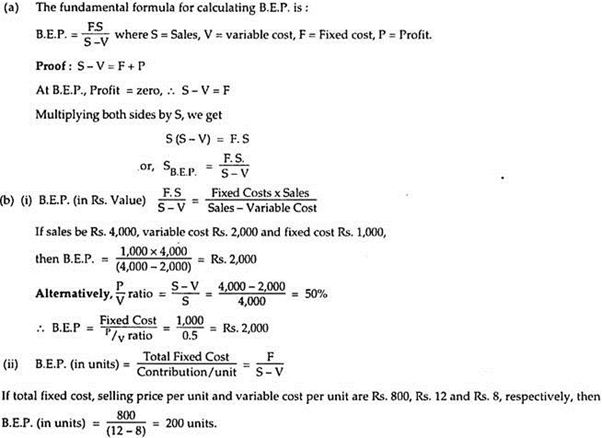
Marginal Cost – Break Even Point (With Formulas)
A break-even point is that volume of sales or production where there is neither profit nor loss. At this point the contribution equals to fixed cost, i.e.,-
Contribution = Fixed Cost
In marginal costing, variable costs are identified with the production and products and fixed costs are not allocated or apportioned to the products. The contribution from the sale of the products should absorb the fixed cost. When contribution equals fixed cost there is neither profit nor loss. At B.E.P. total cost is exactly equal to revenue and after this point profit begins.
Marginal Cost – Break-Even Chart: Construction, Advantages, Limitations, Forms and Model
Construction of Break-Even Chart:
1. On the graph the ‘X’ axis (horizontal axis) shows the volume of production and the ‘Y’ axis (Vertical axis) shows the cost and sales. A graph has two sides which are known as “axes”. The horizontal side at the bottom of the graph is the X-axis.
The left hand vertical side is the Y-axis. On the Y-axis, costs and revenues are exhibited. On the X-axis one or more of production quantity, capacity in percentage form, sales volumes etc. are shown.
2. Draw both axes on the suitable graph paper on the basis of appropriate scale.
3. Insert production quantity on X-axis and costs and sales revenues on Y-axis.
4. Draw the fixed cost line on the graph. Even at zero production, the fixed costs remain the same. At zero production, the fixed costs will be the loss.
5. The total cost line is drawn above the fixed cost line. For this purpose, the variable cost is added to the fixed cost to arrive at the total cost and drawn at each and every scale of production.
6. Sales revenue line is drawn commencing at zero and finishing at the last point.
7. Then the sales line cuts the total cost line i.e. sales equals the total cost. This is known as Break-Even Point. If a dotted line is drawn from B.E.P. to X-axis, it indicates B.E.P. (Units) and if it is drawn towards the Y-axis, it indicates B.E.P. (value).
8. The difference between the sales line and total cost line is marked as profit and it is to the right of B.E.P. The angle at which the sales line cuts the total cost line is the angle of incidence.
9. The position to the left of the B.E.P. on the graph indicates the loss which goes up to the total amount of fixed costs which is the maximum loss at the zero production.
10. Then the graph will indicate the B.E.P., profit or loss at different levels of output, margin of safety, contribution and the relationship between the marginal cost, fixed cost and total cost.
Advantages of Break-Even Analysis and Chart:
1. Total cost, variable cost and fixed cost can be determined.
2. B.E. output or sales value can be determined.
3. Cost, volume and profit relationships can be studied, and they are very useful for managerial decision-making.
4. Inter-firm comparison is possible.
5. It is useful for forecasting plans and profits.
6. The best products mix can be selected.
7. Total profits can be calculated.
8. Profitability of different levels of activity, various products or profit, i.e., plans can be known.
9. It is helpful for cost control.
Limitations of Break-Even Chart:
Break-Even Chart is constructed under some unrealistic assumptions:
1. Exact and accurate classification of cost into fixed and variable is not possible. Fixed costs vary beyond a certain level of output. Variable cost per unit is constant and it varies in proportion to the volume.
2. Constant selling price is not true.
3. Detailed information cannot be known from the chart. To know all the information about fixed cost, Variable cost and Selling price, a number of charts must be drawn.
4. No importance is given to opening and closing stocks.
5. Various product mixes on profits cannot be studied as the study is concerned with only one sales mix or product mix.
6. Cost, volume and profit relation can be known; capital amount, market aspects, effect of government policy etc., which are important for decision-making cannot be considered from B.E.C.
7. If the business conditions change during a period, the B.E.C. becomes out of date as it assumes no change in business condition.
Forms of Break-Even Chart:
There are different ways of constructing a break-even chart. Charts which depict cost- volume-profit data are visual aids which serve to dramatise the effect of changes in cost, volume and profit. Like other charts, they impress effectively and tell their stories at a glance.
There are numerous ways in which break-even charts are prepared depending upon the purpose which they are meant to serve and the details which they are required to exhibit.
The forms of break-even charts, which are of importance, have been explained next:
(a) Simple Break-Even Chart:
This is a traditional break-even chart. This chart is used to predict profit or loss to be obtained from a certain level of sales or production. It is a combination of fixed cost line, variable cost line and the sales line.
(b) Contribution Break Even Chart:
In the case of a simple break even chart, the variable cost line is shown above the fixed cost line. Sometimes fixed costs can be shown above the variable costs. In such a case the chart is known as contribution break even chart. The speciality of this chart is that contribution is indicated clearly in the chart by way of difference between variable cost line and sales line.
(c) Analysis (or Detailed) Break-Even Chart:
The analysis break-even chart analyses the variable costs under different elements such as direct material, direct labour, factory overhead, selling and distribution overhead etc.
In addition, the profit is also sub-divided into various appropriations such as debenture interest, income tax, preference dividends, equity dividends and reserves. All these are plotted on the conventional B.E.P. graph by way of analysis.
(d) Control Break-Even Chart:
Break-even charts may be prepared in conjunction with standard costing and budgetary control system. Budgeted fixed costs, budgeted variable cost and budgeted sales are also plotted, in addition to the actual fixed costs, actual variable costs and actual sales.
This graph is useful for comparing budgeted and actual profits, B.E.P. and sales. It facilitates to study the significant deviations, more particularly, the profit variance.
(e) Profit Volume Chart:
It is a simplified and improved form of break-even graph. It is a pictorial representation of cost-volume-profit relationship. All basic data, required for the BE chart, are required for the construction of the profit volume graph. In this chart, the horizontal axis represents the sales volume and the vertical axis shows profit or loss.
The vertical slope line above the horizontal line represents the profit and below the horizontal line shows loss. The diagonal line presents the total marginal contribution of the business.
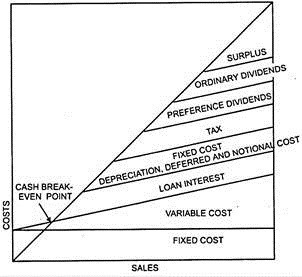
(f) Cash Break-Even Chart:
It also follows the conventional form of graph. The expenses are divided into two viz. cash expenses and non-cash expenses such as depreciation. The cash fixed cost and the total cash cost lines i.e. excluding depreciation etc. are drawn along with the sales line. The meeting point of the sales line and the total cash cost line is the cash break-even point.
A model of Cash flow break-even chart is given below:
Angle of Incidence:
The angle, to the right of B.E.P., is formed, by intersecting the sales line and the total cost line. It indicates the profit-earning capacity. The angle may be large or small. A greater angle of incidence means that the profits are made at high rate and vice versa. Generally, a large or wider angle of incidence together with a high margin of safety indicates the most favourable situations.
Contribution in Marginal Costing (With Formula and Example)
The difference between selling price and variable cost (i.e., the marginal cost) is known as ‘Contribution’ or ‘Gross Margin’ or ‘Contribution Margin’. In other words, fixed costs plus the amount of profit is equivalent to contribution.
It can be expressed by the following formula:
Contribution = Selling Price – Variable Cost
or
= Fixed Cost + Profit
We can derive from it that profit cannot result unless contribution exceeds fixed costs. In other words, the point of ‘no profit no loss’ shall be arrived at where contribution is equal to fixed costs.
Example:
Variable Cost = Rs. 50,000
Fixed Cost = Rs. 20,000
Selling Price = Rs. 80,000
Contribution = Selling Price – Variable Cost
= Rs. 80,000 – Rs. 50,000 = Rs. 30,000
Profit = Contribution — Fixed Cost
= Rs. 30,000 – Rs. 20,000 = Rs. 10,000
Since, contribution exceeds fixed cost, the profit is of the magnitude of Rs. 10,000. Suppose the fixed cost is Rs. 40,000 then the position shall be –
Contribution – Fixed Cost = Profit
= Rs. 30,000 – Rs. 40,000 = – Rs. 10,000
The amount of Rs. 10,000 represents the extent of loss since the fixed costs are more than the contribution. At the level of fixed cost of Rs. 30,000, there shall be no profit and no loss. The concept of break-even analysis emerges out of this theory.
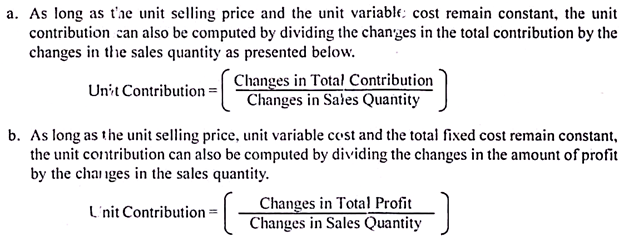
Contribution per unit can also be calculated thus:
Contribution per unit = Selling Price per unit — Variable Cost per unit
It is also known as ‘unit contribution margin’ or ‘marginal contribution per unit’.
Marginal Cost – Decision Making
Decision making means selecting a course of action from among a set of alternatives. There are mainly two types of decisions, i.e., long term and short term decisions. Time value of money and return on investment are the prime considerations in long-term decisions. Short term decisions mean selection of alternatives which can be implemented within one year.
Marginal costing technique helps management to take short-term decisions in many areas some of which are discussed below:
(1) Fixation of Selling Price:
Although prices are regulated mostly by market conditions and other economic factors, marginal costing technique is extremely useful for fixation of selling price in a multi-product company where fixed overheads are not too high.
Again, in the Petro-chemical industry, where variable cost is low and fixed cost is very high, the gap between selling price and contribution margin is so wide that price fixation based on contribution becomes risky. In the long run, the selling price must cover the total cost to earn profit and run the business.
In times of competition, trade depression, exploring foreign markets, accepting additional orders for using spare plant capacity, etc., products may have to be priced below total cost. The price should be equal to marginal cost plus adequate margin for contributing to fixed cost and profit.
This margin depends on acuteness of competition, demand and supply, nature of product, degree of depression, marketing strategy, management policy, etc. Even for a short period, the selling price should not be below marginal cost. If selling price is equal to marginal cost, then loss is equal to the fixed cost.
If selling prices are more than marginal cost under special circumstances, the production should be continued to minimise the loss.
(2) Make or Buy Decisions:
Whether a component is to be manufactured or purchased from an outside supplier is decided by comparing the marginal cost of manufacturing the component with the market price of the component.
If the market price exceeds the marginal cost, then it is profitable to manufacture the component. Specific and additional fixed costs may be treated as relevant costs. The comparison between marginal cost and market price will be helpful if unused capacity is available.
If the factory is operating at full capacity, then this decision is to be taken after adding the opportunity cost of the product which is replaced by the manufacture of the component.
Some other factors which influence ‘make or buy’ decisions are:
i. Plant capacity
In case of an expanding business, subcontracting may be the only way of keeping up the required sales volume. This may also be the case when sales are of a seasonal nature.
ii. Profit maximisation
To get long runs of the most profitable products it may be required to subcontract the less profitable products.
iii. Specialisation
Certain types of work may best be undertaken by outside specialist organisations. Components involving specialisation work may be bought from outside market.
iv. Nature of product
If other departments are dependent upon receiving regular supplies then it is better to manufacture the product.
v. Secrecy
If a company wants to maintain the trade secret of a component, then it is better to manufacture it.
(3) Profit Planning:
It is a function of management which requires adequate knowledge of the inter-relationship of selling prices, sales volumes, variable costs and fixed costs.
Marginal costing together with cost-volume-profit analysis guides management regarding profit position at different levels of output and product-mix so that management can operate the business at optimum level, where profit is maximum.
Hence marginal costing is a useful tool in planning profits as it ensures sufficient return on capital employed.
(4) Selection of Profitable Sales Mix:
Sales mix indicates the proportion in which different products are produced and sold. Selection of a profitable sales mix becomes a problem when a company produces a variety of products each having its own contribution.
Any variation in sales mix changes the profit position. The marginal costing technique highlights the most profitable sales mix which yields the maximum overall contribution.
(5) Shut Down Decision:
A factory may stop production for a certain period due to many reasons, e.g., material shortage, labour troubles, shortage of finance, insufficient order, market depression, major break-down, etc. This shut down may be of temporary nature and operations resume as soon as the situation improves.
Shut down costs may be classified as follows:
i. Costs incurred due to stoppage of operations, e.g., retrenchment and lay-off costs, costs of notifying customers regarding shut down, etc.
ii. Costs incurred due to continued shut down; e.g.; cost of maintenance and protection of plant and machinery, etc.
iii. Costs incurred after shut down, e.g., cost of recruiting and training new employees, time lag in picking up production and sales, additional sales promotional costs, etc.
So long products are making a contribution towards fixed cost, production should not be stopped to minimise loss.
(6) Selection of a Suitable Method of Production:
Sometimes the management faces difficulty in selecting the best method of production amongst alternatives.
For example, a new product may have been developed and the management has to decide whether to use an ordinary machine or an automatic machine or hand labour entirely for its production. The management should select that method which yields maximum contribution (i.e., the lowest marginal cost), keeping in view the key factor.
(7) Accepting Additional Orders and Exploring Foreign Market:
Sometimes goods are sold at a profit, i.e., at a price above the total cost and still there remains some spare capacity. In such circumstances, extra orders may be accepted or goods may be sold in a foreign market at a price above marginal cost but below total cost.
This will add to the profits as after full recovery of the fixed cost, any price exceeding the marginal cost either from additional orders or from selling in the foreign market, will make extra contribution which will increase the profit. In this way the spare plant capacity can be used to earn additional profit.
(8) Increasing or Decreasing Departments (or Products):
Sometimes general fixed costs are apportioned to departments (or products) for ascertaining total cost but it may give misleading results. However, when fixed costs are specific, it may be considered as relevant cost.
Difference between Marginal Costing and Absorption Costing
Difference between marginal costing and absorption costing are as follows:
Difference # Marginal Costing:
1. Decisions
Managerial decisions are based on contribution i.e. excess of sales revenue over variable costs.
2. Under/over Recovery
The question of under/over recovery of fixed overheads does not arise.
3. Period Costs
All fixed costs are treated as period costs and hence are written off against profits in the period in which they arise.
4. Product Costs
Only variable costs are treated as product costs therefore they are charged to products, processes or operations.
5. Value of Stock
Value of closing stock comprises only variable costs.
Difference # Absorption Costing:
1. Decisions
Managerial decisions are based on total profit i.e. excess of total sales revenue over total costs.
2. Under/over Recovery
Under/over recovery of fixed overheads generally arises.
3. Period Costs
All administration, selling and distribution overheads are treated as period costs. Therefore, they are written off against the profits in the period in which they arise.
4. Product Costs
All variable manufacturing costs and fixed production overheads are treated as product costs. Therefore, they are charged to product, processes or operation.
5. Value of Stock
Value of closing stock includes fixed production overheads.
Advantages of Marginal Cost
The advantages of marginal cost are as under:
Advantage # 1. Aid to Management
Marginal costing is a valuable aid to management in the following decision-making and fixation of selling prices, selection of a profitable product/sales mix, make or buy decision, problem of key or limiting factor, determination of the optimum level of activity, close or shut down decisions, evaluation of performance and capital investment decisions etc.
Advantage # 2. Complimentary to Standard Costing and Budgetary Control
Marginal costing is complementary to standard costing and budgetary control. It can be used along with them to yield better results.
Advantage # 3. Facilitates Calculation of Important Factors
It facilitates the calculation of various important factors, some of these factors are viz., break-even point, expectations of profits at different levels of production, sales necessary to earn a predetermined target of profit, effect on profit due to changes of raw materials prices, increased wages, change in sales mixture etc.
Advantage # 4. Facilitates the Study of Relative Profitability
Marginal Costing facilitates the study of relative profitability of different product lines, departments, production facilities, sales divisions etc.
Advantage # 5. Helps in Cost Control
Since fixed costs are not controllable but only variable or marginal cost is controllable, variable costing, by dividing costs into controllable and non-controllable, helps in cost control.
Advantage # 6. Simple to Operate and Easy to Understand
The technique of variable costing is quite simple to operate and easy to understand. Since, fixed costs are kept outside the unit cost; the cost statements prepared on the basis of variable cost are far less complicated.
Advantage # 7. Removes Complexities of Under-absorption of Overheads
Marginal Costing does away with the need for allocation, apportionment and absorption of fixed overheads and hence removes the complexities of under-absorption of overheads.
Advantage # 8. Profit Planning
Marginal costing helps the management in profit planning by making a study of relationship between cost, volume and profits. Further, break-even charts and profit graphs make the whole problem easily understandable even to a layman.
Advantage # 9. Helps Management in Production Planning
Variable cost remains the same per unit of output irrespective of the level of activity. It is constant in nature and helps the management in production planning.
Advantage # 10. No Possibility of Fictitious Profits by Over-valuing Stocks
It prevents the carry forward of current year’s fixed overheads through stocks, there is no possibility of fictitious profits by over-valuing stocks.
Disadvantages of Marginal Cost
The main disadvantages of marginal cost are as under:
1. Useful Only in Short Profit Planning and Decision-making
Variable costing is useful especially in short profit planning and decision-making. For taking decisions of far reaching importance, one is interested in special purpose cost rather than variability of costs.
2. Problems in Regard to Under or Over-absorption
Although the technique of variable costing overcomes the problem of under or over-absorption of fixed overheads, the problems still exist in regard to under or over-absorption of variable overheads.
3. Apportionment of Fixed Costs
In case of multiple products, separate break-even points are to be calculated. The apportionment of fixed costs to each product possess a problem.
4. Disregards the Use of Recovering Fixed Cost
Variable costing technique pays no regard to the use of recovering fixed cost through product pricing. For the long-run continuity of business this practice is not good. Assets have to be recovered of costs.
5. Based upon a Number of Assumptions
The technique of variable costing is based upon a number of assumptions which may not hold well under all circumstances.
6. Unable to Fix Selling Prices
Fixation of selling prices in the long run cannot be done without considering the fixed costs. As such, pricing decisions cannot be based on marginal cost alone.
7. Non-recognition from Government Authorities
The income tax authorities give no recognition to the marginal cost for inventory valuation. This necessitates keeping of separate books for separate purposes.
8. Segregation into Fixed and Variable – A Difficult Task
It is difficult to classify all the costs into fixed and variable accurately because some cost have no relation to volume of output or even with the time. To illustrate, management’s decision regarding bonus to workers may not be directly related to time or output.
9. Ignores Fixed Overheads
Always to price the products and ignore fixed overheads may not be appropriate.
10. Assumption Regarding Behaviour of Costs
Some of the assumptions regarding the behaviour of costs are not necessarily true in real life.
11. Not Appropriate for Job/Contract Costing
It cannot be appropriately applied in job/contract costing.