
After reading this article you will learn about frequency distribution and its use in controlling product quality.
It is found that if production is carried on with proper care and accuracy then generally the resultant lot will be distributed in a so called normal pattern such as shown in plot 61.3.
In this each product is arranged according to its measured dimension and the number of times or frequency with which each dimension repeats is plotted. (Frequency means during data collection how many times a particular dimension repeats). The graph is, therefore, called a frequency pattern.
To illustrate, an example of frequency distribution is dealt here under:
ADVERTISEMENTS:
Example 2:
A machine produces the following component:
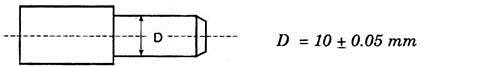
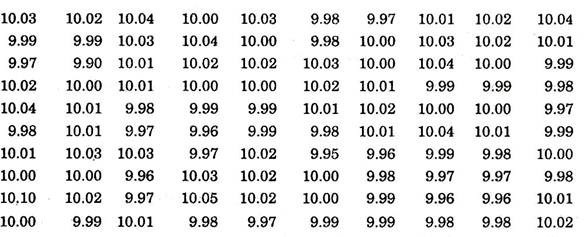
Out of 1000 parts manufactured, 100 are measured to the nearest of hundredth a mm. The measurements recorded are shown in the table. Explain what do these measurements tell about the machine or process.
Solution:
For the above data, frequency tally sheet is plotted.

From this tally sheet, it is observed that dimension 9.95 repeat ones, dimensions 9.96 six times, dimension 9.97 nine times and so on. By this record of tally sheet, histogram and frequency distribution diagram shown in Figs. 61.2 and 61.3 are plotted.
ADVERTISEMENTS:
Frequency distribution diagram shows that bulk of production in this case is within the specified minimum and maximum limits. Only a small and insignificant percentage falls outside.
Function of Frequency Distribution:
This chart gives what and where are the variations rather than including the good or bad. From the frequency distribution some features about the quality can be seen. This gives complete data of variation in a set of measurements or observations. It also gives an idea regarding process and the spread of variation.
Some important features of group quality can be:
(i) The Approximate Central Value:
ADVERTISEMENTS:
This is usually the dimension at which the process or machine is set.
(ii) The Spread of Values:
This shows that the variability is inevitable and occurs due to process itself, raw materials used and operators employed.
(iii) Drawing Tolerances and Process Tolerances:
ADVERTISEMENTS:
A relation between the drawing tolerances and process tolerances can be established under varying conditions.
Limitations:
The frequency distribution can definitely provide the information regarding lack of control but proper inferences cannot be drawn, hence difficult to take decision for future control.