After reading this article you will learn about the following things:- 1. Meaning of Motion Study 2. Aims (Objectives) of Motion Study 3. Procedure 4. Micromotion Method 5. Elements of Therbligs Process 6. Present Symbols 7. Cyclegraph and Chronocycle Graph 8. Principles 9. Tools and Techniques.
Meaning of Motion Study:
In this field, pioneering work was done by Frank B. Gilbreth and his wife Lillian M. Gilbreth, around 1910, with the name of Motion Study. Frank Gilbreth. The real founder of motion study as science, defined motion study as the “science of eliminating wastefulness resulting from ill- directed and in-efficient motions”. The aim of motion study is to find the scheme of least wastage of labour.
Later on the scope of Motion Study was enlarged and it was named as Method Study. Method Study is a technique which analyses each operation of a given piece of work very closely in order to eliminate unnecessary operations and to approach the quickest and easiest method of performing each necessary operation. It includes the standardization of equipment, methods and working conditions, and training of the operator to follow the standard method.
Sometimes method study can also be defined as “systematic recording and critical examination of existing and proposed ways of doing work as a means of developing and applying easier and more effective method and thereby reducing cost.”
ADVERTISEMENTS:
From the above definition, it is clear that the method study is concerned with the development of efficient and economical work methods. Proper development of these methods calls for the cooperative efforts of design engineer, process engineer and method analyst.
There is a continuing need for analyzing existing methods as the best methods today may not necessarily remain the best method after some period. Subsequent investigations may reveal that more economical materials are available, most efficient machines, tool, jigs and fixtures have been designed, better inspection methods have been evolved, more efficient material handling equipment is now available and so on. Therefore, there is always scope for improvement of existing methods.
Aims (Objectives) of Motion Study:
Some important aims of the motion study are:
1. To eliminate wastage of time and labour.
ADVERTISEMENTS:
2. To reduce fatigue and boredom of work by avoiding unnecessary movements.
3. To find the best way of doing & job,
4. To have more effective utilisation of materials, machines and workers.
5. To improve the design of work place layout.
ADVERTISEMENTS:
6. To standardise the method, obtained after conducting the motion study.
7. To train the individual worker for its practice as per standardised method.
Procedure for Motion Study:
Motion study can be performed in the following steps:
Step I: Break Up the Operation of the Job:
ADVERTISEMENTS:
Make a detailed list of all operations in the present method of manufacturing a job. All the material handling, machine work, and hand work are also included in this detail.
Step II: Question Each Detail of the Job:
Following questions should be asked on himself by the motion study engineer about the way in which these operations are to be performed, and about the tools and equipment’s needed. The procedure of this questioning is known as ‘Critical Examination’.
Questions are asked on the following five points:
ADVERTISEMENTS:
(i) Purpose:
What is the purpose of this operation? Does this fulfill the requirements? and whether this can be eliminated?
(ii) Place:
Where is the best place to do this operation?
ADVERTISEMENTS:
(iii) Sequence:
What is the best time to do this operation and whether it can be done at the same time as before or at any other better time? When will it be more suitable and economical?
(iv) Person:
Who will do this operation? Who can do it in a better way?
ADVERTISEMENTS:
(v) Means:
Flow this operation can be performed, i.e. which machines and tools are to be used? Can we make the work more easier and safer for both worker and equipment?
Step III: Develop a New Method:
After considering the above questions, a new better method is developed.
Apart from the above considerations, before finalising the new method, the following facts should also be thought over during the motion study:
Elimination:
ADVERTISEMENTS:
Every operation or detail of the job should be thought that whether it can be eliminated without any harm.
Combining:
In this aspect, it is to be observed that whether two or more operations can be combined without any adverse effect to save operation time.
Rearrangement:
If rearrangement in the sequence of operations help in simplification or in any other aspect then it should be done.
ADVERTISEMENTS:
For example, in a factory main sequence of operations was:
(a) Assembling
(b) Storage
(c) Inspection
(d) Dispatching.
In this sequence, inspection was carried before dispatching and defective components were being sent back to department for correction.
ADVERTISEMENTS:
After sometime, it felt that storage before inspection yields unnecessary more material handling and internal transportation of defective components. It can be avoided, if inspection is carried out before sending the products for storage.
Then this sequence of operations is rearranged as follows:
(a) Assembling
(b) Inspection
(c) Storage
(d) Dispatching.
ADVERTISEMENTS:
Simplify. In simplification, it is found that if the operation is possible with any other easy, safe and economical method that should be adopted.
The work can also be simplified by:
(a) Placing the materials, tools and equipment’s at proper working area.
(b) Using gravity feed hoppers and other material handling equipment.
(c) Taking useful work by both hands.
(d) Using special jigs and fixtures.
ADVERTISEMENTS:
Step IV: Installing the New Method:
After having developed the method, this is required to install. The new method must first be got approved from the supervisors, workers and management. Then the workers must be trained to work according to this new method and their habits must be developed to follow the correct way. For some-time, close contacts must be maintained with the progress of the job until it runs satisfactorily.
Step V: Maintaining new Method:
Once a method is installed, it should be maintained in its specified form, and not allowed to slip back to old form or introduction of any other unauthorised changes.
For proper maintenance, following steps are advised:
(i) Copies of the job instruction sheets should be distributed to all concern. These sheets must supply the detail for setting up the job and proper operation.
(ii) Routine checks are necessary to compare what is actually being done against the job instruction sheets.
(iii) Selection and training of persons must be done according to the job specifications for this new method.
Micromotion Method of Motion Study:
Some motions require very small time and it is difficult to measure time for these motions accurately but the time required by these motions cannot be neglected because they are repeated hundreds of time.
Therefore, the motions are taken on picture films with the help of picture camera. Very small time upto 0.0005 minute can be measured by this system. When picture camera is used, the procedure is known as “Micromotion Study”.
This method gives very accurate analysis of the product but being a costly, it is used when products are likely to continue for a long time.
Micromotion study has the following important advantages:
(i) It provides permanent record of motion study with the help of films.
(ii) A large number of workers can see the procedure at any time even after the completion of motion study work.
(iii) Differences in the old and new methods can be demonstrated, if both are filmed.
(iv) Films can be demonstrated at any desired speed.
(v) It gives very accurate time for each motion or operation than that noted by the stopwatch.
Elements of Therbligs Process of Motion Study:
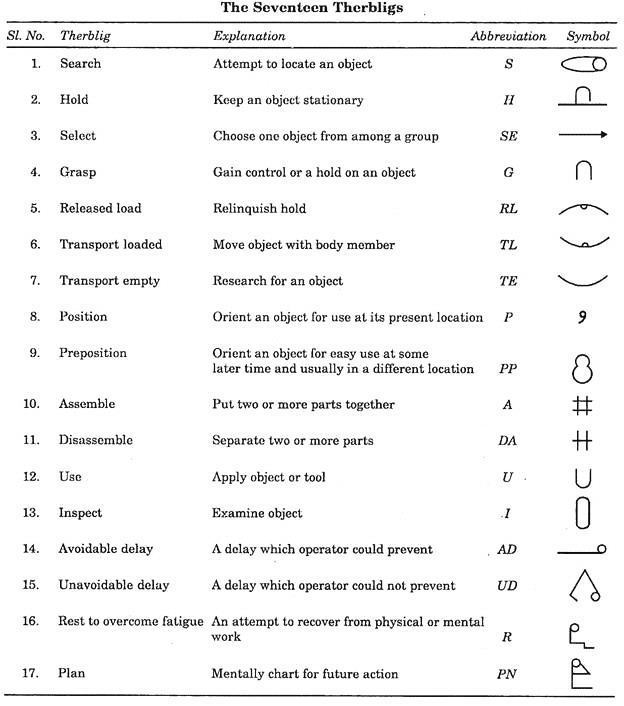
Frank Gilberth developed a set of 17 elementary motions commonly found in manual operations and called them “Therbligs”, reverse spelling of his name. We know that motion study is used for deciding the best way of doing work for which present and proposed methods are observed by experts by recording on charts.
For the purpose of recording the motions, he splitted up different motions of process into 17 fundamental elements made by various members of human body and each event was allotted a symbol and letter abbreviation. These symbols and abbreviations are used for preparing motion study charts. To maximise the utility of Charts sometimes colour codes are also used.
Table showing 17 therbligs with their explanation is given below:
Present Symbols of Motion Study:
The symbols developed by Gilbreth are much in number and mostly all are not used in motion study.
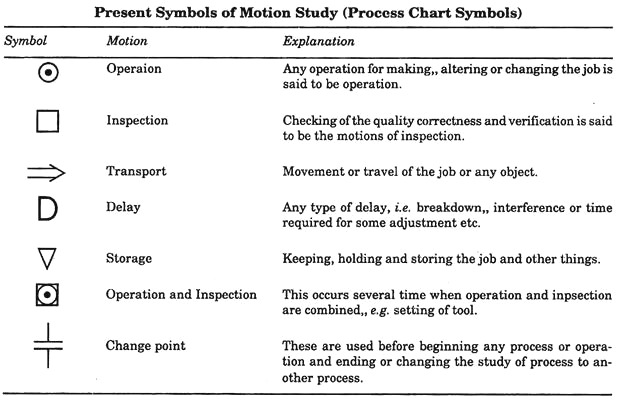
Therefore, motions were further reduced and now-a-days motions and symbols, which are used commonly shown in the Table given below:
In conclusion, some of the important tools and techniques of method study have been explained and these are found to be very much useful for the quick production and to reduce overhead expenses.
Cyclegraph and Chronocycle Graph used in Motion Study:
As an aid for micromotion study, Gilbreth also developed (i) cyclegraph and (ii) chronocycle graphic techniques for the study of the motion path of an operator’s hand or finger.
Cyclegraph:
A small electric bulb is attached to the finger, hand or other part of the body of the operator and it is photographed to record the path of the motion. With a still camera, the path of light so photographed, is called a cyclegraph.
Chronocyclegraph:
If an interrupter is placed in the electric circuit with the bulb and the light is flashed quickly and off slowly, then the path of bulb in the photograph will appear as a dotted line with pear shaped dots indicating the direction of motion.
The space between the dots will be according to the speed of the hand or finger of the body. Size and shape of the pear shaped dot will show whether body part is in acceleration or in retardation. The number of dots will give the time taken by that motion and the technique is called a chronocyclegraph.
Principles of Motion Study:
Only a best method of performing a job is not only with minimum expenditure but certain other rules or principles should be observed for increasing the speed to achieve more economy in production. Basically, there are 26 principles of motion economy.
Although they all are not applied to every operation but form basis or a code for improving the efficiency and reducing fatigue in manual work.
(A) Principles related to the use of the “Human Body”.
(B) Principles related to “arrangement of the work place”.
(C) Principles related to the “Design of Tools and Equipment”.
(A) Principles Related to the Use of the “Human Body”:
1. Both hands should start as well as complete their motions at the same time.
2. Both hands should not be idle at the same time except during rest periods.
3. Use both hands simultaneously and use best motion sequence.
4. Hand motions should be confined to the lowest possible classifications in order to reduce fatigue.
These are listed in the order of giving least fatigue and maximum economy:
First—Finger motions.
Second—Finger and wrist motions.
Third—Finger, wrist and lower arm motions.
Fourth—Finger, wrist, lower arm and upper arm motions.
Fifth—Finger, wrist, lower arm, upper arm and body motions.
5. Utilise momentum to assist the worker, wherever possible.
6. Smooth continuous motions produce less fatigue in comparison to zig-zag or straight line motions involving sudden and sharp change in direction.
7. Ballistic movements are faster, easier and more accurate than controlled movements.
8. Sequence of motions should be arranged to build rhythm and automaticity into the operation. For example, practically everybody opens and closes his shirt buttons without thinking, using definite recurring movements. It is performed with positive rhythm and automaticity.
9. Hands should be relieved of all work that can be done by feet or other parts of the body.
(B) Principles Related to the Arrangement of the Work Place:
1. All tools and materials should be placed at a definite and fixed place with easy reach.
2. All tools, materials and actuating devices should be placed in front of the operator at a distance as near as possible.
3. Provide gravity feed bins and use power or gravity conveyors to transport materials.
4. Wherever possible use drop deliveries. Drop delivery means dropping the article into a chute or on a conveyer as near to the point of assembly as possible so that gravity assists rather than the hands to reach the part to its required place.
5. Tools and material should be located in such a way as to achieve the best sequence of motions.
6. Illuminate the work places properly for adequate seeing and visual perception.
7. Provide proper working tables, stools and chairs, etc., because to work in standing or sitting position on floor consumes more time and energy.
8. The height of the work place and chair etc., should be such that worker can either sit or stand comfortably.
9. Chairs provided should make good posture.
10. Keep the shops in good order, neat and clean.
(C) Principles Related to the Design of Tools and Equipment:
1. The hands should not be used for work that can be done more advantageously with the help of devices.
Therefore, following devices should be used to reduce manual work and to free both the hands as far as possible:
(a) Use power operated tools and equipment;
(b) Use vices, jigs and fixtures etc.;
(c) Use stops, guides etc.;
(d) Use foot pedals.
2. Reduced noise increases speed of work and requires less energy.
3. Wherever practicable, tools and materials should be prepositioned to reduce search, find and the select operations.
4. Wherever possible two or more tools should be combined.
5. Handles on tools and cranks should be designed to permit maximum contact with the hands, particularly where force is applied, such as in a screw driver, plier, scrapper etc.
6. When each finger performs some specific movement, such as in type writing, the load should be distributed in accordance with the inherent capacities of the fingers.
7. The location of levers, cross bars and hand wheels, etc. should be so decided that the operator can operate with the least change in body position and with greatest mechanical advantage.
Tools and Techniques of Method Study:
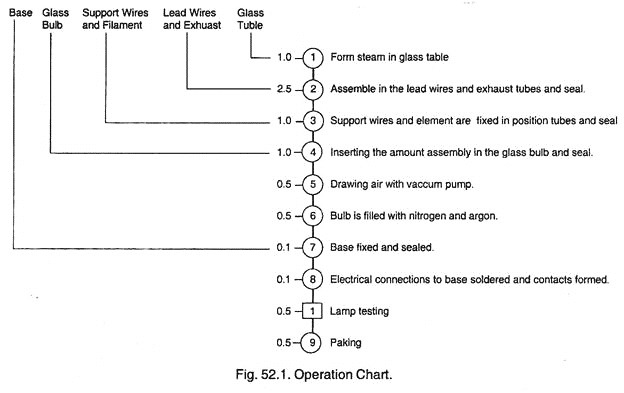
1. Operation Chart (Fig 52.1):
This is a graphic representation of the sequence of all operations and inspections involved in the process. In this chart, all components or materials entry points are indicated by the horizontal lines and the processing of these materials are shown vertically. Operation process charts provide a compact overall view of the whole system of operations involved in the manufacture of a product.
For drawing the operation charts, final assembly operations are generally written on the right hand side of the paper. A horizontal line is then drawn at the top of the vertical line denoting the sequence of operations and inspections to represent the starting material. Above this horizontal line, part number (if any) and the name of the item is given, and below the line material size is mentioned.
Standard time for each operation is mentioned on the left hand side of its symbol while a brief description of the operation is given on the right hand side. When another part is assembled, a horizontal line is drawn into the vertical line just above the operation symbol representing the assembly.
The operations and inspections required for the manufacture of the part are then put above this line in the form of column in sequence. Thus additional columns are introduced, for each part assembled, in the left with a horizontal line connecting the main assembly column.
When purchased parts are used in the assembly, a horizontal line is drawn at proper place in the assembly column and parts number and name is given above the line, while the name of the manufacturing company from whom it is procured is given below this line.
After all, the sequence of symbols for operation must be numbered. Each type of symbol has its own (separate) sequence of numbers. Numbering starts at the upper right hand corner of the chart, i.e. from top of the main assembly column and proceed downwards until a horizontal line comes into the column.
Then the symbols on this line from top to downwards are measured, this follows till this line joins the main assembly column and so on, and till all the symbols are numbered. Operation process chart for the manufacturing of an electric bulb is given in the Fig. 52.1.
2. Flow Process Chart:
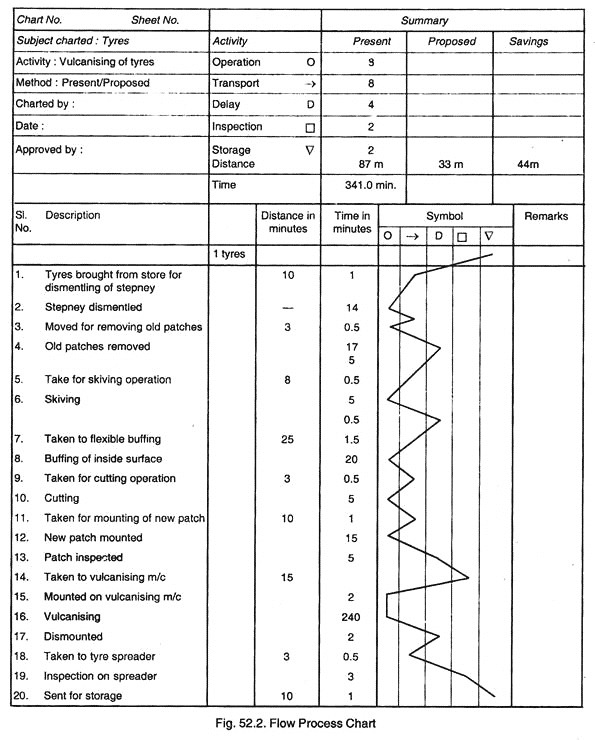
This is a graphic representation of operation, transportation, inspection, delays and storage occurring during production. This also gives the information regarding distances moved and time required for different items such as transportation, delays and inspection etc.
It is usually prepared for one component of an assembly at a time. After preparing this chart, an analyst applies motion study and proposes a new method for doing the same job.
The flow process charts are used for improvement in productivity and quality. Flow process charts provide an excellent form of documentation for a process is useful for examining as to how various steps in a process work together. These are operation (0); Inspection (□) Transport (=>); Delay (D); and storage (▽).
A good flowchart should show all process steps under analysis, critical process points for control, suggest areas for further improvement and help explain and solve a problem.
Flow process chart for vulcanising tyres is given here. The first step in preparing this chart is filling out of the headings. Each activity is listed in order as the job is following through the plant and notations are made as shown in examples.
The symbols in such charts are short hand tools and serve as sign posts to make critical areas for improvement. In this way, by preparing Flow Process Chart, a process or a job can be analysed step by step. Activities can be eliminated in some cases, combined in others, rearranged for more effective processing or simplified. The proposed new method is also drawn in the chart shown at Fig. 52.2.
Flow process charts are of following two types:
(i) Flow Process Chart—Product Analysis:
This chart is based on product analysis. This is a graphic representation of different steps involved in performing the work required to convert a product from one stage to another.
(ii) Flow Process Chart—Man Analysis:
This chart is based on man analysis. This is a graphic representation of different steps a person performs when doing a job and his movements from one place to another in performing that job. Until and unless clearly mentioned, flow process chart refers to that of flow process chart based on Product Analysis.
3. Flow Diagram:
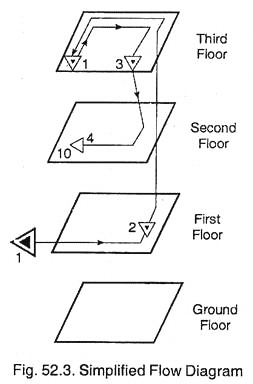
It is the plan view of a work to a certain scale and a line diagram indicating the path followed by the object under study. This gives an overall view of an existing or proposed process and is used for making improvement. It shows the path followed by the material, man or equipment. Where more than one floor is involved, an isometric drawing can be used (Fig. 52.3).
Normally the “Flow Diagram” should also accompany the Flow Process Chart.
Flow Process Charts and Flow diagrams are very simple and effective tools of method study. They are very useful in establishing the overall sequence of operations and in determining the best layout for an economical and effective flow of materials. They present a clear picture of a process and are very effective tools for studying and improving a complex job.
By systematically examining these charts, improvement can be made on the methods of production, sequence of operation and layout etc. Thus, work can be reduced, time can be saved and expenses can be cut.
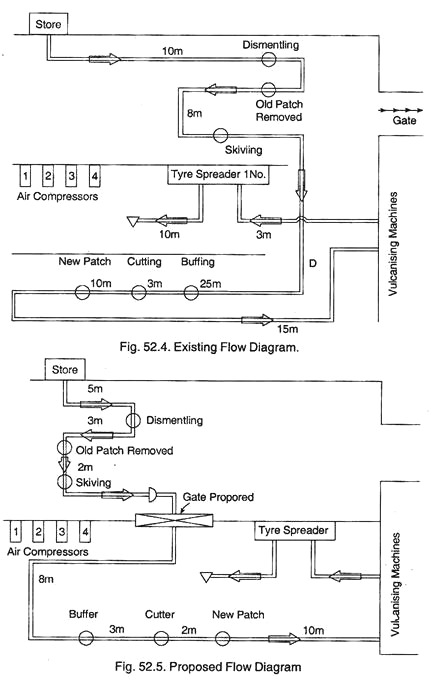
Fig. 52.2 is a Flow Process chart for vulcanising tyres and Fig. 52.4 is a Flow Diagram of the existing methods. From the study of these two, Fig. 52.5 shows a proposed Flow Diagram.
For charting these diagrams, keeping in mind the principles of Motion Economy, the first step is to record the existing methods being used for vulcanising of tyres. For this purpose, a Flow Process chart has been charted and flow diagrams have also been made. Now an ideal procedure or process will have maximum number of operations during course of action.
After going through the Flow Process chart, it becomes clear that there is much of transportation between different operations. So to make things more clear, a flow diagram is charted and it clearly shows the distance travelled by a tyre which is being repaired.
After critically examining the Flow Process chart and Flow Diagram, critically an alternative improved layout has been developed. It involves the movement of only two small machines which are flexible and mobile, therefore their movement will not be a problem at all. Further a gate is proposed with the central wall. This will not only reduce the distance travelled by a tyre but will also enable to simplify the things and reduce fatigue.
Now comparing the present and proposed Flow diagrams, we get the following results:
Repairing of tyres
Distance travelled by each tyre = 87 m (Existing)
= 43 m (Proposed)
Savings = 44 m
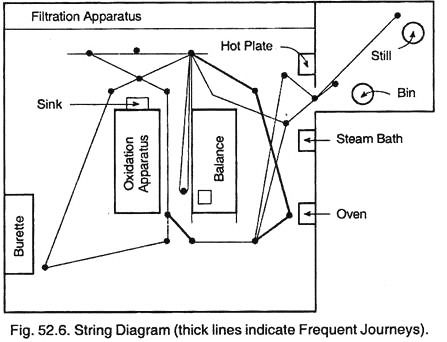
4. String Diagram:
This diagram is a layout drawing on which a length of string is used to record the extent as well as the pattern of movement of a worker or piece of equipment working within a limited area during a certain period of time. It is used to study where the journeys are irregular in distance and frequency, otherwise it will be difficult to assess exactly, what is happening.
It is used to investigate movement in the following situations:
1. When a group of operators is working.
2. When a single operator is attending several machines.
3. In processes, where several sub-assemblies has to be moved to other assembly.
4. Where processes require the operator to be moved from one work place to smother.
5. For checking the relative values of various layouts.
Construction:
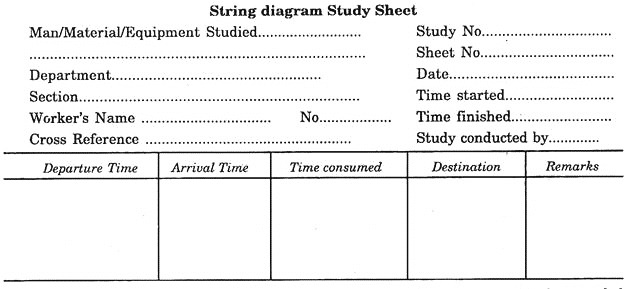
To construct a diagram, study is made for the movements in the task concerned and every journey involved in the performance of the work is recorded on the study sheet.
The proforma of which is given below:
From the study sheet, a scale layout drawing is prepared of the area to which the recorded moves have taken place. The drawing should include building features such as walls and doorways, block plans of machinery and other equipment’s installed nearby the route, whether or not it is actually concerned with the job or equipment being studied.
This complete drawing should then be attached to a sheet of plywood or composition board and panel pins shown in the String Diagram Fig. 52.6 driven into it at each of the terminal points observed during the study. It will also be necessary for additional pins to be driven in, where the direction of moves between these points changes.
Now a strong thread is tied to the starting point pin and by reference to the study, taken round each of the terminal points on the drawing in the sequence in which they were visited. The pins placed at corners along the route enable the thread to follow on the diagram, a path very similar to that actually taken while the study was made. In this way, it is possible to record on the diagram any number of journeys between any number of points.
Fig. 52.6 shows the string diagram recording the journey of a laboratory assistant in performing a day’s work.
5. Man-Machine Chart:
This chart describes graphically the activity of a man and machine he is attending against a time scale. When a shop has a number of operators and machines, studies can be made to find what number of machines each worker can operate or how many workers can work on each machine.
During the machining cycle of many semi-automatic machines, the operator has time in which he can run one or more other semi-automatic machines. In this way, such charts enable the management to minimise the idle time of the worker and to use the machines to their full capacity.
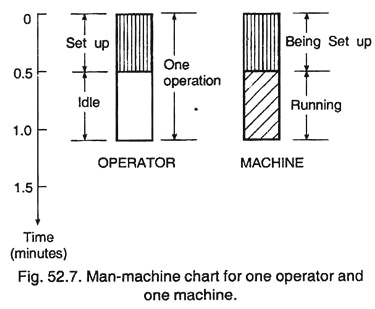
For example, suppose there are three workers and each worker is doing the same operations on his machine. Suppose that the time to set up a machine cycle is 0.50 minute and machining time taken is 0.75 minute.
Fig. 52.7 shows the ease ill which one worker operate one machine.
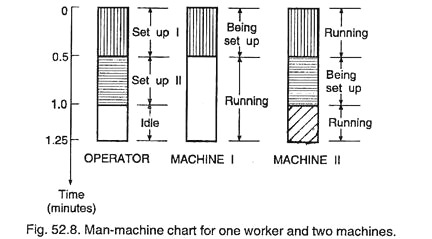
From Fig. 52.7, it is very clear for each operation that the worker is idle for 0.75 minute, when the machine is running. Its alternative can be to put two machines and let allow one worker to work on both of them.
This case is shown in Fig. 52.8.
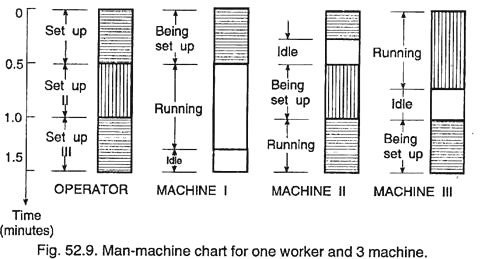
In this case, the worker still remains idle for 0.25 minute in each operation. So in order to minimise this, let us allow one worker to work on three machines. This is shown in Fig. 52.9.
In this case, the worker would have no idle time, except for necessary personal and fatigue allowances, but each machine would be ideal for 0.35 minute after each operation. Now, therefore, the problem is, which of the alternatives would be economical ? For this purpose, the unit cost of idle time of one worker and the unit cost of idle time of each machine is estimated and then the economical alternative is calculated.
Operation Analysis:
Where workers do their job independently, management requires to know whether they are doing job, in the most efficient way or not. The purpose of operation analysis is to determine a simpler and more economical way of doing a job, by analysing the job and the individual motions of workers.
Here, a close study of the work of individual worker is made to determine a better method of performing his job. To do this, operation analysis is applied. In this, the steps in a job and the motions used by the worker to perform these steps are recorded. In this study, principles of Motion Economy are applied. Using these principles as guide, a better and more economical method of performing an operation is developed.
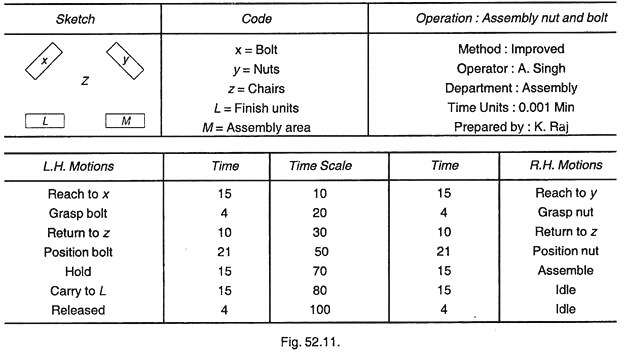
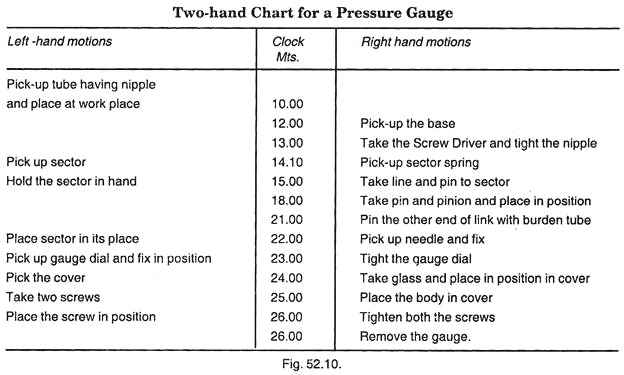
To aid this technique, Left-hand/Right-hand chart (Two-hand chart) and Simo Chart are used. These are shown in Figs. 52.10 and 52.11. The purpose of constructing these charts is to point out unbalanced work situations between the two hands so that these situations can be corrected, thereby reducing fatigue and increasing productivity.
After constructing these chart, we question each step. Can a motion be eliminated or simplified? Can we eliminate or reduce transportation? Can we delay? Can holding be eliminated by using a jig or fixture and so on. Thus questioning each activity and applying the principles of “Motion Economy”, manual work can be improved.
6. Two-Hand Chart:
This is also known as Left-hand/Right-hand chart and is used to improve the motion sequence of an operator. The chart is used to minimise the unnecessary motions and to arrange the remaining motions in an economical way. The chart is prepared after studying the working place, arrangement of the worker and of the equipment while he is working.
Some of the operations like assembling of small instruments such as pressure gauge, carburetor, time piece and fuel pump etc. where both hands are used for placing the different components of the article, Left-hand/Right-hand Charts are prepared. The study of the chart gives the clear picture of defective arrangement of tools, incorrect motion sequence and unnecessary and defective motion etc.
A Left-hand/Right-hand chart for the assembling of pressure gauge is shown in the Table at Fig. 52.10.
7. Simo (Simultaneous Motion) Chart:
This is similar to Table at Fig. 52.10. “Two-hand Chart” with the difference that the time required for each motion is drawn to scale with the vertical axis and sometimes coloured to represent the particular motion.
The procedure to construct this chart is as under:
A spring powered camera with high speed clock is placed near the work place and is used to record the film time and the operator’s actions simultaneously. After recording, the film is worked and processed and viewed to determine the motions performed and time taken.
From these records, activities and time taken are plotted in the form of Simo Chart as shown below: 