
This article throws light upon the top six modern methods of control exercised in an organisation. The modern methods are: 1. Management Information System (MIS) 2. Management Audit 3. Responsibility Accounting 4. Network Techniques – PERT and CPM 5. Balanced Score Card 6. Ratio Analysis 7. Economic Value Added (EVA) 8. Market Value Added (MVA).
Modern Method # 1. Management Information System (MIS):
MIS at Different Managerial Levels:
Managers at different levels retrieve different information through MIS.
(a) Lower-level managers:
Activities of routine and operational nature are carried out at this level. Continuous supply of information at very short intervals is required through MIS, which may be weekly or even daily. Information about units sold helps to adjust production schedules and carry out operational planning and control.
ADVERTISEMENTS:
(b) Middle – level managers:
Middle – level managers or departmental heads need information about performance of their departments so that predictions can be made for the departmental activities. Personnel manager, for example, may want to know the rate of labour absenteeism, turnover and labour needs to design personnel policies and keep the labour satisfied. This ensures regular supply of labour to all the departments of the organisation.
(c) Top-level managers:
Top-level managers perform strategic planning and control and, therefore, need information about the external and internal organisational factors so that organisation can adapt to the environmental changes. Managers need to know financial performance of the company and its competitors so that changes can be made in the internal policies. Information about the external environment can be retrieved through management information system.
Guidelines for effective MIS:
ADVERTISEMENTS:
Following guidelines help in effectively carrying out the MIS development process:
(a) Involvement of users:
While MIS is designed by specialists, it is used by operating managers. If operating managers participate in designing the MIS, the system designers will be able to provide right information at the right time for managerial action and decision-making.
(b) Cost-benefit analysis:
ADVERTISEMENTS:
Designing and implementing MIS is costly in terms of time and money. Though MIS is justified as a cost saving controlling technique, the costs may overrun the benefits. A thorough cost-benefit analysis and laying down responsibility of managers for operating the system will help the organisation in holding accountability for costs. This will result in better use of MIS.
(c) Quality of information rather than quantity:
MIS should provide relevant information to managers (top, middle and lower levels) for decision-making. Studies reveal that managers who suffer from information overload normally show low levels of performance. MIS should condense information and provide data on critical factors which indicate organisational ineffectiveness. It should “filter or evaluate information so that only the most relevant information will be supplied to the appropriate manager.”
(d) Pretesting the MIS:
ADVERTISEMENTS:
Rather than straightaway implementing the MIS, it should be tested so that defects in the implementation process do not result into over-costs and financial losses.
There are four approaches to pretesting the MIS:
(i) Direct installation:
Where new MIS has to totally replace the old system, it should be tested so that after-installation defects do not fail the system.
ADVERTISEMENTS:
(ii) Parallel installation:
The new system is implemented along with the old system. The old system is removed after the new system proves to be successful, that is, it performs better than the old system. Though costs of thorough pretesting the new system are avoided, the costs of running two systems simultaneously are increased.
(iii) Pilot installation:
MIS is installed in small part of the organisation, say sales division, and the system is tested while it is in operation. Problems can be corrected before the system is completely installed.
ADVERTISEMENTS:
(iv) Phased installation:
It installs the system in phases. It allows operational testing and correction of deviations while moving from one stage to another.
(e) Training the operators and users of the system:
Managers should be trained to operate and control the MIS. Training increases their familiarity with the hardware, software and supporting system. Knowledge about how to use the system increases efficiency of the organisation structure and task responsibilities.
ADVERTISEMENTS:
These guidelines help to obtain valuable information for effectively carry out the planning and controlling functions. Managers get information for planning, organising, decision-making and controlling the task performance.
Advantages of MIS:
Effective system of MIS provides the following advantages to the organisation:
(a) Accurate information:
Accurate and timely information helps to make rational and scientific decisions. Good decisions help in effective planning.
(b) Relevant information:
In the absence of MIS, managers will have to collect huge information and scan relevant information for making decisions. This is costly and time consuming. MIS helps to retrieve only relevant information from the information system and save both time and cost.
ADVERTISEMENTS:
(c) Facilitates managerial functions:
MIS helps in making optimum decisions with respect to planning, organising, staffing, directing and controlling.
(d) Facilitates coordination:
Timely, accurate and relevant information helps in coordinating activities of different departments (production, marketing, personnel and finance).
Modern Method # 2. Management Audit:
Audit means periodic inspection of financial statements and verification that statements are honestly and fairly prepared according to accounting principles. Audit, thus, provides the basis for control.
Types of Audit:
Two types of audit can be conducted by a firm:
ADVERTISEMENTS:
(a) External audit and
(b) Internal audit.
(a) External Audit:
It refers to verification of financial statements. Assets, liabilities and capital accounts are checked and deviations are reported to managers for action. Control is, thus, facilitated through verification of accounts against the standard principles. This is known as financial audit.
External audit checks fraudulent practices in preparing financial accounts. Outside parties like investors, bankers and financial institutions can enter into fair and honest dealings with the firm if its accounts are audited. External audit is conducted by people external to the organisation. Certified Public Accountants or Chartered Accountants conduct this audit for the firms.
The Institute of Chartered Accountants of India defines auditing as “a systematic and independent examination of data, statements, records, operations and performances (financial or otherwise) of an enterprise for a stated purpose. In any auditing situation, the auditor perceives and recognises the propositions before him for examination, collects evidence, evaluates the same and on this basis formulates his judgement which is communicated through his report.”
ADVERTISEMENTS:
Since external audit is conducted at the end of the financial year when accounts are prepared and actual results are compared with standards, it helps to control future actions. Current operations cannot be controlled by managers. This limitation of external audit is overcome by internal audit.
(b) Internal Audit:
It refers to verification of statistical data and reports so that correct and fair presentation of financial statements is made. It evaluates the firm’s internal operations, determines where things have gone wrong and where corrective action is needed. It examines the efficiency with which the firm utilizes the assets and carries its operations in the light of environmental factors.
It assesses the quality of management which affects the success of organisation. It evaluates the management as a whole and examines the management process of planning, organising, staffing, directing and controlling. This audit is conducted by members internal to the organisation. The members may belong to the department of finance or there may be a separate internal auditing staff (in case of large-sized organisations),
A.E. Mackay suggested that internal team for carrying out management audit should comprise of managers from the following organisational areas:
(i) Operations management,
ADVERTISEMENTS:
(ii) Financial management,
(iii) Internal auditing,
(iv) Electronic data processing systems management, and
(v) The Board of Directors.
Internal audit verifies the efficiency with which managers run the enterprise and, therefore, it is more appropriately termed as management audit. “It aims at evaluating the quality of management and the quality of managing as a system.”
It assesses the organisation’s objectives, policies, plans and managerial efficiency (planning, organising, directing and controlling). It reviews the company’s past and present policies and suggests ways to check the deviations. Management audit is, therefore, evaluation of managers and the enterprise as a whole.
ADVERTISEMENTS:
John Crowhurst defines management audit as, “the comprehensive examination of an enterprise to appraise its organisational structure, policies and procedures in order to determine whether sound management exists at all levels, ensuring effective relationship with the outside world (i.e., shareholders, suppliers, customers, the community in general) and internal efficiency.”
Areas of Management Audit:
Management audit ensures that organisational resources are optimally utilised, employee turnover and absenteeism is low, right quality and quantity of work is produced, managers effectively discharge duties towards outside groups like customers, suppliers etc. and an effective system of inventory control is maintained.
Ten specific areas of management audit are identified by Jackson Martindell.
These are:
(i) Fiscal policies,
(ii) Earnings of the firm,
(iii) Fairness of accounts to shareholders,
(iv) Research and development,
(v) Sales,
(vi) Economic functions,
(vii) Board of Directors,
(viii) Organisation structure,
(ix) Ability of the executives, and
(x) Efficiency of production.
Objectives of Management Audit:
Management audit is conducted to achieve the following objectives:
(i) To appraise managerial efficiency with respect to objectives, policies and procedures of the organisation.
(ii) To assess whether organisational policies are followed or not.
(iii) To evaluate management’s performance with respect to standard performance.
(iv) If actual performance deviates from standard performance, to find out causes for the same.
(v) To suggest measures to remove deviations and improve managerial performance.
(vi) To assess whether or not the enterprise is adapting to technological changes.
(vii) To assess whether or not return on capital is satisfactory, vis-a-vis other companies.
(viii) To assess corporate image in the national and international markets.
Merits of Management Audit:
Management audit has the following merits:
(i) Analysis of firm’s objectives and plans helps in making policies and procedures.
(ii) Control becomes possible at the micro level since every activity is subject to audit and control.
(iii) Organisational activities are controlled by managers but management audit controls the activities of managers.
(iv) Audit of managerial efficiency by internal members promotes their personal growth and development.
(v) It improves communication since all organisational members are involved in management audit.
(vi) It measures the extent to which current managerial controls are effective.
(vii) It tests the reliability of data in the organisation.
(viii) It highlights the opportunities that organisations can venture into.
Limitations of Management Audit:
Management audit suffers from the following limitations:
(i) It is an expensive technique of control since it deeply analyses every activity. A thorough cost-benefit analysis must, therefore, be made to justify management audit.
(ii) It can hamper the creative and innovative skills of managers. They may not take up innovative projects as small mistakes will also be audited by the audit staff.
(iii) The staff for management audit has to be trained to conduct this audit.
(iv) Besides training, auditors must also have behavioural skills to communicate and coordinate their knowledge and skills with other organisational members.
(v) Even if auditors have the behavioural skills, personal bias may affect their judgment of managers.
(vi) Unlike financial auditors, management auditors are not required to hold any professional qualification. Therefore, dishonest and unscrupulous persons may take up the task of management audit and harass honest people of the firm.
These limitations can be overcome by taking suitable safeguards to enhance the efficiency of management audit and effectiveness of managerial policies and practices.
Modern Method # 3. Responsibility Accounting:
It divides the organisation into small units where head of each unit is responsible for achieving the targets of his unit. These units are called responsibility centres and head of each responsibility centre is responsible for controlling the activities of his centre. Performance of responsibility centre is judged by the extent to which targets of the centre are achieved.
There are four major responsibility centres:
(a) Cost Centres:
These centres aim to achieve their goals within the cost constraints. Various direct (raw material, labour etc.) and indirect costs (research and development expenses) are determined and the centre head limits the expenses within the budgeted costs.
(b) Revenue Centre:
The revenue is estimated and expressed in monetary terms and sales figures are compared with budgeted figures. This determines the efficiency of the revenue centre. Corrective action is taken if estimated revenue is not achieved.
(c) Profit Centre:
This centre has the responsibility of earning desired amount of profits. (Difference between revenue and costs). These centres can be divisions, departments or the organisation as a whole.
(d) Investment Centre:
Profits depend upon efficient use of assets. Investment centres invest in assets which generate maximum revenue and profits for the enterprise. Efficiency of investment centres is judged through the returns they earn on investments. Thus, each responsibility centre is responsible to control activities related to his centre.
The cost control centre, for example, does not control costs related to any particular product but controls costs of the entire organisation. Profits and revenues are similarly measured by other centres for the entire organisation. This help to know whether or not the organisation is able to achieve its standards in terms of cost, revenue, profits and investment.
Modern Method # 4. Network Techniques – PERT and CPM:
When a complex project involves a series of inter-related or inter-dependent activities, the network models or techniques help to plan, coordinate and control the network of activities. It helps to arrange parts of a programme together with respect to time and events.
It ensures that the project is completed within the stipulated time. Various sequences of activities are scheduled with reference to time and cost and managers execute the project within the constraints of time and cost.
For new projects, time-event network analysis is done for every new project like constructing a bridge, dam or a building but for mass production and repetitive systems, time-event network analysis continues for every production cycle till there is any change in the system. Time is an important factor in network technique because it involves huge penalty if the project is not completed within the stipulated time.
A popular network technique to execute complex project is PERT/CPM.
(a) PERT:
Programme Evaluation and Review Technique developed initially for the US’ Navy special projects.
(b) CPM:
Critical Path Method developed by researchers of DU Pont Company and computer specialists from Remington Rand Company.
PERT – Programme Evaluation and Review Technique:
Pert is also called time-event network. It is used to plan and control a complex project represented as a network of events and activities, with time estimates given to complete each activity.
It is a network of events and activities on a project with estimated time for completion of each activity.
Event is the beginning or ending of the activity. It is represented by a circle in the network. An event by itself does not use time or resources.
Activity is the time taken by operation between two events. It represents time taken to complete an event. It is represented by an arrow.
A simple network of events and activities appears like this:
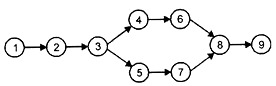
1. It shows that the project has to be completed from event doubt are the events represented by a circle and a number. Two events are joined by an activity. Activity is the job performed to complete the event. Each activity takes some time to perform.
2. Activities are represented by arrows and arranged in a sequence with events preceding and succeeding it. Preceding events should be completed before the next event can start. Some of the activities can be taken up simultaneously and the network shows the sequence of activities and time taken to complete the various activities.
3. Events move in a sequence and measure the progress of the project. Therefore, there should be correct time estimates for each activity. The exact time cannot be estimated as the activities are performed in future and future happenings cannot be estimated correctly. The time estimates to complete each activity are, thus, the expected time and not the exact time.
4. Arrow at a particular event indicates that an activity can ‘begin’ when all activities terminating at that event have been completed. For instance, activity ⑧→⑨→can be done when activities ⑥→ ⑧and ⑦→ ⑧have been performed.
5. Critical path is determined by adding the time estimates for different activities to complete the project. It is the path which takes the longest time as the project cannot be completed in time lesser than this. For instance activity ⑧→ ⑨cannot be undertaken till ⑥→ ⑧and ⑦→ ⑧ are undertaken. Since⑥ → ⑧ takes 7 weeks and ⑦→ ⑧ takes 4 weeks ⑧→⑨ cannot be performed till before 7 weeks when ⑥→ ⑧ is completed.
Even after completing ⑦→⑧ in 4 weeks, managers have to wait for another 3 months for activity ⑥→ ⑧ to be completed. The longest time period, thus, forms part of the critical path. Time is an important part of network analysis as delay in completion of the project beyond the critical path will be costly for the firms.
The expected time taken by each activity depends upon three time estimates:
a. Optimistic time (to):
It is the time taken to complete an activity when everything goes well, as expected. It accounts for no disruptions. This is the least time to perform an activity.
b. Most likely time (tm):
It is the time normally taken to complete an activity. It is the realistic time taken for completing an activity. It accounts for reasonable amount of disruptions. It lies between optimistic and pessimistic time.
c. Pessimistic time (tp):
It is the opposite of optimistic time and specifies the time taken to complete the activity if nothing goes well. This is the maximum time to perform an activity.
Expected time (te) to complete each activity is computed as follows:
te = to +4tm+tp/6
Expected time taken to complete the activity is written below the activity or the arrow.
The network shown above with three time estimates (appearing above the arrow) and the expected time (appearing below the arrow) appears as follows:
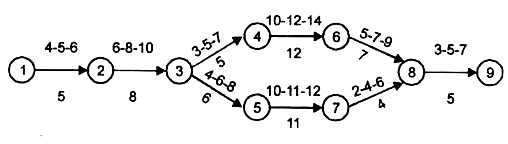
(Time may be in weeks, days, months or any other time parameter)
Expected time to complete the project, depending on two sequences of activities is:
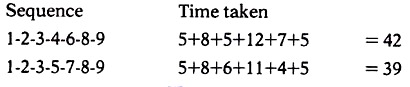
The sequence of events and activities that takes the longest time to complete the project is called the critical path. This path is called ‘critical’ because it identifies the sequence of all the desired activities required to complete the project.
The critical path requires attention because:
(a) Delay along this path will delay the entire project.
(b) Special study of each activity along the critical path can result in finding ways to reduce time for activities on the critical path and, thus, reduce the overall project time.
(c) Advance planning along the critical path can cause another path to become critical by spotting the bottlenecks in the given path.
Managers must focus on the critical path. Delay in completing an activity along the critical path by one week will delay the whole project by one week.
The critical path can be shortened by:
(a) Reducing the expected time for any of the activities,
(b) Transferring resources from other paths to the critical path.
(c) Deleting some of the activities on the critical path, if possible.
The purpose of PERT is to reduce completion time of the project to avoid delay in completion.
CPM – Critical Path Method:
CPM determines critical activities for completing the project, assumes expected time as time taken to complete the project and concentrates on critical sequence of activities to optimise the use of time and resources. It concentrates, therefore, only on the critical path and not the whole project.
CPM also plans and controls various sequences of events and activities similar to PERT with the difference that:
(a) PERT specifies the expected time to complete various activities based on three time estimates, CPM considers one time estimate for completing each activity.
(b) PERT identifies only time estimates but CPM identifies both time and cost estimates. PERT is, therefore, used where time factor is important for completing the project and CPM is used where both time and costs are important.
(c) PERT deals with projects whose activities are non-recurring in nature. CPM is used where standard activities are performed to complete the project, that is, where time for completing the activities is known.
Merits of Network Techniques:
The PERT/CPM techniques of control have the following merits:
(a) It enables managers to plan the time and cost estimates for completing a complex project.
(b) Primary focus is on critical path which helps to complete the project in time. If managers feel that critical path is taking longer than the estimated (or standard) time, they can divert resources from other paths to critical path. It, thus, facilitates control by exception.
(c) It helps to find deviations at the point of occurrence and take timely action to correct them.
(d) It improves communication in the organisation as people performing different events constantly interact with each other.
(e) These techniques are important for projects where time is the important factor. Delay in completing the project by even one day involves huge fixed costs and may attract penalties for not completing the project in time.
(f) Since time and cost schedules are determined for each activity, there is optimum allocation of scarce organisational resources.
(g) It is more of a feed-forward controlling device than a feedback technique of control. It helps managers in anticipating problems and account for them in their current plans.
Limitations of the Network Techniques:
(a) These techniques are time-consuming and, therefore, thorough cost-benefit analysis should be done before applying them.
(b) They are based on estimates of time and cost. If the estimates go wrong, planning will also go wrong.
(c) Time and cost factors are the main focus of attention. Other factors that affect efficient completion of the project are not considered.
Proper planning and analysis of events and activities (network) enables managers to benefit by these techniques.
Modern Method # 5. Balanced Score Card:
Balanced score card is “a performance measurement tool that looks at four areas — financial, customer, internal processes and people / innovation / growth assets—that contribute to a company’s performance.” It evaluates organisational performance in terms of financial and non-financial parameters.
It is a performance appraisal and reporting system that maintains balance between financial and non-financial measures. It links performance with rewards and recognises the diversity of organisational goals. It presents financial and non-financial measures to evaluate the firm’s long-run and short-run performance in a single report. Managers develop goals in these four areas and take steps to achieve these goals.
For example, sales growth or return on investment (ROI) can be used as measures of financial performance; sales from new products can be used as measures of customer goals. Managers focus on these areas collectively to promote organisational success.
They maintain balance amongst goals in these areas. Emphasis on financial performance disregarding customer satisfaction or developing a score card around customer satisfaction ignoring finance and internal processes does not ensure organisational success.
However, depending upon strengths of the organisation where it has competitive advantage, it develops a score card around its major focus area (say, customer satisfaction). Other areas (financial, internal processes and people/ innovation/growth) support the main focus area.
While a finance company focuses more on financial component that reflects its success, marketing company shall focus on customers satisfaction as route to organisational success both in terms of profits and goodwill.
Score card reflects strategies of organisations around which resources are centered. It focuses on areas which provide value to customers through product development and equality operations besides profits for organisations.
A balanced score card (emphasis on four areas) described the strategies of IBM Global Services in Houston as follows:
“The internal processes part of our business is directly related to responding to our customers in a timely manner, and the learning and innovation aspect is critical for us since what we’re selling to our customers above all is our expertise. Of course, how successful we are with those things will affect our financial component.”
Objectives of Balanced Score Card:
Balanced score card has the following objectives:
(i) To translate objectives into financial and non-financial performance measures. Generally, three to five performance measures are set for each goal.
(ii) To provide information that reveals performance in all relevant areas (financial and non-financial) in an unbiased manner.
(iii) To help companies assess their performance and improve the operational plans.
(iv) To provide fair and balanced view of the organisation to formulate sound plans for future.
Contents of a Balanced Score Card:
Though contents of a balanced score card vary from business to business, it generally contains information in the following areas:
(i) Finance:
It relates organisational success and growth to financial parameters like cash flows, liquidity, operating income and return on capital employed. It measures financial results that company presents to its stakeholders. It represents whether financial policies and operations add value to stakeholders’ expectations from the company. Financial wealth is also measured by various ratios like profitability, liquidity etc.
(ii) Customer:
It indicates how much a business satisfies its customers by providing them quality goods and services. It aims to provide benefits to customers like low price, product differentiation, brand loyalty, quality etc. Success is measured by the extent to which organisations satisfy their customers.
The performance measures, thus, represent whether company’s operations add value to customers’ expectations from the company. Performance measures that indicate customer satisfaction are satisfaction index, customer loyalty, market share, competitive price, quality products relative to industry standards etc.
Customer loyalty represents whether the company is providing quality goods to customers to retain them. Market share represents how much business is the company doing with respect to a particular product for a particular customer segment. Competitive price represents the best price that the company offers to attract customers vis-a-vis competitors.
(iii) Internal processes:
It indicates performance in internal processes or areas of core competence. This varies according to nature of the company. For a manufacturing company, internal efficiency is judged in terms of manufacturing cycle time; for a trading company, indicators like volume of goods sold and increase in number of customers can be suitable indicators for measuring internal efficiency.
It represents improvement in company’s work processes in order to improve relationship with suppliers and customers. It can be related to financial and customer perspectives by enhancing the efficiency of production processes (reduce production stoppages and bottlenecks) to provide timely delivery of goods to customers (customer perspective) thereby adding customer loyalty and through it, profits (financial perspective).
(iv) People/innovation/growth assets (learning and growth):
It measures potential performance of a company by promoting its intellectual capital. It assesses people and infrastructure for its long-term success. It considers employees’ ability to learn, change and grow according to environmental conditions.
The focus is to ensure continuous improvement in growth assets (people). Performance measures are employees’ productivity (output per employee), their ability and creativity to generate new ideas and suggestions, their satisfaction in terms of morale and retention in terms of intellectual capital.
Employees should be given financial and non-financial incentives to promote their intellect, personality, learning and growth. Organisational success is, thus, measured by learning skills of its employees, output per employee and their morale enhancement. Satisfied and intelligent employees contribute to organisational productivity.
Benefits of Balanced Score Card:
Balanced score card has the following benefits:
(i) It enables the organisation to clarify its vision and strategy and convert it into performance driving activities.
(ii) It converts company’s strategy into a comprehensive system of performance measurement.
(iii) It presents important financial and non-financial performance in a single management report.
(iv) It helps to consider important performance measures together and maintain balance amongst them.
However, managers do not focus on all the areas. They focus on areas which drive their organisations to success. If the organisation is centred around customers, managers will pay more attention to customers than other areas. Performance in one area affects performance in others and, therefore, the score card should be designed to recognise synergies among the performance areas.
Modern Method # 6. Ratio Analysis:
Financial statements show financial performance in absolute figures. The statements, for example, may represent profit of Rs. 50 lakh or Rs. 40 lakh for a year. This figure becomes relevant when it is related to capital employed by the firm. Profit of Rs. 50 lakh may have been earned over a capital base of Rs. 1 crore giving a return of 50% while Rs. 40 lakh may have been earned on a capital base of Rs. 60 lakh giving a return of 66.7%.
Though the figure of Rs. 50 lakh looks more attractive, it is not actually so. Ratio represents relationship between two numbers. Ratio analysis draws comparison between selected items from the financial statements in percentages or fractions and assesses financial performance of the firm.
Uses of Ratios:
Ratio analysis has the following uses:
(i) Ratios can be used to compare current performance with the past performance. Performance over a period of time in a year can also be compared. This helps in making predictions. A fall in the profit ratio, for example, needs corrective action.
(ii) Ratios can be compared with ratios of other firms in the same industry. Comparing performance with other companies helps the company in assessing its market standing. Ratio analysis, thus, facilitates intra-firm and inter-firm comparisons.
(iii) Ratios help in taking corrective action by setting standards of performance for sales, profits etc. If these standards are not met, it requires corrective action.
(iv) Ratios help in delegation and decentralisation of authority by defining a target rate of return for departmental performance. Departmental heads compare their performance with the standard rate of return.
(v) Ratios help stakeholders in financial decision-making as they provide important information to determine their interest in the company. Profitability ratios, for example, help shareholders in deciding whether to retain or sell their holdings in the company. Banks and financial institutions assess liquidity ratios to find company’s financial strength and ability to repay the loans. Long-term creditors are interested in solvency conditions or leverage ratios.
(vi) Ratios optimise the use of capital and other resources. They reflect whether or not capital provides fair return to owners and other stakeholders. Comparison amongst performance of different departments and products can be made to know how best the resources are allocated and utilised. This promotes efficiency of the firms. Some of the important financial ratios are given below. Their detailed analysis is, however, not done.
(a) Liquidity ratios:
These ratios indicate the firm’s capacity to pay debts.
![]()
![]()
(b) Activity ratios: They determine how well a firm manages its operations.
![]()
![]()
(c) Leverage ratios:
They indicate the amount of funds supplied to the firm by its owners and non-owners.
![]()
![]()
![]()
(d) Profitability ratios:
These ratios indicate profitability of the firm.
![]()
![]()
![]()
Limitations of Ratio Analysis:
Ratio analysis suffers from the following limitations:
(a) Ratios focus excessively on financial factors. Firm’s efficiency is also judged by non- financial factors such as talent of management and employees, its policies and strategies, research and development etc.
(b) Ratios help in intra-firm and inter-firm comparison but do not provide scientific basis for determining the standard rate of return against which performance can be measured.
(c) Figures used in measuring certain ratios, for example, return on investment, do not reflect their true values as prices change over time. Investments are made at different points of time and may be reported at historical cost or depreciated cost. Price adjustments are important to make ratio analysis meaningful.
(d) Different firms adopt different basis for computing depreciation and inventory. Inter- firm comparison in such cases does not reflect their true performance.
Modern Method # 7. Economic Value Added (EVA):
Value added is an important tool to measure financial performance. It indicates net wealth or value created by the company. Its major goal is to maximise shareholders’ wealth. Companies generate wealth to survive and grow. A company may survive without profits in the short- run but it cannot survive without adding value to its wealth.
It covers financial management functions that result in wealth creation. Value added is a better measure of corporate performance than traditional financial accounting measures. Anything that has utility and provides satisfaction to a person has value for him.
Value added is “the wealth created by the reporting entity by its own and its employees’ efforts and comprises salaries and wages, fringe benefits, interest, dividend, tax, depreciation and net profits (retained).”
Corporate wealth (investment) is contributed by shareholders, debenture holders, creditors, financial institutions etc. It is necessary for corporate survival to add value to its wealth. Economic value added is “a financial tool for measuring corporate and divisional performance calculated by taking after-tax operating profit minus the total annual cost of capital.” (Equity + Debt). It measures how much value is created by a business enterprise. Increase in value of capital is value added.
It is surplus over cost of capital, that is, surplus income after paying to shareholders and lenders. A company must earn more than its cost of capital to share it with employees, management and shareholders. EVA = Operating Profit after Tax (-) Cost of Capital.
Economic value added indicates how much economic value is added by the company to its assets. It measures economic value created by a company over and above its profits less any capital investments made to earn profits. EVA may be positive or negative.
A positive EVA means returns are more than the cost of funds required to produce those returns. This means company has created value for the shareholders. A negative EVA means returns are less than the cost of capital and it has lost value for the shareholders. Under the conventional system of accounting, many companies appear profitable but they are not actually so. “Until a business returns a profit that is greater than its cost of capital, it operates at a loss.”
According to EVA, managers earn return on assets (or capital) above the cost of capital. It compares actual rate of return against the target rate of return and measures its true economic profit. Rate of return is the rate that company earns on investment and cost of capital is the minimum rate of return that firm should earn on investment for its market value to remain unchanged. It is the rate paid by the company to investors.
It is the discount rate that determines the present value of estimated future cash proceeds and helps in deciding whether or not a project is worth undertaking. EVA is closely related to Net Present Value (NPV) approach. If operations and assets of the organisation earn less than the cost of capital, they are abandoned.
As a performance tool, companies improve EVA by earning more profits without using more capital or using less capital, or by investing capital in high-return projects, that is projects whose returns are more than the cost of capital. It describes whether or not business optimally utilizes its assets to generate return and maximise shareholders’ value.
EVA is a tool to measure corporates’ real profitability. CEO of Coca Cola asserted: “We raise capital to make concentrate and sell it at an operating profit. Then pay the cost of capital, shareholders pocket the difference.”
Merits of EVA:
EVA has the following merits:
(a) It maximises the return of company above its cost of capital. The focus is on stakeholders (management or employees) and not owners (shareholders) only.
(b) It attempts to optimise the capital structure by minimising the cost of capital.
(c) It is an incentive tool for employees to improve organisational performance as they share surplus profits of the company.
(d) It optimizes the use of capital by investing in outlets that provide maximum returns. The aim is to maximise the difference between return on capital and cost of capital.
Modern Method # 8. Market Value Added (MVA):
Market value added is “a financial tool that measures the stock market’s estimate of the value of a firm’s past and expected investment projects.” Thus, it measures market value of the firm’s stock. If market value is more than capital invested (share capital, debentures and retained earnings), company will have positive MVA. It means managers have created wealth. If market value is less than capital invested in the firm, MVA will be negative which means wealth is destroyed.
MVA is the difference between market value of capital less book value of capital. Capital does not include debt as debt is not traded in stock market. It is more appropriately defined as difference between market capitalisation and net worth.
Market capitalisation is closing share price multiplied by number of outstanding shares on the date of balance sheet and net worth is equity share capital plus reserves and surplus minus accumulated losses and miscellaneous expenditure.
A firm that reports positive EVA for a number of years will have high MVA. MVA and EVA are financial control measures for monitoring and measuring organisational performance. They are fast replacing financial ratio measures such as return on investment.