
This article throws light upon the top six traditional techniques of control exercised in an organisation. The traditional techniques are: 1. Personal Observation 2. Budgetary Control 3. Break-Even Analysis 4. Financial Statements 5. Statistical Data and Reports 6. Quality Control.
Traditional Technique # 1. Personal Observation:
This is the simplest way to control organisational activities where managers take rounds at the work place and observe the progress of work. Defect in performance can be spotted and corrected immediately. Face-to-face interaction is possible where workers solve their problems on-the-job. They can also be guided there and then.
It creates psychological pressure on the employees and they perform better when they know they are being observed by the superiors. Managers also know the behavioural, technical and psychological problems of workers at the work place which they try to solve.
However, this method demotivates the employees as they work under psychological pressure of being constantly watched. It is also not suitable for large organisations where managers cannot personally observe the performance of workers individually. Small, medium and non-profit organisations can be benefitted more by this technique of control than large-sized, profit-making organisations.
Traditional Technique # 2. Budgetary Control:
ADVERTISEMENTS:
“Budgetary controlling is a process of finding out what is being done and comparing the results with the corresponding budget data to verify accomplishments or to remedy difference. Budgetary controlling is commonly termed as budgeting.” — Terry and Franklin
A budget is a statement which projects income, expenditure and profits of the firm. It is future projection of the firm’s financial position. Non-financial aspects like units produced, units sold, unit cost of material and labour etc. can also be important components of the budget.
A budget is “the process of stating in quantitative terms, planned organisational activities for a given period of time.” Budgetary control compares actual performance with planned or budgeted performance to control activities at every level of the organisation. Budgets are prepared for the organisation as a whole and also for every department.
Purpose of Budgets:
ADVERTISEMENTS:
A budget serves the following purposes:
(a) It provides a yardstick to measure and compare quantitative performance (financial or non-financial) of different departments, at different levels and different time periods. Deviations are reported for remedial actions. A budget thus, acts as a controlling device.
(b) It facilitates coordination of resources committed to various projects in the business. It is prepared keeping into account resource (financial and non-financial) constraints of different departments.
(c) It provides guidelines about the resources and expectations of the organisation.
ADVERTISEMENTS:
(d) It facilitates intra and inter-managerial and divisional performance of the organisation.
(e) It boosts employees’ morale to achieve standards laid in the budget.
(f) It maintains efficiency by ensuring that organisational actions conform to budgetary standards.
Budget – A plan or a controlling device:
ADVERTISEMENTS:
Budget is a single-use plan which provides standard for measuring performance. Framing standards is an important feature of plans and budget, therefore, can be rightly called a plan. It specifies anticipated results in financial terms and serves as the basis for controlling future revenues and expenses.
As a controlling device, it provides a basis for feedback, evaluation and follow-up. It facilitates comparison of performance with planned performance and helps to correct deviations in actual performance. The comparison of performance and rectification of errors is the essence of control. A budget can, therefore, be both a plan and a device for control.
Zero base budgeting:
In budgeting process, past normally provides the basis for future performance. Additions or deletions are made in previous years’ budgets to make projections for future. For example, if an enterprise sold 10,000 units last year it may project sales for the current year at 11,000 units, presuming increase in sales by 10%, and a budget shall accordingly be made for 11,000 units.
ADVERTISEMENTS:
Zero base budgeting does not follow this norm. It does not consider future as projection of the past. The company assesses the current year’s activities, relates them with its goals, conducts cost-benefit analysis for each activity and allocates fresh resources to each activity. This means preparing budget from the scratch, allocating resources based on priorities of activities and not on last year’s allocations. Zero base means that budgets are not based on earlier year’s estimates. Rather, they start from the base ‘zero’.
Merits of Zero base budgeting
(a) Activities are ranked on the basis of importance for the current and future years and not their past performance.
(b) It allows freedom of allocating resources to organisational activities in the order of priority.
ADVERTISEMENTS:
(c) Budgets are more effective as they combine planning and control into one process instead of two distinct functions as considered under the traditional system of budgeting.
(d) Zero base budgeting ensures that managers at all levels make detailed evaluation of cost-effectiveness of the activities of their respective units.
(e) Involvement of managers at all levels promotes participation in planning and budgeting.
Types of budgets:
ADVERTISEMENTS:
Two major kinds of budgets to plan and control organisational activities are:
I. Operating budgets and
II. Financial budgets.
I. Operating Budgets:
Operating budgets relate to operating activities of the enterprise. They involve both revenues and expenses. “It is a statement that presents the financial plans for each responsibility centre during the budget period and reflects operating activities involving revenues and expenses.”
“An operating budget is concerned with planned operations within the organisation and outlines what quantities of products and/or services the organisation intends to create and what resources will be used to create them.”
ADVERTISEMENTS:
Operating budgets are of the following types:
1. Expense Budgets:
They specify expected expenses to be incurred in producing goods and services.
The expenses can be:
(i) Fixed expenses:
These expenses remain constant irrespective of the volume of output. Insurance, depreciation, taxes etc. are fixed expenses incurred regardless of the volume of production.
ADVERTISEMENTS:
(ii) Variable expenses:
These expenses change in proportion to production. Raw material, labour and overhead expenses are variable expenses that vary with the volume of output.
(iii) Discretionary expenses:
These expenses are incurred at the discretion of managers and cannot be perfectly predicted. Research and development expenses and legal expenses are the common forms of discretionary expenses.
2. Revenue Budgets:
Revenue budgets are projections of sales and other activities which earn revenue for the firms. They are estimates of units sold and selling price per unit. There is uncertainty in revenue budgets as revenue is based on future activities.
ADVERTISEMENTS:
3. Profit Budgets:
Profit budgets predict profits of the enterprise. They are based on expense and revenue budgets (profits are the difference between revenues and expenses). If the desired profit is not earned, managers try to increase the sales or reduce the expenses.
II. Financial budgets:
These budgets predict the sources and uses of funds. Financial budgets facilitate the working of operating budgets.
Financial budgets are of the following types:
1. Capital Expenditure Budgets:
ADVERTISEMENTS:
Capital expenditure means expenditure on fixed assets like plant and machinery, building, fixtures etc. They involve huge amount of investment, affect long-term profitability of the firms and are not easily reversible.
Thoughtful planning is required to invest in capital assets. Capital expenditure budgets indicate the time when these investments should be made and alternative sources from where funds shall be raised. These budgets are prepared by top managers of the organization.
2. Cash Budgets:
A cash budget shows cash position of the firm over the budgeted period.
The company can know:
(i) When it will face shortage of cash so that managers can arrange for funds in advance,
ADVERTISEMENTS:
(ii) When it will have surplus cash so that surplus money can be invested in investment outlets to earn some return.
Cash budget coordinates cash shortage with cash surplus to ensure even flow of cash throughout the budgeted period.
3. Balance Sheet Budgets:
After making different budgets and initiating organisational operations, balance sheet budget predicts the assets, liabilities and capital of the firm at the end of the budgeted period. If balance sheet projects that debt equity ratio is more than optimum, efforts should be made to correct the ratio by reducing the debt or increasing the equity.
Fixed and Variable Budgets:
A budget in which costs for a level of output are fixed is called fixed budget. If output increases beyond the budgeted level, costs also increase correspondingly. To cope with the situation of variable levels of output, variable budget is prepared.
It reflects changes in costs for varying levels of output. Budgeted costs are predicted for different levels of output so that increased levels of output do not face financial problems. Flexible budgets can be alternative budgets or supplementary budgets.
1. Alternative Budgets:
They are prepared for different levels of output and the level at which the enterprise actually operates will determine the alternative budget to be adopted. For example, alternative budgets are prepared for output levels ranging from (a) 0 – 5,000 units, (b) 5,000 – 10,000 units, (c) 10,000 – 15,000 units. If the company predicts sales volume at 8,000 units, it will pick up the budget designed for the output level of 5,000 – 10,000 units.
2. Supplementary Budgets:
Original budget is prepared for the budgeted period, say one year, and supplementary budgets are prepared for sub-periods, say one month on the basis of projected output for that month. If output level as per the main budget exceeds the projected level, supplementary budget for that month can be used for spending funds above the budgeted output.
For example, company prepares the yearly budget, projecting sales at 5,000 units for the month of June, but actual sales are 8,000 units. The monthly budget prepared for June can supplement the main budget and additional expenses can be incurred for 3,000 units.
Effective Budgetary Control:
The following guidelines help in making budgetary control effective:
(i) Standards:
The standards against which actual performance is measured must be framed accurately. Wrong standards undermine the measurement of actual performance.
(ii) Accurate and precise information:
As much as possible, information (since it is future- based) on which budgets are based should be accurate. Inaccurate information can defeat the purpose of budgeting.
(iii) Timeliness:
Deviations should be frequently reported so that managers can take timely action to correct them. Untimely reporting of deviations can result into losses.
(iv) Involvement of top management:
Budgets must receive the support of top managers for their effective implementation at lower levels.
(v) Flexibility:
Budgets should not be rigid. Flexible budgeting makes budgetary control effective. They allow freedom of discretion in changing the budgetary allocations, though within specified limits.
(vi) Employee participation:
A budget which allows employees’ suggestions is more effective than a budget prepared by top managers and thrust upon employees for implementation.
(vii) Well-designed organisation structure:
Organisation structure with well-defined units, authority-responsibility relationships and communication system make budgetary control effective. Authority must be commensurate with responsibility for effective implementation of budgetary decisions.
(viii) Speedy action:
Actual and standard performance should be compared at frequent intervals so that speedy action can be taken to correct deviations.
Traditional Technique # 3. Break-Even Analysis:
Break-even analysis or cost-volume-profit analysis draws relationship between sales volume, costs and profits to find out the sales at which sales revenue is equal to cost. The point at which sales revenue is equal to total cost (fixed cost plus variable cost) is the break-even point.
Sales beyond the break-even point represent profits and sales below the break-even point is a situation of loss. As a technique of control, managers compare actual sales with the break-even point of sales and if sales are below this point, they improve their performance by increasing the sales or reducing the costs.
The break-even point can be diagrammatically represented as follows:

Selling price per unit = Rs. 10
Variable cost per unit = Rs. 5
Fixed cost = Rs. 20,000
Break-even point
![]()
![]()
![]()
At 4,000 units, the firm is indifferent to profits and losses. (Sales = Cost, it is a no profit, no loss situation). If the firm sells more than 4,000 units, it will earn profits and if sales are less than 4,000 units, it will incur losses. As a controlling device, managers must sell at least 4,000 units.
Advantages of Break-even Analysis:
(i) Managers estimate profit and loss at different levels of output and improve their performance to reach the break-even sales.
(ii) If managers cannot sell the break-even output, it can decide to delete the product. Similarly, products which are profitable can be added.
(iii) As costs are divided into fixed and variable, managers can focus on variable costs and reduce them to the extent possible in order to increase profits at a lesser break-even point.
(iv) It helps in determining the level of sales at which profits can be earned.
(v) If more than one product is produced with combined fixed cost, the chart is prepared for combined contribution of all the products and managers can focus on the most profitable products.
(vi) Impact of change in sales price can be determined on profits in order to consider change in prices of products; upward or downward.
(vii) It helps to know the optimum product mix if different products are produced with combined fixed cost.
(viii) In case the products are profitable at a low break-even point, the firm can also think of expanding its plant capacity to sell profitable products.
Limitations of Break-even Analysis:
(i) It assumes variable cost and selling price to remain constant for different levels of output. It does not always hold true. Increase in variable cost may be more or less than the proportionate increase in selling price.
(ii) Fixed costs also do not always remain constant. They may increase after a specific level of output. For example, for output up to Rs.20,000 units, fixed cost may remain constant at Rs.20,000. For output level beyond 20,000 and up to 40,000 units, it may rise to Rs.25,000 and for output range of 40,000 to 60,000 units, it may rise to Rs.30,000. These are known as step-up costs and increase with increase in output. Such costs are not considered in the break-even analysis.
(iii) Some costs cannot be divided into fixed and variable costs and, thus, do not form part of the break-even analysis.
(iv) It assumes all units to be sold at the same price. This does not happen in the competitive environmental conditions. Same product can be sold at different prices for different quantities at different time periods. This analysis will not give the correct break-even point in such situations.
(v) It is not suitable if the firm is producing different products with different fixed and variable costs. However, sophisticated software’s are available to solve this problem.
Traditional Technique # 4. Financial Statements:
Financial statements show financial position of the firm over a period of time, generally one year. They are prepared along with last year’s statements to compare present performance with last year’s performance and improve the future performance. As these statements are prepared at the end of the financial year, as a measure of control, they are guide to improve future performance.
These statements offer the following information:
(a) Liquidity:
It shows cash position of the firm. The firm can know how much cash it has to meet its liabilities.
(b) Financial strength:
It represents assets, liabilities and equity position of the firm.
(c) Profitability:
It is the excess of revenue over cost.
Two commonly used financial statements are:
(I) Balance Sheets, and
(II) Income Statements.
(i) Balance sheet:
It represents financial position of the firm at a point of time, usually March 31. A balance sheet describes the assets, liabilities and owner’s equity.
Assets = Liabilities (+) Equity.
(a) Assets:
Assets are the resources owned by the enterprise.
There are two types of assets:
i. Current assets:
These are the cash and near-cash assets which can be converted into cash within a short period of time, usually one year. Cash, accounts receivable, debtors and inventory are the common current assets.
ii. Fixed assets:
These assets have a life span of more than one year. Fixed assets are plant and machinery, building, land, patents, goodwill etc.
(b) Liabilities are the claims of outsiders against assets of the company.
They are also of two types:
i. Current liabilities:
These are claims payable by the company within a short period of time, usually one year. Bills payable, creditors and unpaid taxes are some of the current liabilities.
ii. Long-term liabilities:
These debts are repaid over a long period of time, usually more than one year, for example, bonds and debentures.
(c) Net worth or owner’s equity:
These are the claims of owners against assets. Net worth is the difference between assets and liabilities.
II. Income statement:
While balance sheet depicts financial position at a point of time (March 31), income statement shows financial performance over a period of time (financial year: from April to March). It is a statement of revenues and expenses. Revenues are the inflows of cash, for example, sales, interest received etc.
Expenses are the outflows incurred to earn the revenues, for example, purchase of raw material, payment of bills etc.
Difference between revenues and expenses is profit (revenue > expenses) or loss (revenue < expenses).
Current year’s statements are compared with last year’s statements and change in the profit or loss serves as the basis to control future performance.
Traditional Technique # 5. Statistical Data and Reports:
Data helps in applying statistical techniques of averages, regression, correlation etc. to predict the performance. Data can be used for diagrammatic representations like trend charts, histograms, pie charts, bar graphs etc. which assess company’s performance. Deviations can be detected and corrected.
Report is a statement that represents data in the form of information to carry out the controlling function. Statistical data and regular reporting system assess company’s financial and non-financial performance. A supervisor, for example, prepares a report on how salesmen deal with the customers. This report helps to control behavioural attitudes of salesmen to develop a good clientele.
Traditional Technique # 6. Quality Control:
Quality control uses operational techniques and activities to sustain quality of the product or service to satisfy customer needs. It is the traditional way to manage quality which ensures conformance of the products to specifications with respect to quality standards. It checks and reviews the work that has been done.
There are three stages during the production process when inspection is performed:
(a) When raw material is received.
(b) When raw material goes through the production process.
(c) When products are finished.
Inspection or testing takes place before products are dispatched to customers. It aims to maintain quality of goods at each stage of the manufacturing process rather than detecting errors at the end of the production cycle where faulty products may have to be discarded or reworked.
Quality control, as a means of achieving, maintaining and controlling the quality of goods, services and processes aims at coordinating the following activities:
(a) The product.
(b) The process through which the product is produced.
(c) Designing the product and the service according to specifications.
(d) Inspection of the product at various stages of production to ensure conformity to customer specifications.
(e) Inspecting quality of raw materials, machines and equipment, skills of workers and performance with respect to market research, warranty, repairs etc.
(f) Obtain feedback from customers to improve the design/process of the product.
Total Quality Management (TQM):
In the competitive business environment, there is great emphasis on quality of products and services resulting in the concept of total quality management.
According to ISO, quality management is “that aspect of the overall management function that determines and implements quality policy and as such is the responsibility of top management.” It is a managerial responsibility and controls all activities of the organisation. It is the “management of quality, totally and fully in all respects, small areas and all activities of organisation, right from top to bottom.”
It applies managerial efforts to change the entire approach to business and make quality a guiding factor in everything that an organisation does. The core of Total Quality Management is managerial attention on every organisational activity, howsoever small it may be. It aims at continuous improvement of the organisation and focuses on total satisfaction of consumers, both internal and external.
Defined as a tool for effective management, TQM refers to “organisation’s long-term commitment to the continuous improvement of quality — throughout the organisation, and with the active participation of all members at all levels — to meet and exceed customers’ expectations”.
TQM is a marked shift from a process, driven by external control through compliance of procedures to a process of habitual improvement, where control is embedded within and driven by the culture of the organisation. Improvement in quality standards becomes a habit of everyone in the organisation.
TQM is a continuous long-term process that involves constant managerial efforts to recognise and reinforce quality through continuous data collection, evaluation, feedback and improvement programmes.
For TQM to be effective, organisation has to be a learning organisation, that is, all organisational members, from top to bottom, both managerial and non-managerial have to endeavour for continuous training and education, measurement, accountability, recognition and rewards, communication and teamwork.
TQM is, thus, a continuous process of improvement for individuals, groups and the entire organisation, where managers change the organisation’s way of working by developing people’s knowledge about what to do, how to do, doing it with the right methods and measuring improvement of the process and the level of achievement.
TQM is:
Total:
Everyone in the company is involved in continuous improvement including customers and suppliers.
Quality:
Customers’ stated and implied requirements are fully met.
Management:
Executives are fully committed.
Application of TQM is facilitated by understanding the term ‘Quality Control’:
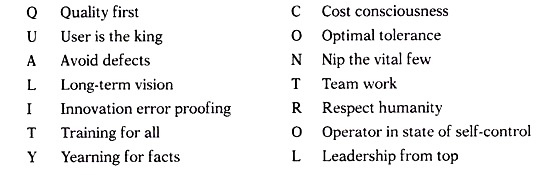
Tools/Techniques of TQM:
TQM can be put to practice by adopting the TQM methods. Adopting the right method is important as success of TQM largely depends upon the knowledge and selection of the method, its suitability for quality management problems and implementation by effective leaders. One of the most commonly adopted tools is Quality Circles.