
The following points highlight the seven main methods used for securities analysis of markets. The methods are: 1. Advance Decline Theory 2. Short Interest Theory 3. Block Uptick-Downtick Ratio 4. Money Flow Index (MFI) 5. Reversal Effect 6. New Highs and New Lows 7. Credit Balance Theory.
Method # 1. Advance Decline Theory:
The advance decline theory takes into consideration the total number of issues traded during a session and compares the number of stocks whose prices advanced with those whose prices declined. The total number of securities traded called ‘the breadth of the market’, varies from exchange to exchange.
The greater the number of securities traded compared to the number of securities listed, then greater the breadth of the market. For example, in Bombay Stock Exchange 2300 securities were traded on a specific day, of the total securities traded, 1100 advanced in price, 750 declined and 450 were unchanged.
Using the data, the technical analyst would calculate the percentage of the advance or the decline by subtracting the number of declining stocks from the number of advancing stocks and then dividing the net difference by the total number of securities traded.
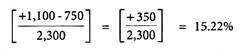
Continued positive and high net percentages indicate a technically strong bullish market. Increasing negative percentages indicate a technically weak market. Because of its focus on the breadth of the market instead of selected scrips (as with the Dow Theory). The advance decline theory has been widely used as the basis for developing more complex technical measures and theories about the market movement.
Method # 2. Short Interest Theory:
The technical analysts view short selling as a sentiment indicator. Investors sell short when they expect the market price of a security to decline. It considered that large outstanding short interest is a bearish indicator. When the short sellers begin to cover their position. They ‘buy in’ the borrowed stock, because of reversal in the downward price movement of the stock, the increased demand for the security will cause the price to rise even higher.
Large outstanding short interest is, therefore, considered to be a long-term bullish indicator. Small or moderate amounts of short interest are considered to have little potential impact on a stock’s price. Technical analysts consider the short interest ratio to be a more useful measure of the market’s potential movement.
![]()
The ratio does not represent a hard and fast indicator of a bullish or bearish sentiment, but there are some rule of thumb norms against which the ratio is compared. Generally, a short interest ratio is considered to be high when it is greater than 2. This is a bullish indicator because there are a large number of investors in the market who will have to buy back the shares that were sold short.
Method # 3. Block Uptick-Downtick Ratio:
ADVERTISEMENTS:
Trading in the equity market (especially the NYSE) has become dominated by institutional investors who tend to trade in large blocks. It is possible to determine the price change that accompanied a particular block transaction. If it is above the prior price, it is an uptick; if it is below, it is a downtick.
It is assumed that the price change indicates whether the transaction was initiated by a buyer (in which case you would expect an uptick) or a seller (in which case you would expect a downtick). This line of reasoning led to the development of the uptick-downtick ratio as indicator of institutional investor sentiment. This ratio has generally fluctuated in the range of 70 (a bearish sentiment) to about 130 (a bullish sentiment).
Method # 4. Money Flow Index (MFI):
The MFI is a momentum indicator that measures the strength of money flowing in and out of a security. One should look for divergence between the indicator and price action. A reversal is imminent when the price moves higher.
ADVERTISEMENTS:
MFI is related to the RSI only incorporates prices, the MFI accounts for volume. Just like RSI, MFI also ranges from 0- 100. In this above level 80 is said to be the upper band and below 20 is the lower band.
Method # 5. Reversal Effect:
There is a tendency for poorly performing stocks of one time period (a week or month) to perform well in the subsequent time periods and vice versa. This can be utilized in investment strategy in maximization of returns. Buy stocks that have recently done poorly and sell shares in those that have done well.
Method # 6. New Highs and New Lows:
In a booming market, more and more stocks attain new highs and a dwindling number of new lows. When the market is declining, more stocks will touch their new lows. This method can be used to know the trend of the market and can play investment strategy accordingly.
Method # 7. Credit Balance Theory:
The investors will maintain credit balances with their respective brokers for reinvestment of funds in the near future. The technical analyst will predict that when cash balances built up with the brokers represents high potential for market advancing and vice versa.