
In this article we will discuss about:- 1. Introduction to the Dow Theory of Technical Analysis 2. Basic Tenets of Dow Theory 3. Defects.
Introduction to the Dow Theory of Technical Analysis:
According to Charles Dow “the market is always considered as having three movements, all going at the same time. The first is the narrow movement from day-to-day. The second is the short swing, running from two weeks to a month or more; and the third is the main movement, covering at least four years in its duration.”
The theory advocates that stock price behaviour is 90% psychological and 10% logical. It is the mood of the crowd which determines the way in which prices move and the move can be gauged by analyzing the price movement and volume of transactions.
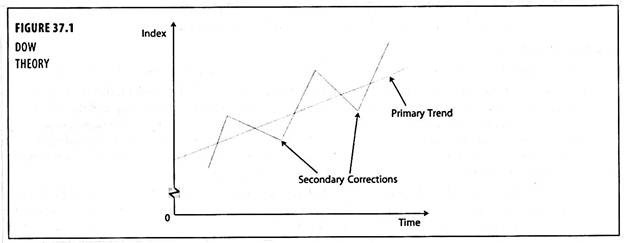
Figure 37.1 gives an example of a bull market trend. A bear market would be identified by exactly opposite trends. Dow used two indices, the ‘Dow Jones Industrial Average’ started in 1884 and the Transportation Index, mostly railway company shares. Similar trends in both indices had to be noted before a bull or bear market could be confirmed.
Basic Tenets of Dow Theory:
The basic tenets of the Dow Theory (DT) are few and simple and are:
1. The averages (index numbers) discount everything except ‘acts of god’ because they reflect the combined market activities of thousands of investors and traders.
2. The ‘market’ meaning the price of shares in general, swings in trends which may be major or primary, secondary and minor. The primary trends are the extensive up or down movements which generally last by 20% or more. Movements in the direction of the primary trend are interrupted at intervals by secondary swings, in the opposite direction. Finally, the secondary trends are composed of minor trends or day-to-day fluctuations which are unimportant.
3. So long as each successive rally or price advance reaches a higher level than the one before it, and each secondary reaction, or price decline, stops at a higher level than the previous one, the primary trend is up. This is called a ‘bull market’.
ADVERTISEMENTS:
4. When each intermediate decline carries prices to successively lower levels and each intervening rally fails to bring them back up to top level of the preceding rally, the primary trend is down and that is called ‘bear market’.
5. The secondary trends are the intermediate declines or ‘corrections’ which occur in bull market and the intermediate rallies or recoveries which occur in bear markets. Normally, they last from three weeks to as many months and generally retrace from one-third to two-thirds of the gain or loss in prices recorded in the previous swing in the primary direction.
6. The minor trends are the brief fluctuations lasting usually for six days but rarely for three weeks. These, so far as the DT is concerned, are meaningless in themselves but go to make up the secondary or intermediate trend. In theory at least this is the only trend that can be manipulated.
7. At times a ‘line’ can substitute for the secondary trend. A line in DT parlance is a sidewise movement which lasts for two or three weeks, may be for as many months, and in the course of its formation, prices fluctuate within a range of 5% or less of their mean figures.
ADVERTISEMENTS:
8. A trend should be assumed to continue in effect until such time as its reversal has been definitely signalled. The end of a bull market is signalled when a secondary reaction of decline carries prices lower than the level recorded during the earlier reaction and the subsequent rally or recovery fails to carry prices above the top level of the preceding recovery.
The end of a bear market is heralded when an intermediate rally or recovery carries prices to a level higher than the one registered in the previous rally and the subsequent decline halts above the level recorded in the earlier reaction.
In addition to the above, two other points are worth noting. First, the DT pays no attention to any extreme highs or lows which may have been registered during a day and takes into account only the closing figures. This point is significant from the chart of a share index because all the index numbers in use in India and almost everywhere, are based on the closing prices of the individual issues.
Second, the DT maintains that conclusive signals as to the market’s trend are produced in the final analysis by price movements and the volumes of business imply affords collateral evidence which may aid interpretation of otherwise doubtful situations. In this country, volume figures in the majority of cases are not published and so, this collateral evidence is not there.
Dow Theory’s Defects:
ADVERTISEMENTS:
Those who are serious of applying the DT to interpret the market would do well to note its following defects:
1. First, the DT provides a signal of change in the trend, often too late. The end of a bull market is signaled only when the nearest intermediate bottom is penetrated by more than 3 per cent of the level and the subsequent rally fails to carry prices or the index above the earlier top.
This deprives the trader of the chance of selling at the best level and enables him to capture “at best about 65% or not much more than half of the total move”. But then, there is no other way of forecasting that the change of trend has taken place at the top and it is better to be late than to be wrong.
2. The second defect is that the DT is not infallible. It depends on interpretation and is subject to all the hazards of human interpretative ability. It is also criticized for leaving the analyst in doubt. But often, this is because of the reluctance or inability of the analyst to reconcile the DT’s message with his own ideas, derived from other sources, of what the market should do. Experience has shown that the DT is usually more nearly right and ‘the fault lies with the chartist and not the chart’.