
Here is a term paper on ‘Securities Analysis’. Find paragraphs, long and short term papers on ‘Securities Analysis’ especially written for school and college students.
Term Paper on Securities Analysis
Term Paper Contents:
- Term Paper on the Meaning and Need for Securities Analysis
- Term Paper on the Meaning of Fundamental Analysis
- Term Paper on the Kinds of Fundamental Analysis
- Term Paper on the Meaning of Technical Analysis
- Term Paper on the Theories for Studying Stock Behaviour
- Term Paper on the Random Walk Hypothesis
- Term Paper on the Efficient Market Hypothesis
- Term Paper on the Importance of Stock Market Index
- Term Paper on BSE Sensex
Term Paper # 1.
Meaning and Need for Securities Analysis:
ADVERTISEMENTS:
Securities that have return and risk characteristics of their own, in combination make up a portfolio.
The entire process of estimating return and risk for individual securities is known as ‘securities analysis’.
A portfolio is simply a collection or group of securities considered in total as a single investment unit.
A portfolio can be defined very broadly and be taken to include property, antiques, works of art, bullion, commodities, financial securities etc.
ADVERTISEMENTS:
When any particular portfolio is assessed, the concern will be with its overall characteristics, its expected return and its risk.
Portfolio theory is concerned with the problem of making a selection of optimum investments in respect of a particular investor, taking into account the anticipated returns and the risks associated with them.
Portfolio management is the dynamic function of evaluating and revising the portfolio in terms of stated investor objectives.
The methods of securities analysis are classified under two heads:
ADVERTISEMENTS:
(a) Fundamental Analysis, and
(b) Technical Analysis.
Term Paper # 2. Meaning of Fundamental Analysis:
The fundamental analysis suggests that every stock has an intrinsic value, which should be equal to the present value of the future stream of income from the stock discounted at an appropriate risk related rate of interest.
ADVERTISEMENTS:
Fundamental analysis tries to value the underlying factors in a business and estimate the intrinsic value of a security.
Fundamental analysis is all about doing qualitative and quantitative analysis about basic details of the business such as the revenue, expenses, assets, liabilities and all other fundamental aspects of the company.
Estimate of real worth of a stock is made by considering the earning potential of a company, which depends on investment environment and factors relating to specific industry, competitiveness, quality of management, operational efficiency, profitability, capital structure and dividend policy.
Fundamental analysts assume for the purpose of valuation that a share’s current intrinsic value must be calculated not on its potential capital gain, but on the total future return for which an investor holds the share for good.
ADVERTISEMENTS:
A share’s true value ‘discounts’ its future earnings, that is, it takes into account the present worth of all those anticipated earnings.
As the approach is based on relevant factors like economic climate and trends in financial markets, it generally gives more realistic estimate of the value of a stock.
The fundamental analysis is helpful in establishing basic standards, but cannot be totally relied because of the uncertainties associated with the economic and market factors.
Term Paper # 3. Kinds of Fundamental Analysis:
ADVERTISEMENTS:
The fundamentals of a company can be grouped into three categories:
(a) Quantitative analysis,
(b) Qualitative analysis, and
(c) Other aspects.
ADVERTISEMENTS:
a. Quantitative Analysis:
The quantitative analysis is based on numerical terms and factors like operational efficiency, profitability, and capital structure and dividend policy. The quantitative factors are those which can be obtained from the financial statements. The factors like revenue, expenses, profit, deferred revenue, capital structure, working capital, deferred revenue etc. Let us consider some of the ratios which are used in qualitative analysis.
Return on Investment The prime motive of a business enterprise is to earn a return on capital employed or invested. The rate of return on investment (ROI) is determined by dividing net profit or income by the capital employed or investment made to achieve that profit.
ROI consists of two components viz.:
(1) Profit margin, and
(2) Investment turnover.
![]()
![]()
The analysis of firm’s ROI reveals the efficiency in utilization of assets in achieving the profits and its productivity.
Price/Earning Ratio – P/E ratio is the widely used index, which is calculated as follows:
![]()
This ratio measures the number of times the earnings of the latest year at which the share price of a company is quoted. It signifies the number of years in which the earnings can equal the current market price. This ratio reflects the market’s assessment of the future earnings potential of the company. A high P/E ratio reflects earnings potential and a low P/E ratio low earnings potential. The P/E ratio reflects the market’s confidence in the company’s equity.
Earnings Per Share:
ADVERTISEMENTS:
EPS provides a very strong basis for fundamental and bottom line analysis.
EPS is calculated as follows:
![]()
EPS denotes the post-tax profit per equity share. A slight variation in EPS is available in cash earnings per share (CEPS) wherein noncash expenditure like depreciation is added back to the earnings after tax for final computation. A change in EPS with corresponding change in sales volume provides a good measure about the responsiveness of the company’s profit position vis-a-vis market fluctuations.
Book Value:
Book value indicates the net worth per equity share calculated as follows:
![]()
The book value is a reflection of the past earnings and the distribution policy of the company. A high book value indicates that a company has huge reserves and is a potential bonus candidate. A low book value signifies a liberal distribution policy of bonus and dividends, or alternatively, a poor track record of profitability.
Debt Equity Ratio:
This ratio indicates the relationship between loan funds and net worth of the company, which is known as ‘gearing’. If the proportion of debt to equity is low, a company is said to be low-geared, and vice-versa.
![]()
A debt-equity ratio of 2: 1 is the norm accepted by financial institutions for financing of projects. Higher debt-equity ratio may be permitted for highly capital intensive industries like petrochemicals, fertilizers, power etc. The higher the gearing, the more volatile the return to the shareholders.
Dividend Payout:
ADVERTISEMENTS:
Ratio Dividend payout indicates the extent of the net profits distributed to the shareholders as dividend.
![]()
A high payout signifies a liberal distribution policy and a low payout reflects conservative distribution policy.
Dividend Yield:
This ratio reflects the percentage yield that an investor receives on his investment at the current market price of the shares.
![]()
This measure is useful for investors who are interested in yield per share rather than capital appreciation.
ADVERTISEMENTS:
Dividend Cover:
This ratio indicates the number of times, the dividends are covered by net profit. This highlights the amount retained by a company for financing of future operations.
![]()
Interest Cover:
The interest coverage ratio shows how many times interest charges are covered by funds that are available for payment of interest.
![]()
An interest cover of 2:1 is considered reasonable by financial institutions. A very high ratio indicates that the firm is conservative in using debt and a very low ratio indicates excessive use of debt.
Qualitative Analysis:
The qualitative fundamentals involve the nature of industry, investment environment, factors relating to specific industry, competitiveness, quality management, corporate governance etc.
The qualitative factors that affect the fundamentals and earning capacity value of the company are discussed briefly as follows:
Macro-Economic Analysis:
i. Money supply.
ii. Industrial production.
iii. Capacity utilization.
iv. Unemployment.
v. Inflation.
vi. Growth in GDP.
vii. Institutional lending.
viii. Stock prices.
ix. Monsoons.
x. Productivity of factors of production.
xi. Fiscal deficit.
xii. Credit/Deposit ratio.
xiii. Stock of food grains and essential commodities.
xiv. Industrial wages.
xv. Foreign trade and Balance of payments position.
xvi. Status of Political and economic stability.
xvii. Industrial wages.
xviii. Technological Innovations.
xix. Infrastructure facilities.
xx. Economic and industrial policies of the government.
xxi. Debt recovery and loans outstanding.
xxii. Interest rates.
xxiii. Cost of living index.
xxiv. Foreign investments.
xxv. Trends in capital market.
xxvi. Stage of the business cycle.
xxvii. Foreign exchange reserves.
Industry Analysis:
i. Post sales and earnings performance.
ii. Governments attitude towards industry.
iii. Labour conditions.
iv. Competitive conditions.
v. Performance of the industry.
vi. Industry share prices relative to industry earnings.
vii. Stage of the industry life cycle.
viii. Industry trade cycle.
ix. Inventories buildup in the industry.
x. Investors preference over the industry.
xi. Technological innovations.
xii. Return on capital employed.
xiii. Critical cost component.
xiv. Availability of skilled manpower.
xv. Constant innovation.
xvi. Supply side constraints.
xvii. Commoditized products.
xviii. Regulatory constraints.
xix. Growing domestic demand.
xx. Expanding export market.
xxi. Macro trends.
c. Other Aspects:
1. Competitive Advantage:
The competitive advantage for an organization means discovering the needs of the customers and then satisfying them by having a technological development in competitive environment.
2. Competitive Position:
The competitive position is the basic determinant of future profits and of the business value. Knowledge of relative costs and market share of important players in the industry is an important aspect of the company’s competitive position. The evaluation of enterprise’s comparative advantages or value added, relative to competitive firms is the major determinant of the company’s worth.
3. Corporate Governance:
The policy of corporate governance adopted in an enterprise stipulates parameters of accountability, control and reporting functions of the Board of Directors. It is concerned with the establishment of a system whereby the directors are entrusted with responsibilities and duties in relation to the direction of corporate affairs.
4. Company’s Intangibles:
The fundamental analysis takes into consideration the various intangibles of the company like brand image, cost advantage, technological development, investor friendly policies, human resource development and loyalty etc. which play a strong influence on the value of stock price of the company.
5. Efficiency of Management:
The capability and efficiency of the management who are in the control of affairs of the company will have a vital impact on the share price, since the management decision will make the company to get killed or win in the competitive business situations.
6. Timely Information and Transparency:
The timeliness and transparency in the information provided by the company help in deciding the security of the company in establishing a relation with its stakeholders.
7. Structure of the Board of Directors:
The balanced structure of the board of directors which represents, finance, accounting, technical, human resources, marketing, production, special advisors will win the confidence of the investing public.
Term Paper # 4. Meaning of Technical Analysis:
The underlying assumption of technical analysis is that the price of a stock depends on supply and demand in the market place.
It has little co-relation with its intrinsic value.
All financial data and market information of a given stock is already reflected in its market price.
As such, charts are drawn to identify price movement pattern to predict future movement of the stock.
The technical analyst will use the following approaches in analysis of securities.
Assumptions of Technical Analysis:
The basic assumptions of the technical approach is as follows:
1. Market value is determined solely by the interaction of supply and demand.
2. Supply and demand are governed by numerous factors, both rational and irrational. Included in these factors are those relied upon by the fundamentalist, as well as opinions, moods, guesses, and blind necessities. The market weighs all of these factors continually and automatically.
3. Disregarding minor fluctuations in the market, security prices tend to move in trends which persist for an appreciable length of time.
4. Changes in trend are caused by the shifts in supply and demand relationships. These shifts, no matter why they occur, can be detected sooner or later in the action of the market itself.
Technical Analysis and Fundamental Analysis:
Distinction:
1. Technical analysts try to predict short-term price movements. Fundamental analysts try to establish long-term values.
2. The focus of technical analysis is mainly on internal market data, particularly price and volume data. The focus of fundamental analysis is on the factors relating to economy, industry and the company.
3. Speculators, who want to make quick money, mostly use results of technical analysis. Investors, who invest on long-term basis, use the results of fundamental analysis.
Term Paper # 5. Theories for Studying Stock Behaviour:
1. Dow Theory:
The theory advocates that stock price behaviour is 90% psychological and 10% logical. It is the mood of the crowd which determines the way in which prices move and the move can be gauged by analyzing the price movement and volume of transactions.
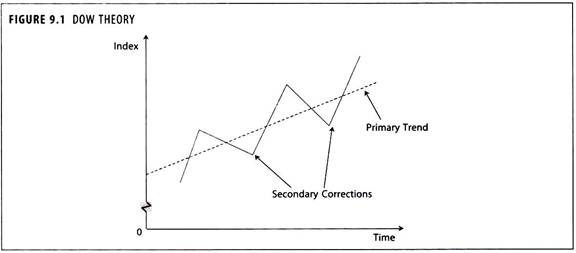
Figure 9.1 gives an example of a bull market trend. A bear market would be identified by exactly opposite trends. Dow used two indices, the ‘Dow Jones Industrial Average’ started in 1884 and the Transportation Index, mostly railway company shares. Similar trends in both indices had to be noted before a bull or bear market could be confirmed.
2. Basic Tenets of the Dow Theory (DT):
The averages (index numbers) discount everything except ‘acts of god’ because they reflect the combined market activities of thousands of investors and traders.
The ‘market’ meaning the price of shares in general, swings in trends which may be major or primary, secondary and minor. The primary trends are the extensive up or down movements which generally last by 20% or more. Movements in the direction of the primary trend are interrupted at intervals by secondary swings in the opposite direction. Finally, the secondary trends are composed of minor trends or day-to-day fluctuations which are unimportant.
So long as each successive rally or price advance reaches a higher level than the one before it, and each secondary reaction, or price decline, stops at a higher level than the previous one, the primary trend is up. This is called a ‘bull market’.
When each intermediate decline carries prices to successively lower levels and each intervening rally fails to bring them back up to the top level of the preceding rally, the primary trend is down and that is called ‘bear market’.
The secondary trends are the intermediate declines or ‘corrections’ which occur in bull market and the intermediate rallies or recoveries which occur in bear markets. Normally, they last from three weeks to as many months and generally retrace from one-third to two-thirds of the gain or loss in prices recorded in the previous swing in the primary direction.
The minor trends are the brief fluctuations lasting usually for six days but rarely for three weeks. These, so far as the DT is concerned, are meaningless in themselves but go to make up the secondary or intermediate trend. In theory at least this is the only trend that can be manipulated.
At times a ‘line’ can substitute for the secondary trend. A line in DT parlance is a sidewise movement which lasts for two or three weeks, may be for as many months, and in the course of its formation, prices fluctuate within a range of 5% or less of their mean figures.
A trend should be assumed to continue in effect until such time as its reversal has been definitely signalled.
Dow Theory’s Defects – First, the DT provides a signal of change in the trend, often too late. The end of a bull market is signalled only when the nearest intermediate bottom is penetrated by more than 3 per cent of the level and the subsequent rally fails to carry prices or the index above the earlier top.
The second defect is that the DT is not infallible. It depends on interpretation and is subject to all the hazards of human interpretative ability. It is also criticized for leaving the analyst in doubt.
3. Fisher Black’s Noise Theory:
According to this theory the market prices of stocks differ from intrinsic values due to the existence of noise.
Noise implies distorted, incorrect and incomplete information existing in inefficient markets.
This may also include the non-uniformity of information across the various market participants.
As the prevalence of noise in Indian markets is quite high, the market values of stocks differ from values that would arise from the fundamental analysis carried out by investment bankers and financial analysts.
Term Paper # 6. Random Walk Hypothesis:
It is generally believed that stock market price can never be predicted because they are not a result of any underlying factors but are mere statistical ups and downs.
Successive peaks and troughs in prices are unconnected.
In simple terms, the stock price movement behave like a walking of drunker in a blind lane – up and down with an unsteady gait going in any direction he likes, bending backward and forward, going on sides now and then.
The random walk hypothesis (RWH) states that the behaviour of stock-market prices is unpredictable and that there is no relationship between the present price of a share and its future price.
In short, stock market has no memory.
The term ‘random walk’ in this context, is used to refer to successive price changes which are independent of each other.
In other words, tomorrow’s price change cannot be predicted by looking at today’s price change. There are no trends in price changes.
The random walk theory was also tested on company share prices and it appear to fall a random walk.
The random walk proponents do not provide an adequate explanation of share price behaviour as the hypothesis is exclusively concerned with changes in prices rather than with their levels.
According to the proponents of the proposition the price of a share at any point of time consists of a permanent component and transitory component.
The RWH does not attempt to explain this kind of long-term movement in share prices.
It concerns itself with the transitory component representing the various psychological forces – bearish or bullish tendencies that are constantly at work in the markets.
Term Paper # 7. Efficient Market Hypothesis:
The EMH is a theory that capital markets operate to a high degree of perfection. Its roots lie in the random walk hypothesis, which postulates the share price changes are of a random, rather than correlated, nature.
The EMH put-forth the argument that, since the market efficiently prices all the stocks on an ongoing basis, any opportunities for excess returns derived from fundamental or technical analysis will be almost immediately used away by the market participants.
The EMH theorists assume that efficient capital markets exist – markets with a large number of rational investors and speculators who are trying to maximize profits by predicting future earnings, dividends, and value of shares.
Here, it is assumed, information is known freely to all investors, spontaneously transmitted to the markets to establish share prices.
The price established tends to be fair price.
As the market is efficient, the adjustment processes tend to allow prices to vary randomly around the competitive norms. As new information is learnt, prices move, and because of the adjustment process, the movement will be up and down depending upon the stimulus. As investors or speculators over react the adjustment process becomes random in character.
Whenever any new event occurs, it too is transmitted to a market place that has no memory – one where each price is independent of the previous one. This theory suggests that chartists are wrong.
Forms of Stock Efficiency:
Fama (1970) decided to define markets in terms of their levels of efficiency, where the level reflected the types or scope of information which was quickly and fully reflected in price.
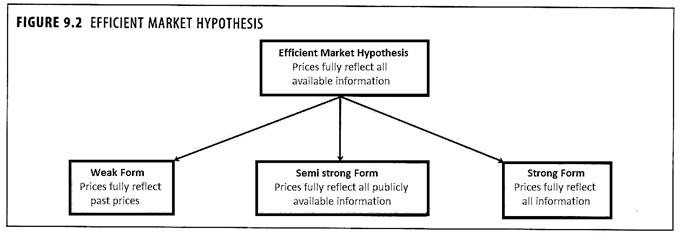
Weak Form:
In the weak form of efficiency, each share price is assumed to reflect fully the information content of all past share prices.
Semi-Strong Form:
In the semi-strong form, the information impounded is assumed to include not only that given by all past share prices which are of course public knowledge, but all publicly available information relevant to the share value. This includes, for example, company announcements, brokers reports, industry forecasts and company accounts.
Strong Form:
The strong form of the EMH requires all known information to be impounded in the current share price, whether publicly and generally available or not. The strong form will thus include what is known as ‘insider’ information, for example details of an impending takeover bid known only to senior management of both parties to the bid.
Characteristics of Efficient Market:
1. Timely and accurate information on the price and volume of past transactions and on prevailing supply and demand.
2. Liquidity, meaning an asset can be sold or bought quickly at a price close to the price of the previous transaction assuming no new information has been received.
3. Low transaction cost, meaning that all aspects of the transaction entail low costs, including the cost of reaching the market, the actual brokerage cost involved in the transaction and the cost of transferring the security.
4. Quick adjustment of prices of securities to the new information.
Assumptions of EMH:
The basic assumption is that in an efficient capital market, prices of traded securities always fully reflect all publicly available information concerning the securities.
For market efficiency there are three conditions:
1. All available information is costless to all market participant’s;
2. There is no transaction costs; and
3. All investors take similar views on the implications of available information for current prices and distribution of future prices of each security.
Term Paper # 8. Importance of Stock Market Index:
1. Since the prices of most securities tend to travel up and down together, indices are used to reflect the overall movement of stock prices.
2. A stock index sample is normally generated by a non-random selection technique designed to incorporate specific characteristics.
3. The criterion for selection is basically adequate representation of various industrial groups and market capitalization. The larger the number of scrips in the index, the higher will be the correlation coefficient of the index to the portfolio of the investor.
4. An Index is a number used to represent the changes in a set of values between a base time period and another time period.
5. Stock index represents change in the value of a set of stocks, which constitute the index, over a base year. Any index is an average of its constituents.
6. A market Index is very important because of the following reasons:
(i) It acts as a barometer for market behaviour.
(ii) It is used to benchmark portfolio performance.
(iii) It is used in derivative instruments like Index futures.
(iv) It can be used for passive fund management as in case of index funds.
7. The stock market index captures the behaviour of the overall market.
8. The ups and downs of an index reflect the changing expectations of the stock market about future dividends of corporate sector.
9. When the index goes up, it is because the stock market thinks that the prospective returns in the future will be better than previously thought.
10. When prospects of dividends in the future become pessimistic, the index drops.
Term Paper # 9. BSE Sensex:
Stock Market Indices:
i. BSE Sensex:
The BSE Sensex, first compiled in 1986, was calculated on the ‘market capitalization-weighted’ methodology of 30 component stocks representing large, well established and financially sound companies across key sectors. The base year of Sensex was taken as 1978 -79 with a base index value of 100 Sensex today is widely reported in both domestic and international markets through print as well as electronic media. It is scientifically designed and is based on globally accepted construction and review methodology. Since September 1,2003, Sensex is being calculated on a free-float market capitalization methodology. The index calculation frequency is every 15 seconds.
ii. S & P CNX Nifty:
It is well diversified 50 stock index accounting for 23 sectors of the economy. The total traded value of all Nifty stocks is approximately 70% of the traded value of all stocks on the NSE. Nifty stocks represent about 59% of the total market capitalization.
Scrip Selection Criteria in BSE Sensex:
The guidelines for selection of constituents in Sensex are as follows:
1. Listing History:
The scrip should have a listing history of at least 3 months at BSE. Exception may be considered if full market capitalization of a newly listed company ranks among top 10 in the list of BSE universe. In case, a company is listed on account of merger/demerger/amalgamation, minimum listing history would not be required.
2. Trading Frequency:
The scrip should have been traded on each and every trading day in the last 3 months at BSE. Exceptions can be made for extreme reasons like scrip suspension etc.
3. Final Rank:
The scrip should figure in the top 100 companies listed by final rank. The final rank is arrived at by assigning 75% weightage to the rank on the basis of three-month average full market capitalization and 25% weightage to the liquidity rank based on three-month average daily turnover and three-month average impact cost.
4. Market Capitalization Weightage:
The weightage of each scrip in Sensex based on three-month average free-float market capitalization should be at least 0.5% of the Index.
5. Industry/Sector Representation:
Scrip selection would generally take into account a balanced representation of the listed companies in the universe of BSE.
6. Track Record:
In the opinion of the BSE Index Committee, the company should have an acceptable track record.
Calculation of Closing Price of BSE Sensex:
The closing price is computed on the basis of official closing prices of the component stocks of Sensex in accordance with a specific algorithm and such computation is done at the end of ‘continuous trading session’.
The algorithm to calculate the closing price of Sensex is as follows:
1. If 20 market lots have been traded during last 15 minutes of trades, the weighted average price of the last 20 market lots would be considered.
2. If 20 market lots have not been traded, but at least 10 trades have taken place during the last 15 minutes of trade, the weighted average price of the last 10 trades would be considered.
3. If 10 trades have not taken place during last 15 minutes, but have taken place during the last 30 minutes, the weighted average price of such last 10 trades would be considered.
4. If 10 trades have not taken place during the last 30 minutes, but some trades below 10 (i.e. 1 to 9) have taken place during this hour, the weighted average price of all the trades in the last 30 minutes would be considered.
5. If no trades has taken place during the last 30 minutes, the last traded price of the day would be taken as the official closing price of Sensex.
6. The price, calculated as above, would be rounded off to the nearest tick.
In BSE, the day-to-day maintenance of Sensex and other indices is done by an Index Committee of the Exchange, which consists of representatives from financial institutions, FIIs, academicians, financial analysts and representatives of user groups. During market hours, price of index scrips, at which trades are executed, are automatically used by the trading computer to calculate the Sensex every minute and continuously updated on all trading work stations connected to the BSE trading computer in real time. The opening, high and low prices of Sensex of each working day are also given by the trading computer. But the closing prices of Sensex are calculated by using a specific formula.