‘Yield to maturity’ means the rate of return earned on security if it is held till maturity. This can be presented in a graph called ‘yield to maturity curve’ which represents the interest rates and the maturity of a security. The term structure of interest rates refers to the way in which the yield on a security varies according to the term of borrowing that is the length of time until debt will be repaid as shown by the ‘yield curve’.
In figure 2.1 yield is measured on the vertical axis and term to maturity is on the horizontal axis. Often the yield curve is upward sloping i.e., short-term securities yield less than long-term securities (curve A). Sometimes it is rather flat, short-term yields equal long-term yields (curve B). And sometimes the yield curve is even downward sloping, short-term interest rates are above long- term rates (curve C).

Normally, the longer the term of an asset to maturity, the higher the rate of interest paid on the asset.
ADVERTISEMENTS:
In the normal situation, YTM curve is upward sloping for the following reasons:
I. The risk is more in holding securities for a longer period than short period. This is due to conditions of business which cannot be predicted with accuracy and hence the investors holding long-term securities prefer to be compensated for the additional risk than on short-term securities.
II. In the long-term securities the funds of the investors are tied up for long periods and for this the investors naturally expects for higher return than the short-term securities.
ADVERTISEMENTS:
The basic expectations theory maintains that the shape of the yield curve is determined by investors’ expectations of future short-term interest rates. In particular, if short-term rates are expected to rise, the yield curve will be upward sloping, while if short-term rates are expected to fall, the yield curve will be downward sloping. A specific result is that long-term rates are averages of current and expected future short-term rates.

The relationship between maturity and yields is also known as the ‘term structure of interest rates’ and yield curve is represented as follows:
I. Yield curves have an upward slope when long maturity bonds have higher interest rates than short maturity bonds.
II. Yield curves have a downward slope when short maturity bonds have higher interest rates.
ADVERTISEMENTS:
Problem:
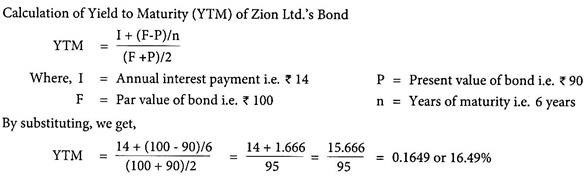
The price per bond of Zion Ltd. is Rs.90. The bond has a par value of Rs.100, a coupon rate of 14%, and a maturity period of 6 years. What is the yield to maturity?
Solution: