Smoothing of the load or resources of a network implies scheduling the activities within the limits of their total floats such that fluctuations in load or resource requirements are minimized.
In other words peaks and valleys in the load chart are leveled in order to keep constant and stable optimum work force throughout the project duration; because keeping of unnecessary large work force means extra cost and dismissing the workers under off peak times brings a bad name to the concern. Moreover, there is no guarantee that again during peak season the same or better (experienced) workers will be available.
Smoothing affixes actual dates to the activities, reallocates the resources between them and actually improves the utilisation of resources. Of course there is a constraint in case of resource smoothing and that is the total project duration, within which everything has to be managed.
The smoothing technique makes use of floats in different activities. The activities are adjusted within the period equal to their duration plus float (D + F). In other words an activity having float may be started at any time within this period and finished within the same period. The activity can be taken during the earlier, middle or later part of the (D + F) band of period. Various activities can be scattered so that no high peaks or low valleys are formed in the manpower (worker) loading chart.
ADVERTISEMENTS:
Smoothing manually by juggling with available float of each activity may be alright for small projects, but large and complex projects definitely demand the use of a computer.
The Heuristic approach to smoothing is simply the testing of various arrangements to achieve the acceptable solution. Smoothing is very essential in the project were overloading and under-loading is not easy to avoid.
Example:
ADVERTISEMENTS:
Figure 10.13 shows an arrow diagram, with activity duration and number of workers required to complete each activity being marked (on all activities).
Solution:
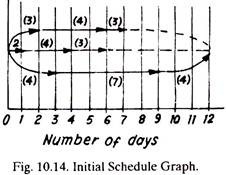
Figure 10.14 shows the initial schedule graph in which various activities have been placed with the number of workers written on them.
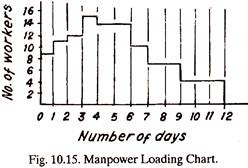
Figure 10.15 shows the manpower loading chart or work load distribution chart framed from the data of Fig. 10.14. This chart shows that the minimum number of workers required on any day are 4 and the maximum work force size is 15. There is a large variation in the day-to-day load distribution.
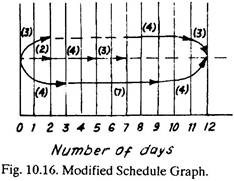
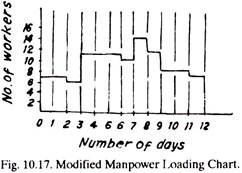
Figure 10.16 shows the modified schedule graph in which activities 2-5 and 5-8 have been shifted to extreme right-hand side and activities 1-3, 3-6 and 6-8 (Fig. 10.13) have been displaced from extreme left towards the middle of the graph. Activities 1-4, 4-7 and 7-8 have no float and hence they cannot be shifted. Modified manpower loading chart (Fig. 10.17) is an outcome of the modified schedule graph and shows better smoothing as compared to Fig. 10.15. The variation in the work force is only 7 (i.e., 14-7) against 11 (i.e., 15-4) in case of initial manpower loading chart (Fig. 10.15).
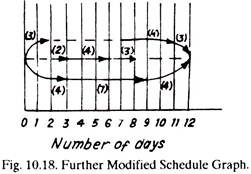
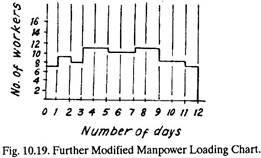
Fig. 10.16 is further modified to Fig. 10.18 by resifting the activities 1-3, 3-6 and 6-8 and Fig. 10.19 shows the further modified manpower loading chart which gives, workforce variation of only 4 (i.e., 11-7) and hence still better smoothing of the work load.
The ideal manpower loading chart is one shown in Fig. 10.20 which perhaps can rarely be achieved in normal industrial practice. But, it should always be the aim to approach to reach this ideal manpower loading chart. It shows a perfectly constant workforce throughout the duration.

