
A network designed during planning may not adhere to the schedule when put to work, because situations are sometimes keep on changing and during actual execution they are different than that assumed at the stage of planning.
Following are few reasons for not following the designed schedule exactly:
(i) Error in estimation during planning. Planner’s under or over estimation is mainly responsible for not adhering to the schedule.
(ii) Unforeseen circumstances, like delay in availability of resources as planned, break down in plant and machinery.
ADVERTISEMENTS:
(iii) National calamity etc.
It has been observed that, inspite of best efforts, some activities need more time in completion, then originally planned, or some new activities crop up. To ensure that, scheduled time is maintained, it is necessary to review the progress of project and redraft the network according to latest requirements. During redrafting scheduled dates are revised, but if it is not possible to delay the project, then activities on new critical path are accelerated by allocating extra resources, in order to adhere to committed date.
The process of reviewing the progress of the project execution is known as “updating”.
On updating a network, a new critical path may appear because of reduction in slack time of some of the earlier calculated non-critical activities, which may lead to new project priorities. Depending upon the likely adverse effect on the delivery schedule, the project manager may now decide to accelerate the pace of work by inducting more resources and attempt to complete to project by the original schedule. This activity is known as ‘crashing’ a project.
ADVERTISEMENTS:
Updating helps in evaluating the present status of the project and assess the probability of completing the project in due time. Updating enables to take corrective actions in time and take managerial decisions in problem areas. The updating must regularly be done.
Example 1:
Network shown below indicates time in weeks required for completion of each activity.

The network was reviewed after 8 weeks and found that activities have progressed as under:

Solution:
To know the exact progress of the activities, a revised network is drawn, indicating remaining required time as on the date of review, i.e., after 8 weeks.

If we indicate all the completed activities by one arrow called “elapsed time arrow” showing already consumed time and has new event number.
ADVERTISEMENTS:
This means the project shall be delayed by one week. If it is necessary to adhere to schedule even at the cost of extra expenditure, then crashing is desired to be done to follow the earlier scheduled time. Therefore, in order to crash the network one week must be taken off from the activities on the critical path having lowest cost-slope.
Example 2:
Determine the critical path in the following activities of a project.

Also indicate the slack periods and slack paths, when the project is to be completed in 54 days. The earliest time of each activity has been indicated on arrow.
Solution:
Network for activities, given in the problem is drawn as below, and Earliest Expected time (TE) and the latest allowable time (Ts – TL) is also calculated for each event and indicated on the diagram 29.15.

Slack for each activity is indicated on the network diagram (Ts – TE) which indicates the path A C E H K M is a critical path because events on this path indicate minimum slack.i.e. (-) 4.
ADVERTISEMENTS:
Example 3:
For a project, following information is given:
(a) Draw project network,
ADVERTISEMENTS:
(b) Calculate length and variance of critical path, and
(c) With what probability, the critical path calculated in (b) will be achieved?

Solution:
Project network is drawn hereunder:

Average or expected time required for each activity is calculated as follows:
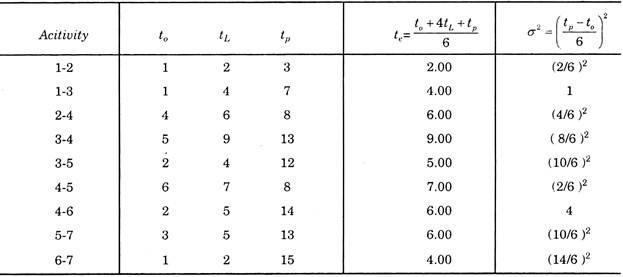
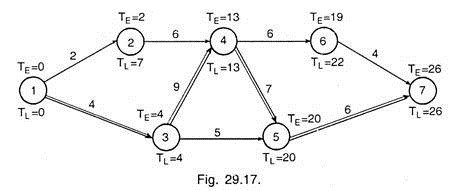
By knowing the values of te for each activity, we calculate the values TE and TL for each event and indicate it on the network drawn below.
From the Value of TE and TL, It is seen that critical Path in network is 1-3-4-5-7 and length of the project is 26 days.
Variance along the critical path = ∑σ2
= 1 + (8/6)2 + (2/6)2 + (10/6)2 = 36 + 64 + 4 + 100/36 = 204/36 = 5.66 Ans.
... Standard deviation, σ = 2.38
ADVERTISEMENTS:
As we know that,
Normal Deviation = Scheduled time – TE/σ = 26 – 26/2.38 = 0.00
Therefore, probability of meeting the schedule = 50%. Ans.
Example 4:
Construct an activity network for a production schedule with the following characteristics:

Calculate TE, TL and slack time for each activity and indicate critical path.
Solution:
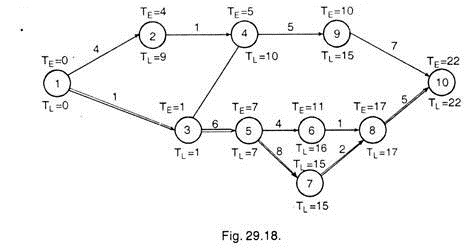
From the given data, a network is drawn here under:
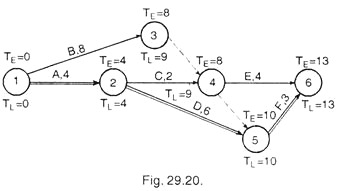
The values of TE and TL are calculated and indicated on each event as shown in the network. The activities joining the events having minimum slack form the critical path indicated by double line. The critical path in the network is 1-3-5-7-8-10.
Example 5:
ADVERTISEMENTS:
Data regarding the activities in a project are given below:

(a) Draw the project network.
(b) Using normal duration, determine the critical path and the project duration,
(c) If there is a saving of 2 units of money for every day saved in the project duration find the optimal schedule.
Solution:
ADVERTISEMENTS:
Network is drawn by using the given data.
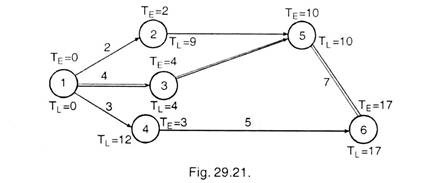
From the values TE and TL indicated on the above network, we see that critical path is 1-2-5-6 i.e., A-D-F and the project duration is 15 days.
As we know that optimum duration is achieved by crashing those activities which has cost slopes less than indirect expenditure per day.
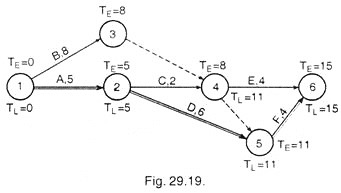
To crash the project, first of all crashing is done on the activity having least cost slope on the critical path. Therefore, first we should crash activity A and F by one day each. The network is again drawn crashing these activities A and F.
Still the critical path remains same, i.e. ADF. In II stage, only activity D is left on critical path which can be crashed. But, since by crashing this activity, the cost increases by 3 units whereas saving is only 2 units from indirect expenses, hence further crashing is not economical. Therefore, optimal schedule is 13 days.
Example 6:
A small project is composed of seven activities as given below:
(a) Draw project network.
(b) Find the expected duration and variance of all activities.
(c) What is expected project length.
(d) Calculate the variance of project duration.
(e) What is the probability that project will be completed at least 3 weeks earlier than expected?

Solution:
From the given data we can calculate the value of expected time (te) required and variance (σ2) of each activity as shown in the table below:

Now by using the value of expected time (te), we can draw the network as below and indicate the TE and TL on each event.
By knowing the values of TE and TL, we see that critical path is 1-3-5-6 i.e., the path having minimum slack, and the expected project length is 17 weeks, slacks on all the activities are given below:

To calculate probability, we first calculate variance along critical path,
∑σ2 along critical path = 1 + 4 + 4 = 9
... Standard deviation, sigma = 3
Normal deviation = Scheduled time — Expected time/σ = -3/3 = -1
Hence the probability that project will be completed 3 weeks earlier than expected is 15.9%. (As we know that probability at -1 normal deviate is 15.9%). Ans.
Example 7:
A small maintenance project consisting of jobs given in the table below. With each job normal time and crash time are given in days.
The cost of crashing a job in rupees per day is also given:
(a) What are the normal length and the minimum project length?
(b) Determine the minimum crashing cost schedule from normal length, by each one day for 7 days.

(c) If overhead costs total Rs. 60/day, what is the optimal length schedule in terms of both crashing and overhead costs?
Solution:
Network with given values of normal duration is drawn hereunder:
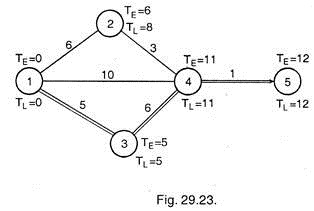
Now the network is again drawn with crash duration of each activity
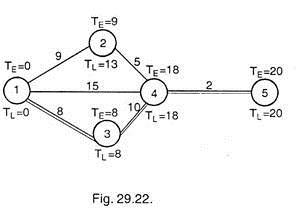
By drawing the project network, we have calculated that expected time with normal duration is 20 days Fig. 29.22, whereas it is 12 days with crash duration as shown in Fig. 29.23. (Can also be termed as minimum project length).
Now we crash the project starting from that with normal duration.
Crashing by One day (Fig. 29.24):
With normal, critical path is 1-3-4-5 and the least expensive activity to crash on critical path is 3-4. It is crashed from 10 days to 9 days at a cost of Rs. 15. The new network shall be as shown in 29.24.

Crashing by Second Day (Fig. 29.25):
Again the critical path is same and the activity 3-4 is crashed again by one day at a cost of Rs. 15.

Crashing by Third Day (Fig. 29.26):
Still critical path is same and activity 3—4 is crashed by one more day at a cost of Rs. 15.

Crashing by Fourth Day (Fig. 29.27):
This time activities on the paths 1-4-5 and 1-3-4-5 both are critical. To reduce project duration by further one day, 2 alternatives are available (i) crash 3 -4 and 1-4 both by one day at a cost of Rs. 15 + 30 = Rs. 45. (ii) Crash 4-5 by one day at a cost of Rs. 40. Thus, crashing of activity 4-5 is economical and hence it is crashed by one day. This gives the network as shown in Fig. 29.27.

Crashing by Fifth Day (Fig. 29.28):
This time we have left with only one alternative, i.e. to reduce activities 1-4 and 3—4 both by one day at a cost of Rs. 45. The new network shall be as shown in Fig. 29.28.

Crashing by Sixth Day (Fig. 29.29):
After having crashed the activities 3—4 and 4—5 completely, all the paths became critical. Thus now to reduce duration by one day, activities 1-3, 1-4 and 2-4 all to be crashed by one day each (since crashing of activity 2—4 is less costly than that of 1—2, hence activity 2—4 is being crashed) at a cost of Rs. 25 + 30 + 10 = Rs. 65. The new network shall be as shown in Fig. 29.29.

Crashing by Seventh Day (Fig. 29.30):
Now these activities 1-3, 1-4 and 2-4 are again crashed by one day each at a cost of Rs. 65.
