Time aspect is the main and significant aspect in a network. Its primary object is to complete the project at an earliest to get quicker realisation of benefits of the project.
Activities on critical path and sub-critical path needs special attention either to complete the project as per schedule or to reduce the completion time. To reduce the scheduled time, non-critical activities can be considered as potential pools of resources for diverting to critical or near critical activities.
In some projects, it is desirable to cut down the total project time, even if it leads to increase in cost. It is generally desired where cost considerations are unimportant or less important than completing the project in absolute minimum time e.g., defence works in emergency.
Generally it is possible to reduce the project duration by changing the resources allocated to it. The increase or decrease of the project duration results in decrease or increase in the cost of the project. For this purpose, time and costs are analysed in a systematic way. This analysis also helps in determining optimum duration of the project.
ADVERTISEMENTS:
For studying the project time and cost analysis, we shall fast discuss about project costs and time-cost relationship.
Project Costs:
There are two types of costs associated with a project:
(i) Direct costs:
It represents the expenditure which can be allocated to different activities in a project, like manpower, material etc.
ADVERTISEMENTS:
(ii) Indirect costs:
It represents the expenditure on those items which are shared by more than one activity and cannot be directly allocated to individual activity of a project.
Indirect costs of a project are those expenditures which cannot be apportioned or clearly allocated to the individual activity. These include the expenditure related to the administration and establishment charges, overhead, supervision, loss of revenue etc.
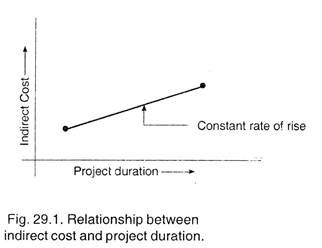
Indirect cost rises with increased duration. Relationship between indirect cost and project duration is shown in Fig. 29.1. This relationship would be represented by a straight line, with a slope equal to daily overhead.
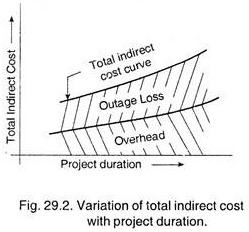
When there is a loss of profits due to inability to meet the demand or some penalty due to delay, a corresponding cost increase (known as outage loss), must be added to the cost of overheads, as shown in the Fig. 29.2.
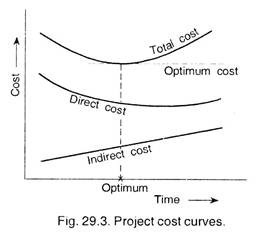
Total cost of a project is the sum of the direct and the indirect costs. These costs are plotted in Fig. 29.3.
With the help of above curves, we can determine optimum duration, which is also referred as target duration. If the critical path is equal or shorter than this optimum duration, there is no need to reduce the network, i.e., crashing the duration of any activity. If however, the critical path is longer than the project’s optimum duration, and then there is need to reduce the duration of some activities, so that the critical path is equal to the optimum duration.
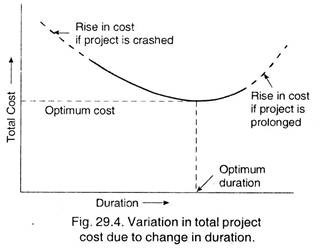
In order to understand the effect of duration on the total cost of the project, Fig. 29.4 is drawn.
These curves help the management to determine following aspects for taking future decisions about the project duration and resource allocation:
(а) Determining the project duration, for which the cost is least, i.e., optimum duration of the project at which the cost is optimum.
ADVERTISEMENTS:
(b) Determining the least cost of a reduction in project duration from a stipulated date. This is done when the stipulated date is earlier than the optimum time for the project.
(c) Determining the time-cost-risk relationship. In this, risk involved in eliminating any activity is calculated. This time-cost risk helps the management to take a decision about most economical solution, based on the circumstances and the objectives of a particular situation.
This shows that the network technique is an analytical tool for better planning, scheduling, monitoring and decision-making.
Crash Point and Normal Point:
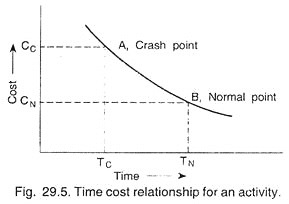
Fig. 29.5 shows variation in the cost of an activity with time. The figure also indicates that there is critical point in time beyond which it will become probably expensive to try to shorten the time schedule of an activity.
ADVERTISEMENTS:
It also indicates that lengthening of an activity more than a certain time duration results in negligible cost savings. First such point is “Crash Point” while second such point is known as “Normal Point”, as shown in the Fig. 29.5.
Cost Slope:
In actual practice, we assume the time-cost curve to be linear between crash point A and Normal point B. The curve has shown in Fig. 29.5 shows that, there is a change in cost for change in time. The term ‘cost-slope’ is defined as the “increase in the cost of the activity per unit decrease in the time”.
Mathematically, we can say,
ADVERTISEMENTS:
Cost slope = Crash cost – Normal cost/Normal time – Crash time
In simple words, we can say that cost slope of an activity is the increase in cost of an activity by reducing the duration by one unit.
Conducting a crash programme usually result in an increase in cost of those activities that are constructed under the crash programme. In order to keep the total increase in cost to a minimum, it is necessary to crash those activities which permit reduction in construction time at the least total increase in cost. The reduction in time for a project can be achieved by reducing the duration of one or more activities lying on the critical path.
Crashing Procedure:
The cost slope concept helps in finding lowest cost solution by sequential compressing the activities having lowest cost slope, i.e., having lowest incremental cost, on critical path.
Sometimes by crashing one activity, critical path is shifted; therefore, at each shift of the critical path, it will be necessary to calculate the cost-slopes of the activities on new critical path. Then the activity having the lowest cost slope needs to be compressed on this new critical path. This process is repeated until the project crash point is reached.
Procedure for crashing a project is explained hereunder:
ADVERTISEMENTS:
(i) The ratio of increase in cost to decrease in time for each activity that can be crashed on the critical path is calculated and compared.
(ii) The activity having the lowest ratio is reduced to the next lower time value.
(iii) The critical path for the network is again calculated using the new time for the crashed activity.
(iv) Repeat step (ii) and (iii) until the critical path is equal to optimum project duration or equal to prescribed project duration.
Example 1:
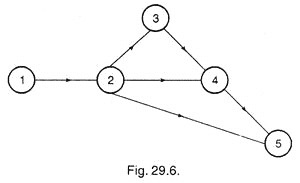
For a network shown in Fig. 29.6, Normal time, Crash time, Normal cost and Crash costs are given in the table. Contract the network by crashing it to optimum value and calculate the optimum project cost. Indirect cost is given as Rs. 100 per day.
Solution:
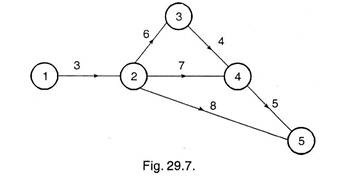
By drawing the network with normal duration, we see (from following figure) that critical path is 1-2-3-4-5.
The project duration is, therefore, equal to 18 days. On this path, Crash time = 13 days (from given data on critical path).
Normal cost and crash cost can now be calculated by adding values of all the activities, given in the table.
Normal cost = Rs. 4100 and Crash cost = Rs. 4900.
ADVERTISEMENTS:
To construct the network, in first stage we should identify those activities on critical paths, which have cost-slopes less than the indirect cost. For this purpose cost slopes are calculated hereunder
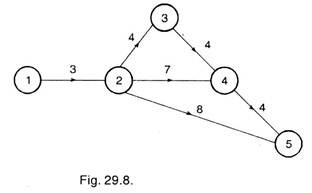
Critical path activities 2-3 and 4-5 have least cost slopes. Therefore, these activities are first crashed and network is again drawn (Refer Fig. 29.8).
This network shows that, after crashing activities 2-3 by 2 days and 4-5 by 1 day, the critical path is same, i.e. 1-2-3-4-5 and have 15 days duration.
ADVERTISEMENTS:
Now in second stage, the least cost slope in remaining activities is for activity 3-4 on the critical path.
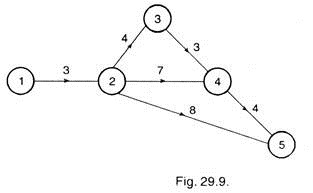
By crashing this activity, we see that two paths become critical path, 1-2-3-4-5 and 1-2-4-5 as shown in Fig. 29.9 below:
Now we see that after crashing activities 2-3, 4-5 and 3-4, there is no other activity on both the critical paths which have cost slopes less than indirect cost. This shows that this is the optimum network and hence optimum project duration is 14 days.
Total direct project cost for this optimum duration
= Direct cost for all activities on the network
ADVERTISEMENTS:
= Cost on activities 1-2; – 2-3; 2-4; 2-5; 3-4; 4-5
= 300 + 520 + 2100 + 400 + 360 + 520 = Rs. 4200.
And indirect cost for 14 days @ Rs. 100 per day = Rs. 1400
Total project cost after crashing = 4200 + 1400 = 5600.
Whereas total cost with all normal activities was (i.e. without crashing)
= Normal cost + Indirect for 18 days = 4100 + 1800
= Rs. 5900.
Thus the optimum cost of the project is Rs. 5600. By crashing to optimum value, we could save Rs. 300. If we further crash the project beyond optimum value, the project shall become costlier.
