This article throws light upon the four most commonly calculated ratios. The ratios are: 1. Liquidity Ratios 2. Asset-Management Ratios 3. Debt Ratios 4. Profitability Ratios.
Type # 1. Liquidity Ratios:
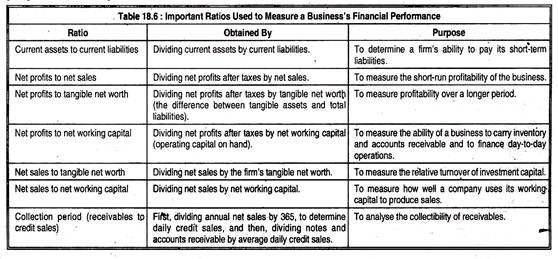
Several liquidity ratios are used to learn how liquid (easily converted into cash) an organisation’s assets are. These ratios measure the ability of the organisation to raise enough cash in a short period of time to meet its short-term needs. The most common liquidity ratio is the current ratio. It is calculated by dividing current assets by current liabilities.
Suppose a company has Rs.1,000,000 of current assets and Rs.500,000 of current liabilities. Its current ratio is 2 to 1. In other words, its current assets are two times its current liabilities. The current ratio indicate how many rupees of liquid assets are available for each rupee of current liability. Creditors consider the current ratio a good index of an organisation’s ability to pay its bills on time.
Type # 2. Asset-Management Ratios:
These ratios measure how well a firm uses its assets. For example, suppose a company’s total sales amount to Rs. 300,000 but its total assets are Rs. 200,000. Therefore, its total asset-utilisation ratio is 1.5 which is bad.
Type # 3. Debt Ratios:
ADVERTISEMENTS:
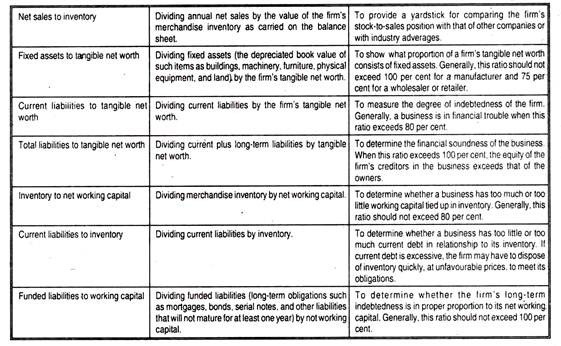
Debt ratios reflect ability to meet long-term financial obligations. The most commonly used debt ratio is total liabilities divided by total assets. These ratios are calculated to see if an organisation can meet its long-term obligations such as bonds, mortgages, and notes payable.
An example is total debt divided by net worth. If the total debt of a business is Rs. 600,000 and the net worth Rs. 1,200,000, the firm’s assets are financed by 50% debt. If the industry average is 60%, there is hardly any problem of borrowing long-term capital.
But if the industry average is 40%, the opportunities for borrowing are limited because a high proportion of debt reduces the creditworthiness of the company. The higher this ratio, the smaller (poorer) credit risk the company is perceived to be.
Type # 4. Profitability Ratios:
This category of ratios measures management’s overall performance as shown by profits on sales and investments. Such ratios are designed to put the profit picture into perspective from several points. Profits on total sales are arrived at by dividing net profits after taxes by net sales; profitability of the owner’s investment is calculated by dividing net profits after taxes by tangible net worth.
ADVERTISEMENTS:
Profits on net sales = Rs. 40,000/Rs. 10,00,000= 4%
To make the ratio really meaningful it has to be compared with past performance or that of other firms belonging to the same industry.
Table 18.6 gives description of the most frequently used ratios, how they are arrived at, and what purpose(s) do they serve.

