Several common methods used for evaluating proposals for capital expenditures and for comparing and selecting alternative machines or equipment involving capital assets are discussed:- 1. Total life average method, 2. Annual cost method, 3. Present worth method, 4. Rate of return method, 5. MAPI method, and 6. Approximate MAPI solution.
1. Total Life Average Method:
Steps Involved:
(i) Add the initial cost of the machine and its operating expenses.
(ii) Divide this figure by the estimated life of the machine to arrive at the average annual cost.
ADVERTISEMENTS:
Example 1:
The following data are available for the existing equipment and for the proposed equipment to replace the existing one. Find whether the concern should go for replacement or not.
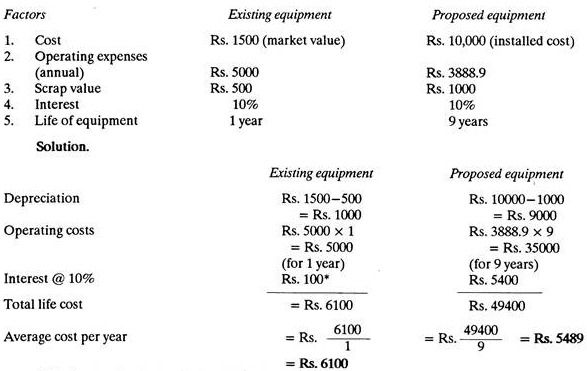
The interest has been calculated as follows:
ADVERTISEMENTS:
The existing equipment depreciates at the rate of Rs. 1000 per year, therefore, the interest is 1000 x 10/100 = Rs.100
Proposed equipment is costing Rs. 10000 and after 9 years its scrap value will be only Rs. 1000; therefore interest for first year will be Rs. 10000 x 10/100 = Rs. 1000, for second year 9000 x 10/100 = Rs. 900 for third year 8000 x 10/100- = Rs. 800 and so on; for 9 years it will be 1000 + 900 + 800 + 700 + 600 + 500 + 400 + 300 + 200 = Rs.5400.
Since average cost per year is less for the proposed equipment it is better to go for the replacement.
2. Annual Cost Method:
Annual cost method of evaluating alternatives compares the annual costs of obtaining service from different equipment.
ADVERTISEMENTS:
Annual Cost = Capital recovery + Operating Costs.
The annual cost of capital recovery (C.R.) is calculated as follows (for equal annual costs):
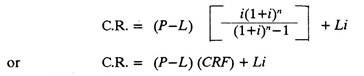
Where CRF is capital recovery factor
ADVERTISEMENTS:
(Refer Table 14.1).
P is first cost of equipment
n is life of equipment in years
L is salvage value at the end of life of equipment
ADVERTISEMENTS:
i is interest rate.

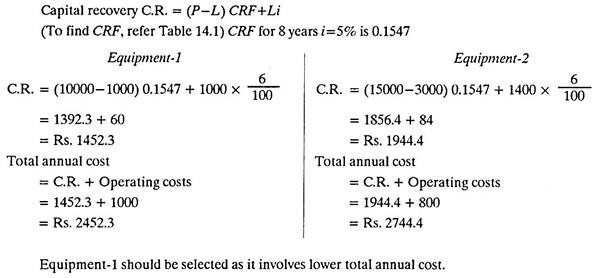
Example 2:
Given below is the data for two equipment. Find out which alternative you will select.
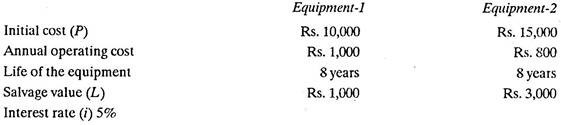
Solution:
Example 3:
For the data given below suggest whether to purchase the new machine or not.
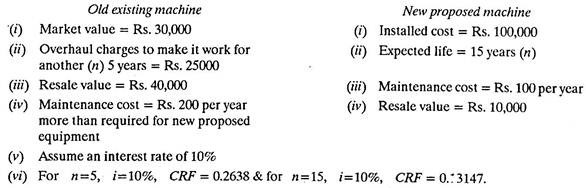
Solution:
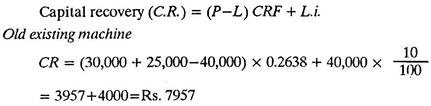
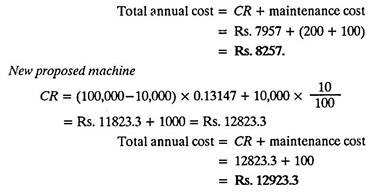
Since old existing machine involves lower total annual cost, the new proposed machine should not be purchased.
3. Present Worth Method:
This method of comparing alternatives consists of reducing all receipts and expenditures for each alternative equipment to a present worth basis. While using this method, one should make sure that equal services are being compared.
Example 4:
ADVERTISEMENTS:
Use the data given in example 14.3 and solve the problem by Present worth Method.
Solution:
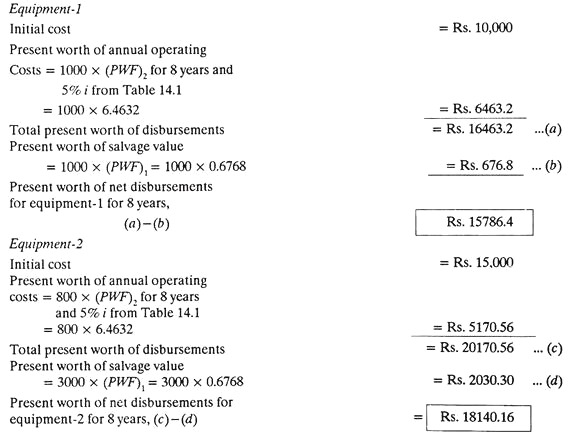
Since present worth of net disbursements for equipment-1 is lesser than that for equipment-2, it should be selected.
Out of Present worth method and Annual cost method, perhaps the latter fits in well with the thinking of many people and they are better able to interpret the results.
Example 5:
ADVERTISEMENTS:
A concern has got an old equipment which, if is overhauled after every 3 years, an give service up to a total period of 9 years. Considering the data given below, suggest whether new equipment which also has a life of 9 years should be purchased or not.
Old Equipment:
1. Cost of present repair: Rs. 1200.
2. Cost of repair after 3 years: Rs. 1500.
3. Cost of repair after next 3 years: Rs. 2000.
4. Resale value after 9 years: Rs. 1000.
ADVERTISEMENTS:
5. Operating costs: Rs. 2000 per year for 9 years of equipment life.
6. Old equipment at present can be sold for Rs. 1000.
New Equipment:
1. Installed cost: Rs. 10,000.
2. Resale value after 9 years: Rs. 1000.
3. Operating costs: Rs. 1200 per year for 9 years of equipment life.
ADVERTISEMENTS:
Assume interest @ 10%
Given that for i = 10% and
n = 3, Single payment present worth factor = 0.75131
n = 6, S.P.P.W.F. = 0.56447
n = 9, S.P.P.W.F. = 0.42410
and Equal payment series present worth factor for i = 10% and n = 9 years is 5.7590.
ADVERTISEMENTS:
Solution:
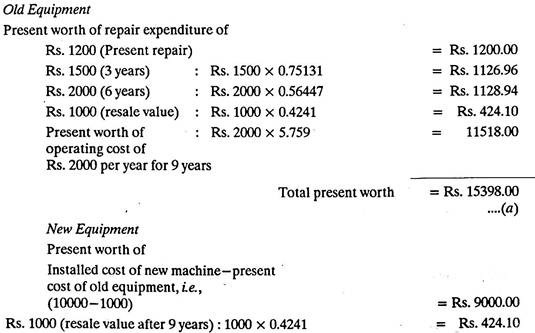

Since present worth of old equipment is less than that of new equipment, therefore new equipment should not be purchased.
4. Rate of Return Method:
Rate of return method calculates a rate of return which is then examined for adequacy. Interest costs are not accounted and therefore the resulting figure is known as unadjusted rate of return.
Unadjusted rate of return
= 100 (Net monetary operating advantage—Amortization)/Average investment …….(1)
Net monetary advantage is the algebraic sum of operation, maintenance and differences in revenue.
Amortization = Incremental investment / Economic life
The above written relationship holds good if the rate of return computed is Before tax rate. If an after tax rate is to be found, the net increase in income taxes due to the project is subtracted from the net monetary advantage.
Therefore, rate of return
= 100 (Net monetary operating advantage-Incremental tax due to the project-amortization/ Average investment
The following example will illustrate the method.
Example 6:
A new material handling system costs Rs. 25000 (installed) including the cost of relayout. This decreases the number of material handling workers by five. After adding increased maintenance and power costs, the net monetary operating advantage is estimated as Rs. 1200 per year. If estimated economic life is 5 years, calculate the rate of return before tax and after tax. Assume a depreciation term of 10 years.
Solution:
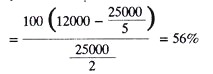
1. The unadjusted before tax rate of return can be calculated by using relationship (1); it is
2. The after tax rate of return is calculated as follows,
Assuming a straight line depreciation,
Incremental taxable income = 1200 – 25000/10(years) = Rs. 9500
Assuming an income tax rate of 50%, the incremental tax due to the project is Rs.9500/2 = Rs. 4750.
Therefore, the after tax return, using relationship (2) is given by
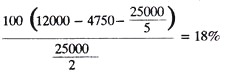
Whether the rate of return of 56% or 18% is adequate or not, it can be judged in relation to the risk involved in the particular project and the returns possible through alternate uses of the capital.
5. MAPI (Machinery Allied Products Institute) Method:
MAPI, the Machinery and Allied Products Institute of Washington, D.C. has done a lot of thinking and research on the subject of equipment replacement. The MAPI system has been updated and improved with the latest version being described in 1967.
The MAPI system is widely used by industry, because it is easy to follow. The MAPI formula might be characterized best as an adjusted after-tax rate of return criterion. A critical requirement of MAPI method is that costs should be based on the process and system performance. In other words, costs for an individual facility should not be measured in isolation from the system.
MAPI method differs from previously described rate of return methods, because:
(i) It estimates the initial rate of return rather than an average rate of return over the life of the investment.
(ii) It allows for obsolescence.
(iii) MAPI charts account for the type of tax depreciation used, (i.e., whether straight line, sum of digits etc.)
(iv) MAPI method takes the help of a set of forms and charts to simplify the mechanics of calculations.
The major advantage of MAPI method is that it permits a simple and consistent method to be applied for evaluating all company facilities. Taxes are generally overlooked in the investment decision process; but the fact that MAPI procedure considers taxes is an important point which goes in its favour. MAPI method makes use of MAPI Summary form and MAPI-charts No. 1 A, 2A and 3A.
(i) Chart No. 1A – It is for one year comparison period and sum-of-digits tax depreciation.
(ii) Chart No. 2A – It is for one year comparison period and double declining balance tax depreciation (refer Fig. 14.2)
(iii) Chart No. 3A – It is for one year comparison period and straight-line tax depreciation.
Besides one year (i.e., next year) comparison, MAPI method covers the second approach also i.e., a multi-year comparison of say, twenty, thirty or more years. However, one year comparison is by far the most common and can be effectively used for comparing the costs of machines for periods of ten years or less.
Procedure:
The MAPI procedure will be explained with the help of following example.
Example 7:
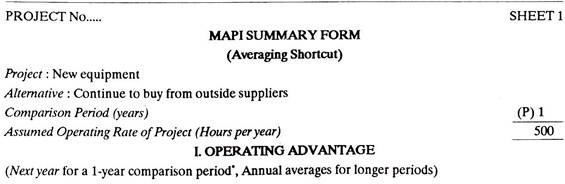
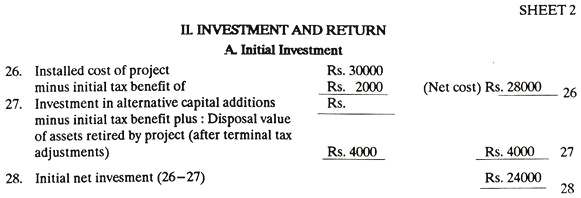
A machine tools making concern was purchasing several component parts for their milling machines from outside suppliers. It decided to install the equipment to produce those parts itself. Cost for this new equipment is Rs. 30,000. Other relevant data has been entered in MAPI summary form given below.
Calculate the after-tax return so that a sound judgment can be made as regards the profitability of the given proposal (of purchasing new equipment).
(N.B. It should be noted clearly that MAPI approach does not give a final answer in the form as whether or not id go for the replacement; it only guides for action)

Solution:
Note:
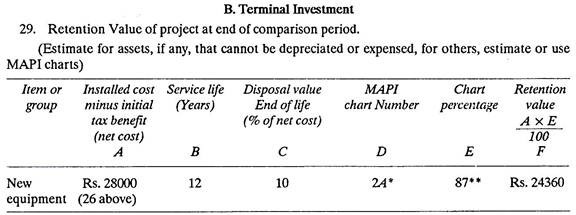
MAPI chart No. 2A is being used because the concern is employing double-declining balance method for depreciation.
Refer MAPI chart No. 2A (Fig. 14.2). For 12 years of service life and 10% salvage ratio, read percent value on vertical scale. It comes out to be 87%.
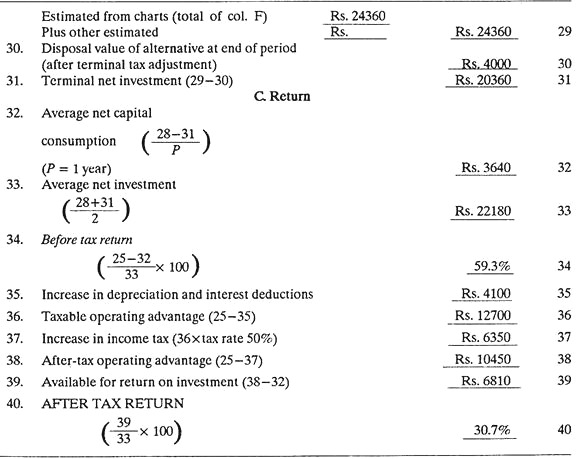
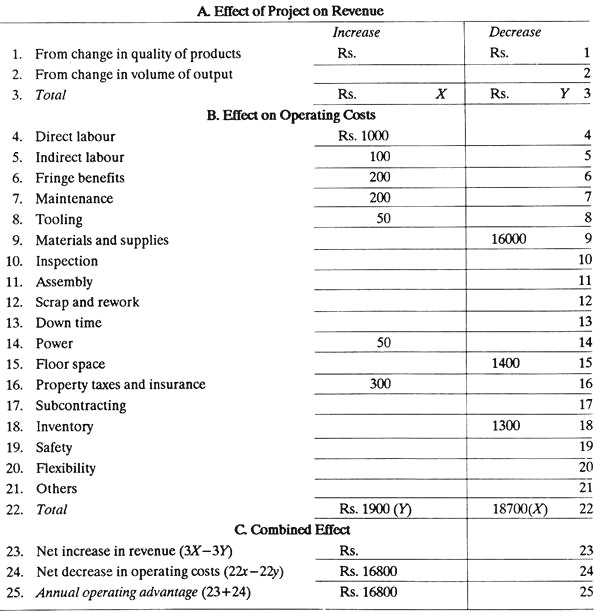
The calculations of the MAPI summary form are self-explanatory. Certain values such as those in lines 4, 5, 6, 7, 8 and others have been arbitrarily assumed. MAPI method can be used just mechanically by following the necessary instructions.
Conclusions:
The after-tax return has been calculated as 30.7%. This is a large enough figure to command immediate management attention. Actually, after-tax return is a measure of investment urgency. If relative urgency of alternative investments can be calculated, it will serve a good guide for action. In other words, the MAPI urgency rating may be compared with the rates computed for other alternative projects competing for the same funds so that the most genuine projects may be funded first.
Besides the accurate MAPI method discussed above, an approximate MAPI solution was published by G. TERBORGH (of MAPI-Machinery and Allied Products Institute), which is explained as under.
6. Terborgh’s Short Cut (Approximate MAPI Solution):
The method developed by Terborgh is very useful in some situations.
Two different short cuts, i.e., regarding CAM and DAM will be discussed below:
(a) Short cut for determining the challenger’s (economic life and) adverse minimum (CAM).
(b) Short cut for determining the defender’s adverse minimum (DAM).
(a) Short Cut: Challenger:
Approximations to the adverse minimum of the challenger can be made by using the following formula:
![]()
where UAE = Uniform annual equivalent for period ending with year n (i.e., capital cost-(-operating inferiority)), Fig. 14.3.

Operating Inferiority:
It indicates the amount by which the defender is operationally inferior to its challenger. Operating inferiority of a machine is the result of wear and tear.
Inferiority gradient is the combined effect of obsolescence and deterioration. The inferiority gradient shows the increase per year in operating cost and opportunity cost due to deterioration and obsolescence.
Opportunity cost includes interest on opening salvage value and loss in salvage value during the year.
Assuming salvage value S to be zero, equation (1) can be simplified as
![]()
By putting d(UAE)/dn =0, the life n which minimizes the equation (2) is found to be
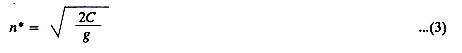
where n is the economic life of the challenger.
Substituting value of n from equation (3) into equation (2) above
The challenger’s adverse minimum
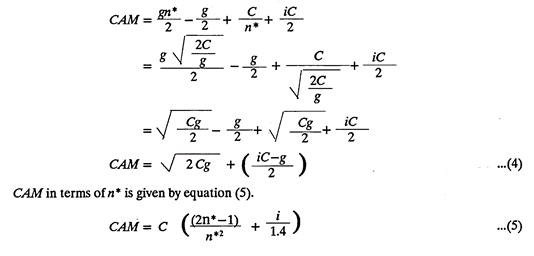
(b) Short Cut: Defender:
A replacement decision is considered only when the defender has been in service for many years and it is now operationally inferior to the challenger in the market. For the defender, the value for next year will be lower than for any other (because the time adjusted cost is already rising from year to year). Therefore the adverse minimum of the defender may be approximated by the next-year sum of capital cost and operating inferiority.
Defender’s adverse minimum.
![]()
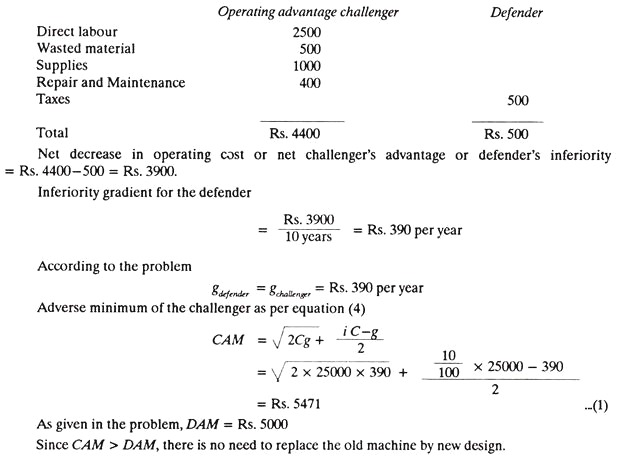
Example 8:
It is to be considered whether or not to replace an existing machine with a new design. The new machine costs Rs. 25000 and does a saving per year of Rs. 2500 in direct labour, Rs. 500 in wasted material, Rs. 1000 in supplies and Rs. 400 in repair and maintenance; however it involves an insurance and property tax of Rs. 500 per year.
The 10 year old machine has adverse minimum (DAM) of Rs. 5000. Assuming an inferiority gradient same for defender and challenger and an interest rate of 10%, suggest whether to replace old machine by new design or not.
Solution: