
During different development stages of a layout the following methods may be used: 1. Process Flow Charts 2. Material Movement Patterns 3. Layout Analogues 4. The Correlation Chart 5. Travel Chart 6. Load Path Matrix Method.
Method # 1. Process Flow Charts:
They show, how different component parts assemble, in sequence of operations to form sub-assemblies which in turn lead to assemblies (finished products).
Method # 2. Material Movement Patterns:
The flow pattern of materials-in-process is traced and layout is built around it.
Method # 3. Layout Analogues:
They cover two-dimensional cutouts or templates and three-dimensional models.
ADVERTISEMENTS:
(a) Templates:
They are used to develop plant layout. They are two-dimensional or block templates made up of cardboard, coloured paper or celluloid. They are made to scale (a typical scale being 1/50) and are placed on the scaled outline plan of the building. Templates or cutouts show the plan of the various facilities and the building.
They show the actual floor space utilization. The templates can be placed and attached with a tape either on a board or on a cross-hatched surface or on a graph paper and thus being known as Graphic Technique. These templates have flexibility in use and can be moved on the graph paper from place to place in order to evaluate various feasible positions for different machines.
It is better to photograph a layout before shifting the templates to try another layout of facilities. Templates save a lot of time and labour which otherwise would be spent in making drawings for each alternative plant layout arrangement. They visually present various characteristics, advantages and limitations of a layout. Coloured templates have still better vision effect.
ADVERTISEMENTS:
Figure 4.7 shows a block template and a two dimensional template. A two-dimensional template gives machine outline and its details whereas a block template shows the boundary of the maximum projected area of the machine. Templates, though simple and inexpensive, do not give real situation effect which is obtained through the use of three-dimensional models or block models.

Advantages of Two-Dimensional Templates:
(1) They are the least costly.
ADVERTISEMENTS:
(2) They can be readily interpreted and followed by technical hands.
(3) Duplicate copies can be made.
Disadvantages:
(1) Non-technical persons find it difficult to grasp the clear picture.
ADVERTISEMENTS:
(2) Overhead facilities cannot be visualized.
(b) Three-Dimensional Models:
They are scale models of a facility and, more near to the real situation as, besides length and width they show the height of a facility also. Models are especially suitable for persons who are not familiar with plant layout practice. Models are made up of wood or diecast plastic. They show minor details and can be mounted on a thick plastic sheet acting as the floor plan.
Models are used mainly to develop floor plans and elevations. Models can be made for production machines, workers, material handling equipment or any other facility. Models are much more effective and fast as compared to drawings or templates especially when multi-storey plant layout is to be designed. Multi-storey models can be made of Lucite (a clear plastic). Models though expensive have resulted in substantial saving in laying out of chemical factories and refineries.
ADVERTISEMENTS:
Advantages of Three-Dimensional Models:
(i) Layout is easier for the lay men to understand.
(ii) Layout can easily be explained to management.
(iii) Models can be shifted easily and quickly to study operational arrangements.
ADVERTISEMENTS:
(iv) Overhead structures can be easily checked.
(v) They convey more or less a real situation.
Disadvantages:
(1) They require more storage area.
ADVERTISEMENTS:
(2) They are expensive.
(3) It is difficult to take ‘them to shop floor for reference purpose.
Other methods of plant layout are as follows:


Method # 4. The Correlation Chart:
It involves drawing a grid with rows presenting alternative solutions (See Fig. 4.10). Plant items can be ground floor, first floor or other floors of a multi-storey building.

After the grid has been drawn the next step involves applying the constraints and objectives of layout. For example, the constraints to the layout may be that, (1) X cannot be done on ground floor (G.F.), (2) Y cannot be performed on first storey (1S). Similarly there can be objectives, (3) W should be done on second storey, and so on there are other objectives (4), (5), etc.
Constraints and objectives are then applied to the squares. When a constraint stops an item going into a square, then in that square the number of that constraint is marked. After that the objectives or preferences are applied.
For example W is restricted to second storey (2S) hence it cannot be done on other floors therefore 3 (the identification number of objective) is marked on all other squares except (2 S).
![]()
Similarly other objectives can be marked on the grid. A feasible solution of the layout problem is given by the path (PQ) traced along the grid rows form the first (plant) item to the last item by joining open squares (hatched) only. The possible solution is Correlation chart is an easy technique and gives visual presentation. However, drawing up consumes much time.
Method # 5. Travel Chart:
A travel chart as the name suggests is a chart or record of the amount of travel by the material in-process while going from machine to machine or from one department to another. The amount of travel depends upon the frequency of movements between sections or departments. A travel chart helps improving the existing plant layout.
ADVERTISEMENTS:
The following example will explain a travel chart:
1st Step:
Existing plant layout showing the locations of various departments (A to F) is given in Fig. 4.11.

2nd Step:
Movements A to B are 20; B to A, 10; B to C, 15 ;A to F, 25 ;C to D, 30; D to C,50;D to F, 40; E to F, 10 and F to E, 15.
ADVERTISEMENTS:
3rd Step:
A square grid is drawn and the various movements are marked.


4th Step:
Fig 4.12 is simplified by combining movements like to B (20) and B to A (10) which involve same distance and therefore total movements B D A = 20 + 10 = 30.
ADVERTISEMENTS:
The simplified travel chart (See Fig. 4.13) shows the movements as follows:
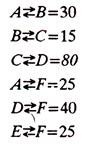
According to these figures maximum number of movements are between departments C and D, hence in the plant layout these two departments should be side by side. The next lesser number of movements are between D and F, hence D and F should also lie closer to each other and so on.
As a result the existing plant layout can be modified as follows:

Departments C and D (80), D and F (40), A and B (30), A and F (25), E and F (25) are closer to each other whereas 5 and C which have minimum number of movements (i.e., 15) between them areaway from each other. A travel chart is advantageous because it brings out the relative importance of having different pairs of departments close to each other but it gives an optimum linear arrangement which may not be always required.
Method # 6. Load Path Matrix Method:
ADVERTISEMENTS:
The method aims at reducing the transportation of in-process inventory from section to section. Like travel chart it also helps deciding the position of one department in relation to the other; The ultimate purpose is to modify the existing layout or the preliminary plant layout made by other techniques. The departments having mass flow of material or goods are placed close to each other. The following example will illustrate the method.
Step 1 and 2:
From the matrix (step 1) a diagram (See Fig. 4.16) is made showing the locations of different departments and the amount of material flowing among various departments (like B, C, etc.). Line joining AC shows that 20 kg. of material moves per day from departments to department C and so on. It can be seen that 40 kgs. of material while going from 4 to D passes B.
")

If D department is brought in place of B then 40 kgs (i.e., maximum) of material will move comparatively less distance. Similarly, material movements from C to E and E to D can be considered. The aim is to reconstruct this sequence diagram so that bigger loads travel small distances.
Step 3:
Trial and error method can be used in order to modify the sequence diagram of step 2 and a comparatively better sequence diagram is drawn in Fig. 4.17. This has been obtained by placing those departments close to each other which involve movements of larger amounts of materials.
