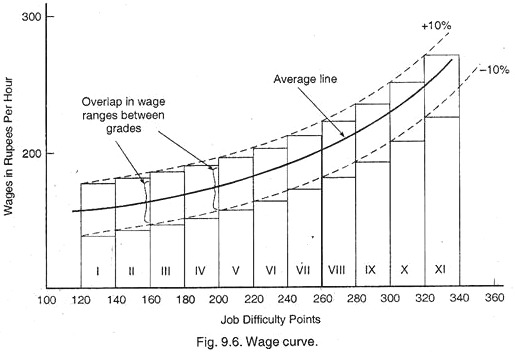
There are three major steps in achieving the final wage structure for base wages.
These are:
(i) Decision about range, i.e., maximum and minimum wages for the grade.
(ii) Decision about the number of grades of workers.
ADVERTISEMENTS:
(iii) Decision about the overlap in between the different grades.
All the above mentioned steps are closely related, i.e., if there is any change in one, this will cause some change in other.
There are so many theories about the decision of first two points but about the third point a wage curve has to be drawn.
ADVERTISEMENTS:
The wage curve is drawn in Fig. 9.6 and explained as under:
A wage curve is graphic representation between job difficulty values (points, ranks or grade level) and wages paid for the jobs. When the curve obtained is straight line then it is called as wage line. But in general, a curve as shown in the figure is obtained, which is a second degree curve.
As regards the overlap, theoretically, it is clear that there should be no overlap because a worker near the top of lower grade could have higher wage than the person on a higher grade. It is recommended that number of grades should not be more than twelve, while upto six grades, the accuracy may be coarse. Thus numbers of grades between six to eleven are generally taken into consideration.
For number of grades lying between six to eleven, the range is assumed @ 10% of average pay line. If there is more number of grades, then overlapping must be more between the grades. The overlapping can be reduced by different methods such as by increasing the slope of the pay line, or by reducing wage range or by reducing number of grades.
ADVERTISEMENTS:
Though overlapping should be avoided but, it is a fact that there should be overlapping between the grades so that workers under the lower grade should get more wages on excellent performance than to a worker working under higher grade having poor performance. Further, due to overlapping the foreman can transfer workers temporarily other jobs. Normally overlapping should be limited to within three adjacent grades.
