After reading this article you will learn about:- 1. Meaning of CPM 2. Steps Involved in CPM Technique 3. Example.
Meaning of CPM:
CPM is applicable to both large and small projects, taking from space programmes to wedding or horse shows. It is widely recognized and is the most versatile and potent management planning technique.
CPM is a technique, used for planning and controlling the most logical and economic sequence of operations for accomplishing a project. The project is analysed into different activities whose relationships, as in PERT, are shown on the network diagram. The network is then utilized for optimising the use of resources, progress and control.
Steps Involved in CPM Technique:
CPM employs the following steps for accomplishing a project planning:
ADVERTISEMENTS:
(1) Break down the project into various activities systematically.
(2) Label all activities.
(3) Arrange all the activities in logical sequence.
(4) Construct the arrow diagram.
ADVERTISEMENTS:
(5) Number all the nodes (events) and activities.
(6) Find the time for each activity.
(7) Mark the activity times on the arrow diagram.
(8) Calculate early and late, start and finishing times.
ADVERTISEMENTS:
(9) Tabulate various times and mark EST and LFT on the arrow diagram.
(10) Calculate total float for each activity.
(11) Identify the critical activities and mark the critical path on the arrow diagram.
(12) Calculate the total project duration.
ADVERTISEMENTS:
(13) If it is intended to reduce the total project duration, crash the critical activities of the network.
(14) Optimise the cost
(15) Update the Network
(16) Smooth the network resources.
Example on CPM:
ADVERTISEMENTS:
It is required to fabricate tanks for an electroplating shop.
The activities involved are as follows:
(a) Order material for the tanks,
(b) Await delivery of the material,
ADVERTISEMENTS:
(c) Collect tooling equipment for tank fabrication,
(d) Fabricate the tanks,
(e) Test the tanks against leakage,
(f) Obtain precut rubber lining from the market,
ADVERTISEMENTS:
(g) Fix lining on the inside of the tanks, and
(h) Paint the tanks from outside.
Using the activities listed above construct an arrow diagram for the fabrication of tanks and explain in detail the CPM-planning scheduling and control technique.
Solution:
From the given data, the following arrow diagram has been constructed (Fig. 10.5):

Estimating Activity Time (Duration):
ADVERTISEMENTS:
After the arrow diagram has been drawn and various activities marked on the same, the next step is to estimate time for each activity. The time estimate should be as realistic as possible and preferably based upon past experience, i.e., time values can be taken from similar/same activities accomplished earlier. Estimation of duration is no problem for an experienced estimator, but for a new person if past data is not available, it is better to use PERT technique for estimating time.
The estimator after consulting others and from his own judgment finds three time estimates to calculate the expected time. After the project is over, the estimator must always be intimated about the actual time taken to complete the activities, which he estimated earlier. This feed-back information helps a lot in imparting experience to a new estimator and at the same time it is a record for future estimation.
Assume that the estimator, basing upon his past experience, gives the following time values to different activities:
![]()
The duration is marked on the network diagram (Fig. 10.5).
ADVERTISEMENTS:
Preparation of Analysis Table:
EST and LFT are calculated and marked on the arrow diagram (Fig. 10.6).

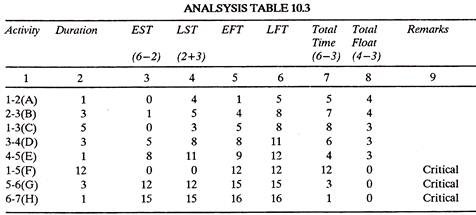
The analysis Table 10.3 recognises the critical activities (i.e., activities with zero float) which are marked on the arrow diagram (Fig. 10.6) and thus the critical path 1-5-6-7 is established. The total project duration is 12 + 3 + 1 = 16 days.
Crashing of Network:
ADVERTISEMENTS:
Many times it is felt that the project duration as estimated from normal arrow diagram is long and it is desired by management to accomplish the project in a shorter duration of time in order to secure progress payments or to avoid lateness penalties, etc. To do so various possibilities are explored. Work study techniques of systematic questioning (as in critical examination under method study) are employed to every (critical) activity to seek the possibilities of reducing their duration.
The critical path activities are classified as Do and Ancillary activities. Ancillary activities are those which support Do activities. For example, cutting of threads on a bar is Do activity whereas making the set up for cutting threads is an Ancillary activity. After identification, Do activities are subjected to systematic questioning technique embodying series of questions as regards purpose, place, sequence, person and means.
The second method is to trade off or transfer some resources from the activities having float to the critical activities, in order to reduce their duration. Trading off-redistributes the resources and accompanies changes in duration. The resources may be workforce, amount of equipment and machinery, money, (better and more suitable) materials, etc.
Even by using work study techniques, trade off and other possible methods, if efficiency does not improve and the project duration is not shortened, then the only alternative left is network contraction or compression. In other words, when all those techniques, which can reduce project duration at almost zero additional cost, fail, then network contraction, expediting or crashing of activities is resorted to.
This system of improvement involves extra cost because extra money is spent on overtime engagement of workforce, purchase of additional machinery, use of better materials, skilled workers, etc. The cost increases, as more and more activities are crashed and in turn, of course the project duration decreases. One has to strike a balance between the extra money spent and the project time saved.
There are two types of activities-critical and non-critical. Crashing non-critical activities does not serve any purpose as they do not control the project duration and completing them (still) earlier does no benefit rather increases work-in-progress. Therefore, crashing is centred on critical activities only which can reduce project duration if completed earlier.
ADVERTISEMENTS:
Crashing of critical activities is started, in a systematic manner, from that (critical) activity which has least cost-time slope, i.e., which is cheapest to crash. Activities are crashed one after the other till the activity duration cannot be reduced further or the duration of original critical path gets shortened beyond a certain limit that another critical path comes into the picture.
Under such circumstances if there are more than one critical paths, then, one activity in each of the critical paths is chosen for crashing by the same amount of time. The crashing continues to the point, where after further decrease in project duration is not possible, because, either the network reaches the compression limit set or the cost of crashing is more than the amount of saving in return.
The following terms need to be explained before (actually) crashing the network:
Normal Cost (Nc):
It is the lowest cost of completing an activity in the minimum time, employing normal means, i.e., not using overtime or other special resources.
Normal Time (NT):
ADVERTISEMENTS:
It is the minimum time required to achieve the normal cost.
Crash Cost (Co):
It is the least cost of completing an activity by employing all possible means like overtime, additional machinery, proper materials, etc.
Crash Time (CT):
It is the absolute minimum time associated with the crash cost.
Cost-time slope or slope of activity cost line (Fig. 10.7),
![]()
Table 10.4 shows estimated normal and crash values of time and cost for each activity. Slope and the maximum compression for each activity has been calculated. Maximum compression is the difference between normal time and crash time.

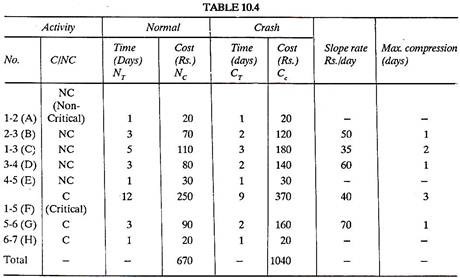
In the critical path 1-5-6-7 (16 days) (fig 10.6) there are three critical activities.
1.5 @ Rs. 40/day
5-6 @ Rs. 70/day
and 6-7, which has zero maximum compression and hence cannot be crashed. Activity 1-5 is least expensive to crash and hence it is done so and a modified Table 10.5 of first compression is prepared.


Now there are two critical paths that is 1-5-6-7 and 1-3-4-5-6-7, both giving a project duration of 13 days.
Activities like 1-3 and 3-4 though can be crashed by spending extra money but there will be no advantage because activity 1-5 has reached its compression limit (9 days) and therefore cannot be crashed any-more; so there is no use of completing activities 1-3,3-4 and 4-5 before 9 days at extra cost. Of course activity 5-6 can be crashed.
A modified Table (10.6) showing second compression is as under.

The arrow diagram drawn after second compression is given in Fig 10.9.:

There are two critical paths, i.e., 1-5-6-7 and 1-3-4-5-6-7 both with a project duration of 12 days.
Further crashing of activities is not going to reduce the project duration as one critical path 1-5-6-7 has reached its compression limit; all its activities, 1-5, 5-6 and 6-7 are at crash time and crash cost. Figure 10.9 shows the all crash diagram. After that, an all crash Table (10.7) is prepared.

Table 10.8 shows the summary of cost under normal and various compressions.

(D) Optimizing Cost:
A number of costs are associated with a project. A direct cost is one which involves cost of equipment, machinery, workers and other resources. An indirect cost includes overhead charges, depreciation, taxes, administrative costs, etc. Another cost may be market loss and penalty cost. Individual cost curves are plotted and a total cost curve is constructed by adding all the individual cost curves.
The total cost curve takes a U-shape and the lowest point of the curve when projected on X and Y axis gives the value of Optimum Time and Optimum Cost respectively. The procedure of optimising the cost will be explained by continuing the example 10.3 (still) further.
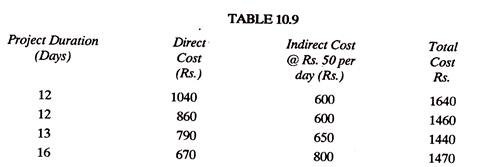
Table 10.9 gives the value of total direct costs under normal and (various) compression conditions. These values have been plotted in Fig. 10.10 as curve (a).
The indirect cost varies linearly with time and takes a straight line shape. Assuming, indirect charges at the rate of Rs. 50 per day, the value of indirect costs have been marked in Table 10.9; and the indirect cost curve (b) has been plotted in Fig. 10.10. Curves (a) and (b) are then added to give the total cost curve (c). The bottom-most point of the curve (c) when projected on x- and y-axis gives the values of optimum time (13 days) and Optimum Cost (Rs. 1440) respectively as marked in Fig. 10.10.

(E) Updating the Network:
Hardly any project can be claimed as perfectly planned. There are bound to be unforeseen delays and difficulties which may be due to delay in supply of raw materials, labour turnover, breakdown of key machinery, or non-availability of skilled workers. Under other circumstances the situations may improve too, for example if additional workers or machinery is made available, the work can be finished earlier also.
The arrow diagram should always be kept up-to-date by incorporating changes occurring due to re-planning. Thus updated network diagram warns against the effects the unforeseen problems will create if nothing is done. Moreover the updated arrow diagram can suggest the ways and means to overcome the new problems.
Network updating may be defined as any adjustment to the arrow diagram which becomes necessary owing to departure from the project schedule laid down earlier. It is the process of incorporating in the network the changes which have occurred due to re-planning and rescheduling.
Updating can be undertaken at regular time intervals depending upon the progress of the project. The frequency of updating is more in case of small projects as compared to large projects, because little problems here and there can easily delay a small project (i.e., a project with small duration). Large projects also need updating, but generally near their completion stage.
The technique of network updating has been explained below:
The original arrow diagram of example 10.3 is repotted in Fig. 10.11 and the critical path 1-5-6-7 is marked.
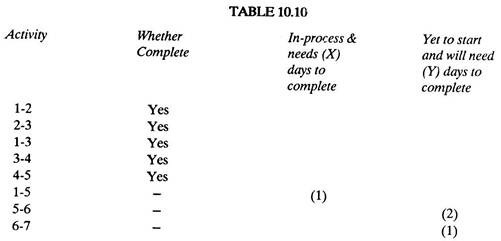
Assuming that 9 days are over (marked by YY), and progress of the project as evaluated is given below:
(1) Activities 1-2, 2-3, 1-3, 3-4, and 4-5 are complete,
(2) Activity 1-5 is still in process and needs 3 more days to complete.
Assume that at the end of 9th day, two more workers join the team and it is estimated that activity 1-5 will take only 1 more day to complete. The activity 5-6 will also be completed in 2 days instead of 3. This is how the situation changes and necessitates updating of network, which is carried out as under.
(1) Activities 1-2, 2-3, 1-3, 3-4, and 4-5 take 1, 3, 5, 3, and 1, days respectively to complete.
(2) Activities 1-5, 5-6 and 6-7 will take 10, 2 and 1 days respectively to complete.
Arrow diagram of Fig. 10.11 is then modified and repotted in Fig. 10.12 and the project can now be completed in 13 days instead of 16 days estimated earlier.


The critical path is 1-5-6-7. If activity 1-5 could be finished in 8 days (instead of 12) the critical path would have changed. In that case the critical path (i.e., longest path) would be 1-3-4-5-6-7. So, updating under certain circumstances may change the critical path also.
From the updated network, Table 10.10 is constructed to show effects of updating, on different activities.