In this article we will discuss about financial synergy, that diversification can achieve and how BCG matrix or portfolio planning can aid in developing this synergy.
Broadly, there are two major approaches to achieving competitive advantage: market share and synergy.
Synergy implies—joining business units together so that their combined performance exceeds that which would be possible if the businesses operated on their own.
The primary means of achieving synergy is diversification into new products, markets, or businesses.
ADVERTISEMENTS:
If a new business can share a resource, say—finance (there are other resources, of course, like technology or marketing skills) with the firm’s original business, then the two businesses operating together can generate a larger and more sophisticated finance resource base than either business could support separately. This stronger resource base is called ‘financial synergy’.
Every business requires finance (or cash) in order to operate. Finance is needed to purchase equipment, meet wages and overheads and so on. Apart from the owners’ capital to establish a new business, a major source of finance to it is debt supplied by banks and/or other financial institutions.
Firms incur costs in raising finance. For business units operating as parts of a large diversified firm, these costs can be significantly lower than that of those which are small independent entities. The advantages enjoyed by businesses of a diversified firm derive from the fact that they do not themselves undertake financial activity. Rather, the corporation of which they are part does so.
By thus pooling their financing efforts, these business units enjoy important financing synergies not available to their independent (i.e., undiversified) rivals. Those financial synergies are usually in the form of lower interest rates, reduced underwriting fees, tax savings, and more assured accessibility to funds.
ADVERTISEMENTS:
(i) Interest Costs:
Interest is the fee a borrower pays a lender for the use of borrowed funds. The risk that a borrower will default on a loan is usually lower for a large diversified firm than that for a small single-business company. Reflecting this difference, lenders are willing to provide funds at a lower rate of interest.
Again the cost of efforts on the part of a lender towards studying the borrower’s business and its credit worthiness does not vary much between large and small borrowers. So, interest rate for a small borrower is higher than that charged to a large diversified firm.
(ii) Underwriting Fees:
ADVERTISEMENTS:
These are the amounts that an underwriting firm charges whenever engaged by any firm who sells a new issue of common stock to raise funds. An underwriting firm’s fees as a per cent of new money generated tend to decline significantly with the higher size of a stock sale.
Consequently, a large diversified firm generally pays a much lower rate than the rate one of its individual business units would have to pay to sell stock as an independent company.
(iii) Taxes:
Diversification can also sharply reduce the taxes associated with equity financing.
ADVERTISEMENTS:
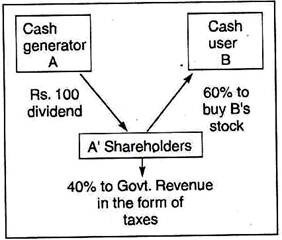
To understand how, let us consider the highly simplified stock market shown in a diagram below:
It consists of two firms, A and B, having the same shareholders. Let us assume, A has an excess of cash while B is in need of cash for expansion. How does the stock transfer cash from A to B? A must first declare a divided to its shareholders. These individuals must then use the dividend proceeds to buy additional shares in B.
The problem is that not all of A’s dividend is available for reinvestment in B since a portion (say, 40%) goes to Government Revenue Department in the form of taxes levied on A’s shareholders receiving the dividend, leaving 60% only with which A’ shareholders can buy additional shares of B.
ADVERTISEMENTS:
Corporate affiliation much improves the situation. If A and B are units of a single company, then A can transfer funds directly to B without having to first pass them through shareholders. Since no tax liability in involved, the entire dividend paid out by A is available for investment in B.
The above example is a case of oversimplification, no doubt. The same set of shareholders is rare and they do not necessarily reinvest their dividends. Despite these, merging cash generator with cash user in a single firm can provide a far more efficient synergistic alternative.
Portfolio Planning (BCG Matrix)—Aiding Financial Synergy:
To raise equity, the independent firm has to go outside, usually to the stock market, for help. Unfortunately, stock market prices are highly volatile. When stock prices are depressed, a firm cannot sell stock without severely diluting the ownership of existing shareholders.
ADVERTISEMENTS:
To avoid this, the independent firm often delays selling stock till the stock market improves. In competitive terms, such delay is costly as it retards the progress of activities like plant expansion, new product development, automation and so on. The result may be lost opportunity to gain market share or erosion of current market share position.
By placing together in a single corporate ‘portfolio’ businesses that both generate and use cash, a diversified firm can internally finance many of its projects.
The internal financing benefit provided by diversification has come to be seen as so important that a comprehensive managerial approach has been developed to guide it. Called ‘Portfolio Planning’, it ensures the optimal allocation of ‘cash’ among the various businesses comprising a diversified corporate portfolio.
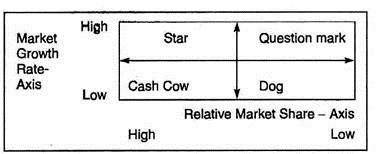
At the heart of portfolio planning theory is the Growth-Share Matrix shown below:
It provides a scheme of broadly classifying a company’s businesses according to their strategic needs including cash (or finance) requirements.
The horizontal axis shows the relative market share held by the various business units, expressed as a ratio of each unit’s share to the share held by the leading competitor in its particular market. The vertical axis depicts the growth of the various markets in which the businesses compete.
These two dimensions largely determine a given business’s net cash flow—the cash it has left over for (or requires from) other business units in the portfolio. Net cash flow is determined by two opposing forces: the cash a business unit generates from profits less the amount it must reinvest in order to maintain its competitive position.
Market Share provides a rough estimate of a business unit’s ability to generate cash from profits. Similarly, a business’s need for cash is closely tied to the growth rate of its market.
When market growth is rapid, a business must invest more cash for new plant and facilities and for marketing and distribution, etc. in order to maintain market share position. When market growth declines, the need for cash is much lower. Thus, the market growth rate provides a rough indication of a business unit’s cash requirements for reinvestment purposes.
The Growth Share Matrix is divided into four boxes (commonly called ‘Quadrants’). Let us briefly explain the cash-flow properties of businesses in each Quadrant.
ADVERTISEMENTS:
a. Stars:
The businesses enjoy both high profitability and attractive growth prospects. The net cash flow of these businesses tends to be about zero, since the cash that stars produce from the profits tends to be offset by the large investments on plant and equipment and personnel to maintain leading positions in their rapidly growing markets.
b. Question Marks:
The businesses are yet to establish their competitive viability although they operate in rapidly growing markets. So they need heavy cash as stars since their markets are growing rapidly. However, they are less able internally to meet their cash needs since their market shares and therefore, profitability are lower. Consequently, they tend to be net users of cash.
‘Stars and Question Marks’ quadrants are, therefore, net users of resources of various kinds including cash.
c. Cash Cows:
ADVERTISEMENTS:
The businesses here tend to be highly profitable since they are ‘market share’ leaders. Yet, they have a relatively small need of cash to reinvest in their businesses since their markets are not growing rapidly. Therefore, most of their profits are available for use elsewhere. These businesses are the primary net cash generators in a company’s portfolio. They are called ‘Cash Cows’ because they can be ‘milked’ for cash.
d. Dogs:
The businesses here are considered to be the least attractive in a company’s portfolio. Their low market share shows depressed profitability and slow market growth promises no future. Their cash generating ability is low because of their low market share. Their cash needs are also minimum because of low market growth.
As a result, Dogs, like Stars, tend to be more or less in cash flow balance. In other words, the businesses here are in very poor competitive position. Although there may be other strategic choices to convert ‘Dogs’ into ‘Question Mark’ or ‘Cash Cow’ category, the stiff competition and other adverse conditions may force the diversifier to divest the business altogether and deploy the cash received for effective use elsewhere.
‘Cash Cows and Dogs’, in this sense, are net suppliers of resources of various kinds including cash.

