
Fixed Income Securities available in India!
Yield:
Simply put, ‘Yield to Maturity’ (YTM) or yield for short is the annualized return that you will earn if you invest in a fixed income security today and hold it till maturity. It’s not a simple rate of return but takes into account the effect of compounding. When comparing alternative investments, yield is one of the points taken into consideration.
So, yield is the return that you will earn if:
I. You invest in the security today,
II. Hold that security till maturity, and
III. Could reinvest all intermittent cash flows (such as coupons) at the same yield rate.
The reason we use yield and not the coupon rate when comparing alternative investment opportunities is simple- You may not buy the security in the secondary market at par value nor you may sell the security at par (be it in the secondary market, or by holding it till maturity).
In fact if you could buy and sell the security at par, your yield will be the coupon rate of that security. The yield will differ from the coupon rate depending on whether the security is selling at a discount to par (cheap) or premium (costly). A security selling at a discount will have a yield higher than its coupon rate while the one selling at premium will have a yield lower than its coupon.
The interest rates that are offered on new issues (called primary issue) at a given time depend on the yields prevailing in the market at that time. High yields prevailing in the economy (This is basically not a good sign. We have discussed the ‘why’ below) will cause all new issuances to offer high coupon rate.
When the yields in the economy fall, the coupon rates on new issuances too fall. So it is not correct for you to consider a security issued at a high coupon during bad times to be better off than one issued at low coupon rate during good times. This is the relevance of the concept of yield.
There are two academic assumptions in the concept of YTM (yield to maturity):
I. First, it assumes that you reinvest all cash flows at the same yield rate. This may not always be the case. You may not be able to reinvest the cash flows in the same security again for several reasons. The intermittent flows will be reinvested at the rates available at that point of time.
II. Second, it assumes that you hold that security till its maturity. An investor may not always intend to do so, or unforeseen requirements may force him to liquidate his investment in the security. If you sell your investment before maturity, the sale price may be higher or lower than the par value which creates a capital gain or loss. This aspect of your return is completely ignored by the yield measure.
However, this concept is the closest to being perfect in the absence of an ideal parameter.
Yields are usually a widely reported measure in the world of fixed income investments and have several utilities.
If you wish to calculate the yield or YTM of your investment, you can use a spreadsheet program like Microsoft Excel.
Price and Yield- The Inverse Relationship:
The inverse relationship of price and yield means that the price of a bond moves in a direction opposite to that of the yield. If you ever wondered why people make such a hue and cry about rising yields, here’s the answer. While an increase in yield gives an opportunity to earn a higher return for the next investor, an investor who has already invested in the security sees the value of his investment diminish.
The reason for such an occurrence can be explained from both a theoretical standpoint as well as a logical standpoint.
In theory, the price of a bond is the present value of its future cash flows (interest and principal repayment at maturity) discounted at the yield rate. So yield is the required return for investment in the bond. The future cash flows will always be certain. You can only adjust the current price up or down to ensure you earn the current yield on the investment.
When the yield increases, the required return increases and the present value will have to be adjusted down to ensure that you earn the required return. In the same way, when the yield falls, the required return falls and the present value increases.
Logically speaking, suppose you purchase the hypothetical bond,
Its features were:
I. Coupon Rate- 9%
II. Price- Rs. 95
III. Redemption Value- Rs. 100
IV. Calculated yield- 9.80%
After you bought the bond for 95, the yields in the market rose to 10%.This means that new issuances in the market will offer an interest rate of about 10%. If you decide to sell this bond again for 95, you will not find any takers. This is because; a buyer will be better off buying the bond in the market and earn a yield of 10% rather than buy your bond at 95 and earn a yield of only 9.80%.
If you can’t sell the bond at 95, you will have to reduce its price to make it saleable. You will have to reduce the price enough to ensure that the buyer earns a return of at least 10%. The same logic explains the reason for increase in prices in case the market yields fall.
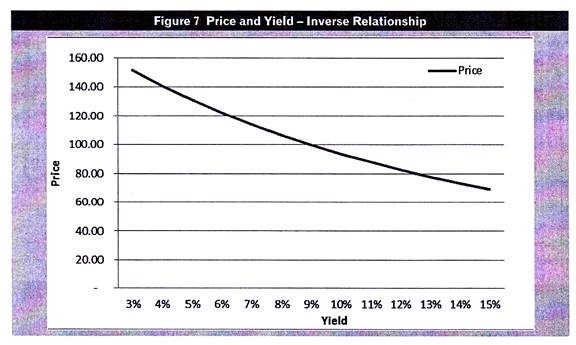
The yields and the calculated prices of our hypothetical bond are as below:
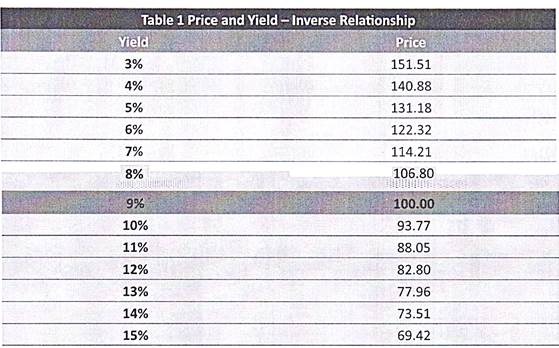
Notice that when the yield is 9% i.e. same as the coupon rate of the bond, the price equals redemption value.
If you plot the different yields and the corresponding prices on a graph, you would get a downward sloping curve.
Yield Curve:
The yield curve is another very important concept that you will often hear in the world of fixed income investments.
The yields on fixed income investments will differ depending upon several factors including their maturity periods. When you plot on a graph, the yield on bonds having varying maturities, what you get is the yield curve.
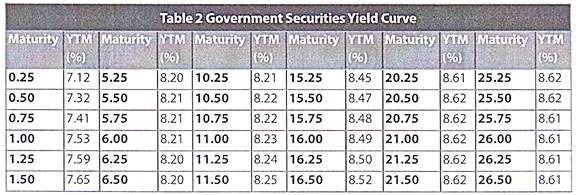
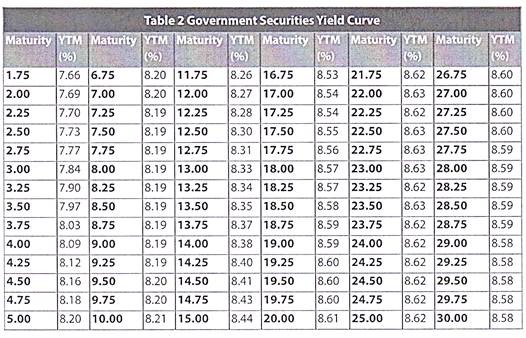
We will construct a yield curve for government securities using the yields quoted by the Fixed Income Money Market & Derivatives Association (FIMMDA) and the Primary Dealers Association of India (PDAI) as on February 7, 2011.
The yield curve looks like this:
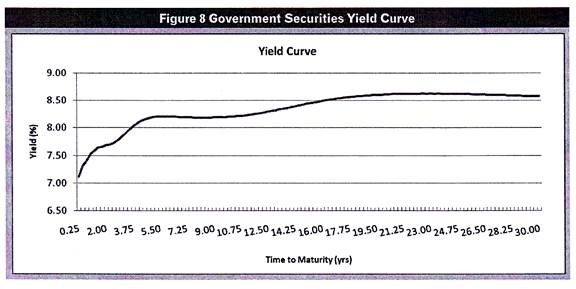
The yield curve that we constructed above would be called the Government Securities Yield curve since we used the yields on government securities to construct it. Similarly, we may use the yields on corporate bonds to construct the corporate bond yield curve. Likewise, you may construct a zero coupon yield curve by plotting the yields on zero coupon bonds of different maturities.
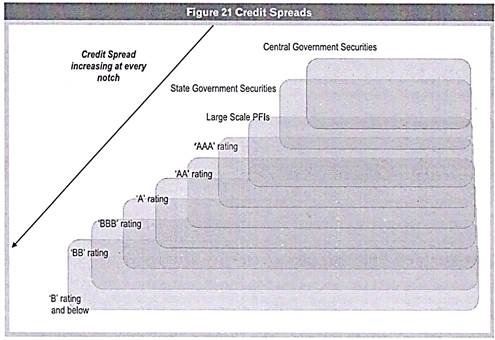
Credit Spreads:
The spread of a security is excess yield of that security over that of some other security. Simply put, if you have two securities A and B, the spread of B over A is the additional return that you will demand for investing in security B rather than in security A.
There can be several reasons for such a spread to occur. Assuming a similar maturity, the most common reason for a spread to arise is credit risk. Credit risk is the risk of default by the issuer of the security.
Securities issued by the Government of India are perceived to be free of credit risk. Therefore, government securities are often used as a benchmark over which credit spreads of any security are measured.
The spread of a security over a government security of similar maturity is an indication of its credit risk. The credit risk is usually perceived to be lower for public sector undertakings and higher for private corporate. Also, the credit risk is low for the highest rated and increases as we move down the rating scale.
When you are calculating the credit spread of securities, the yields in government securities of a comparable maturity are often used as a benchmark. For example, if you are trying to find out the credit spread on a corporate bond about to mature in two years, select the yield on a government security that is also about to mature in two years.
However, you can also compute credit spread of a security with a particular credit rating over and above a security with a higher credit rating. For E.g. – you can compute the credit spread of a AA rated security over and above a AAA rated security
Annualizing of Returns:
As a convention, the return quoted for any fixed income product is an annualized return. This applies to the quoted yields as well as the coupon rates. Thus, unless specifically mentioned otherwise, the interest rate quoted to you is the annual rate. For Example, when you invest in a Fixed Deposit for three months and the interest rate quoted to you by the bank is, say 8%, you don’t actually get a return of 8% in three months. What you will get is only 2%.
Here’s how:
8% X (3 months / 12 months)
There are two most commonly used ways of annualizing:
1. Simple and
2. Compounded
1. Simple Annualized:
Simple annualized return ignores the impact of return on return. Lets continue with the example of the 3 month Fixed Deposit giving a return (don’t forget; it’s always annualized) of 8%.
If you had invested Rs. 1,000, you would have earned Rs. 20 at the end of 3 months.
Assume you cash out and spend the entire Rs. 20 at the end of the three months so that you are only left with the initial Rs. 1,000 to reinvest.
You do the same thing again for the next three months and so on for one whole year. At the end of the year, you would have earned and spent Rs. 80 in all. So your return for the year was 8%
(80 X 100) / 1,000
2. Compounded Annualized:
Compounded annualized considers the fact that your return may earn a further return in the subsequent periods. If you would have not spent the interest income in each period in the example above, you would have earned Rs. 1,114.58 at the end of the year.
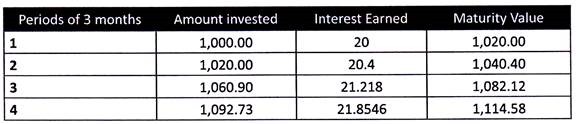
The rate of your return comes to 11.46%
The returns on most contractual fixed income products are quoted as simple annualized (unless stated otherwise).
In the case of Mutual Funds, as a convention, returns for a period less than one year are quoted as ‘simple annualized’ while returns for a period more than one year are quoted as ‘compounded annualized’.
Further, SEBI has issued a set of guidelines on Advertisement by Mutual Funds vide Circular No. MFD/CIR/4/51/2000 dated June 05, 2000, which state that:
i. In case of Money Market schemes or cash and liquid plans, wherein investors have very short investment horizon, the performance can be advertised by simple annualization of yields.
ii. In all other cases, only compounded annualized yield shall be advertised.
Duration:
The term Duration in the world of fixed income investment is used differently than as used commonly. What you commonly refer to as duration is referred to as ‘maturity’ in fixed income markets.
Now let’s understand the concept of duration. A fixed income security such as a bond usually provides a stream of cash flows until it matures. These cash flows consist of coupon payments and principal repayment. Duration is the weighted average of the time until each of these cash flows is received. The weights used to calculate the duration is the proportion of the present value of the cash flows on the respective dates.
To better understand what duration exactly is, let’s calculate it.
We will continue with our hypothetical bond example:
1. Settlement Date- April 1, 2011
2. Maturity Date- April 1, 2021
3. Coupon Rate- 9%
4. Price- Rs. 95
5. Redemption Value- Rs. 100
6. Present Yield to Maturity- 9.80%
7. Coupon payment- Annual
If we draw a timeline of the cash flows from this bond, it would look like this-
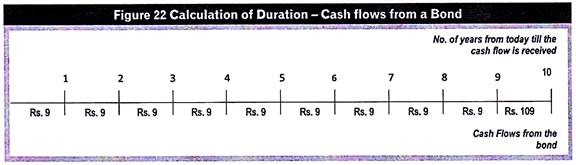
Note that although the coupon cash flows are same each year, they will differ in present value terms. In present value terms, the later you receive a cash flow, the lower is its present value.
If we take the present value of each of these cash flows using the current YTM levels of 9.80%, the cash flows in the time line above will change as below:
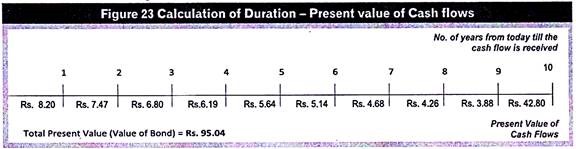
The value of the bond can be found out by adding the present value of all of the cash flows. As can be seen above, the calculated present value is Rs. 95.04 which is the prevailing market value of the bond.
If we calculate the contribution of each cash flow to the present value of the bond we get as below:
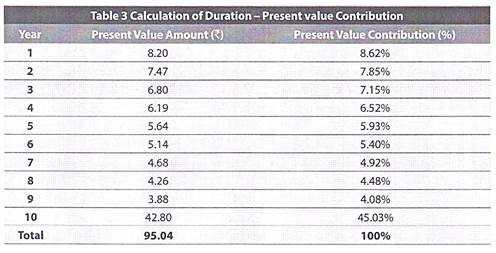
If we use this present value contribution as weights to calculate the weighted average of the number of years until receipt of each cash flow, we would get the duration of our bond-
So the duration of our bond is -6.91. Technically, the duration value would always be negative as it reflects the inverse relationship between the price and yields. However, in common trading parlance, duration is often referred without its negative sign. So, in the case of our example above, you will hear the duration being referred as 6.91. (We too have referred duration as a positive number for the sake of simplicity).
Notice that the duration is lower than the actual duration or time to maturity of our bond i.e. 10 years. This will always be the case. Since duration is the weighted average, it will always fall between the times until the first cash flow is received and until the last cash flow is received. The only exception to this rule is a zero coupon bond (ZCB). For a ZCB, duration will be the same at ‘time to maturity’.
The reason why the duration is 6.9 against time to maturity of 10 years is because, in present value terms, about 45% of our cash flow is received in the 10th year only.
The duration that we calculated above is called Macaulay Duration, named after Frederick Macaulay who developed this concept. Macaulay Duration helps us know the weighted average maturity of the bond.
There is one more concept of duration called as ‘Modified Duration’. It has more practical relevance as it measures the price sensitivity of a fixed income security to changes in interest rates.
Modified duration can be calculated from the Macaulay Duration as below:
Modified Duration= -6.91 / (1+9.80%)
Notice that we have divided the Macaulay Duration with (1+ current yield rate). If the bond pays interest more than once in a year (say, semi-annually or quarterly) we would have found and used the per period yield (by dividing the yield by 2 for semi-annual bond or 4 for quarterly bond) to calculate the modified duration.
The modified duration in our case works out to -6.30. This is slightly lower than the duration of 6.91 that we calculated earlier. However, sometimes these two concepts are used interchangeably and referred to as duration in general. Further, when you hear or see the word ‘duration’ used in any investment material it is the modified duration unless specifically stated otherwise.
All of these calculations and tables above were only to orient you to how the duration is calculated. We know you won’t sit and calculate the duration of your fixed income portfolio. It is quite likely that duration would be regularly reported to you.
Practically, duration (actually, modified duration) is used to measure the price sensitivity of a bond. In our example; a modified duration of 6.30 means that if the yields in the market were to rise by 1%, the value of the bond will fall by 6.30%. Similarly, if the market yields were to fall by 1%, the value of the bond will increase by 6.30%
Duration as a measure is not constant but will keep changing over time for two reasons:
1. As the yields in the market change, the duration will change too. This is because duration is the weighted average maturity of a bond where the weights are the present value cash flow contributions. The present value in turn is calculated using the prevailing market yields. Thus, as yields change the present value contributions or the weights will change which in turn will cause the duration to change.
2. The duration will fall as the bond itself gets closer and closer to its maturity date.
The duration of a fixed income portfolio is simply the value weighted average of the durations of investments in the portfolio. The interpretation of portfolio duration is the same as that of single bond duration.
The concept of duration is not foolproof. Some of its pitfalls are:
I. Duration can tell you the estimated change in price that could occur for a one time small change in the yields. As the extent of change in yield increases, duration loses its predictive power to estimate change in price.
II. The concept of duration ignores impact of another very important concept of fixed income products- convexity. Ignoring convexity causes the duration to underestimate the increase in price from falling yields and overestimate the fall in price from rising yields.
III. Portfolio duration is of use in explaining price change only if there is a one-time parallel shift in the yield curve. This is hardly the case in real world. Yields on bonds with different maturities in the portfolio may change differently and duration will not be accurate in predicting the change in portfolio value resulting there from.
IV. To calculate duration you need to be certain as to when the various cash flows will be received. In case of bonds with call and put options you can’t predict if and exactly when the bond will be called or put. This makes duration of a bond with call or put options more error-prone as you need to estimate the timing of cash flows.
Convexity:
Convexity as a measure is used to understand the limitations of duration. If duration is a measure of sensitivity of bond prices to changes in yields, convexity is the measure of sensitivity of duration itself to changes in yields.
Duration assumes a linear relationship between yields and prices. If duration were constant whatever be the current interest rates, the yield curve would have been a straight line. Convexity results in a curvature in the yield curve.
Computation of convexity is very complex and it is highly unlikely that it is even as widely reported as durations and yields. For this reason we have skipped the mathematical calculation process of convexity.
The key take away for you from this concept is that:
The concept of duration has theoretical limitations.
I. In a market with rising yields, duration will overestimate your loss. Taking 15% as the starting point, if the yields rose to 18%, the bond price will drop to Rs. 86.52. The duration measure indicates that price will drop to Rs. 82.69. The disparity increases for larger changes in yields.
II. In a market with falling yields, duration will underestimate your gains. If the yields were to fall to 9%, the price will actually rise to Rs. 138.51 while the price as indicated by duration would be Rs. 134.62. Again the disparity is higher for larger changes in yields.
Price Value of a Basis Point (PVBP):
Modified duration measures the percentage change in price for a 1 % change in the yield levels. PVBP is based on similar lines except that it measures the change in price for one basis point (bps) change in yields and the change in price is measured in value terms rather than percentage terms. One basis point refers to 0.01%.
PVBP as a concept is sometimes easier to apply than modified durations. This is because the change is measured in value terms which makes it quicker to find out the price change. In order to help you understand the calculation and the meaning of the concept of PVBP, we have given a numerical example below based on the market yields and prices on a government security; 9.15% GOVT.STOCK 2024 over the first 15 days of February 2012.