
Here is a term paper on ‘Capital Asset Pricing Model (CAPM)’. Find paragraphs, long and short term papers on ‘Capital Asset Pricing Model (CAPM)’ especially written for school and college students.
Term Paper Contents:
- Term Paper on the Capital Asset Pricing Model
- Term Paper on the Assumptions of CAPM
- Term Paper on the Security Market Line (SML)
- Term Paper on the Characteristic Line
- Term Paper on the Alpha Coefficient
- Term Paper on the Beta Coefficient
- Term Paper on the Beta Coefficient of a Mutual Fund
- Term Paper on the Beta Factor of a Market Portfolio
- Term Paper on the Risk-Return Trade-Off
- Term Paper on the Benefits and Limitations of CAPM
Term Paper # 1. Capital Asset Pricing Model:
William F. Sharpe and John Linter developed the capital asset pricing model (CAPM). The model is based on the portfolio theory developed by Harry Markowitz.
The model emphasizes the risk factor in portfolio theory is a combination of two risks i.e., systematic risk and unsystematic risk.
The combination of both types of risks stated above provides the total risk.
The model suggests that a security’s return is directly related to its systematic risk which cannot be neutralized through diversification.
The total variance of returns is equal to market related variance plus company’s specific variance.
CAPM explains the behaviour of security prices and provides a mechanism whereby investors could assess the impact of a proposed security investment on the overall portfolio risk and return.
CAPM suggests that the prices of securities are determined in such a way that the risk premium or excess return are proportional to systematic risk, which is indicated by the beta coefficient.
The model is used for analyzing the risk-return implications of holding securities.
CAPM refers to the way in which securities are valued in line with their anticipated risks and returns.
A risk averse investor prefers to invest in risk free securities.
A small investor having few securities in his portfolio, risk is greater.
To reduce the unsystematic risk, he must build-up a well-diversified securities in his portfolio.
A diversified and balanced portfolio of all securities will bring an investor’s systematic risk to the level of average systematic risk in the stock market as a whole.
Sharpe asserts in CAPM that risky portfolio does not pay more than the safe one.
When the systematic risk of two portfolios remain the same, to the rational investors, it makes no difference that the stocks in one portfolio are individually riskier than other stocks because successive stock price changes are identically distributed, independent of random variables.
An individual is assumed to rank alternatives in his order of preference. However, due to operating constraints like limited finance, he can avail only some of the alternatives.
As such, an individual chooses among the logically possible in the highest on his ranking. In other words, an individual acts in a way, in which he can maximize the return on his investment under conditions of risk and uncertainty.
Term Paper # 2. Assumptions of CAPM:
1. Efficient capital market exists.
2. Investors base their portfolio investment decisions on security, its expected return and standard deviation criteria.
3. Investors, may borrow and lend without limit at risk-free rate of interest.
4. Investors have identical expectations about future outcomes over a one-period time horizon.
5. All investors have the same expectations about the risk and return.
6. Market-wide influences that affect all assets to some extent, such as the state of the economy.
7. No transaction costs involved.
8. Investment goals of investors are rational.
9. Investors desire higher return for any acceptable level of risk or the lowest risk for any desired level of return.
10. Capital markets are in equilibrium.
11. There are no market imperfections.
12. Investments are infinitely divisible, information is cost less, there are no taxes or interest rate changes and there is no inflation.
13. Investors are risk averse and maximize expected utility of wealth.
14. Capital market is not dominated by any individual investors.
15. Securities or capital assets face no bankruptcy or insolvency.
Term Paper # 3. Security Market Line (SML):
The SML expresses the basic theme of the CAPM i.e., expected return of a security increases linearly with risk, as measured by ‘beta’.
The SML is an upward sloping straight line with an intercept at the risk free return securities and passes through the market portfolio.
The upward slope of the line indicates that greater excepted returns accompany higher levels of beta.
In equilibrium, each security or portfolio lies on the SML.
An investor will come forward to take risk only if the return on investment also includes risk premium.
CAPM provides an intuitive approach for thinking about the return that an investor should require on an investment, given the assets systematic or market risk.
Figure 11.3 shows that the return expected from portfolio or investment is a combination of risk free return plus risk premium.

CAPM shows the risk and return relationship of an investment in the formula given below:
E(Ri) = Rf + βi (Rm – Rf)
Where,
E(Ri) = Expected rate of return on any individual security (or portfolio of securities)
Rf = Risk free rate of return
Rm = Expected rate of return on the market portfolio
Rm – Rf = Risk premium
Βi = Market sensitivity index of individual security (or portfolio of securities)
Illustration 1:
Mercury Holdings Ltd., an investment company has invested in equity shares of a blue chip company.
Risk free return (Rf) = 10%
Expected total return (Rm) = 16%
Market sensitivity index (βi) = 1.50 (of individual security)
Calculate the expected rate of return on the investment made in the security.
Solution:
Total expected return (Rm) = 16%
Risk free return (Rf) = 10%
Risk premium (Rm – Rf ) – 6%
E(Ri) = Rf + βi (Rm – Rf) = 10 + 1.50 (16 – 10) = 19%
Illustration 2:
Rm = 16%
Rf = 9%
βi = 0.8
Calculate the expected return on portfolio.
Solution:
E(Ri) = Rf + βi (Rm – Rf) = 9 + 0.8 (16 – 9) = 14.6%
Term Paper # 4. Characteristic Line:
A line that best fits the points representing the returns on the assets and the market is called ‘characteristic line’ as shown in figure 11.4.
The slope of the line is the beta of the asset which measures the risk of a security relative to the market.
Beta coefficient (β) describes the slope of the characteristic line and so indicates the degree to which the individual security’s risk premium reacts to changes in the market portfolio’s risk premium.
The greater the beta coefficient value, the greater the slope of the characteristic line, greater the systematic risk for an individual security.
The slope of the characteristic line (regression line) is obtained statistically and it shows the relationship of an individual security with the market.

It is observed from the graph that greater the expected return for the market, the greater the expected excess for the stock.
The characteristic line equation for the individual security is given below:
(Ri – Rf) = αi + βi (Rm – Rf)
In the above equation, (Ri – Rf) and (Rm – Rf) are pairs of observations (for example monthly observations) of return in the security over risk free rate and expected return on market portfolio over risk free rate. The model is widely used for evaluating stock market investments.
Term Paper # 5. Alpha Coefficient:
The alpha coefficient (α) gives the vertical intercept point of the regression line.
In a perfect world, the alpha for an individual stock should be zero and the regression line should go through the graph’s origin where the horizontal and vertical axis crosses.
If the alpha were positive, the opposite equilibrium process would occur; investors would rush to buy the security which cause the price of the security to rise and the expected rate on it to fall.
Term Paper # 6. Beta Coefficient:
The risk of an individual security can be estimated under CAPM model.
The market related risk which is also called as ‘systematic risk’ is unavoidable even by diversification of the portfolio.
The systematic risk of an individual security is measured in terms of its sensitivity to market movements which is referred to as security’s beta (βi).
Investors can avoid or eliminate the unsystematic risk by investing funds in wide range of securities and by having well diversified portfolio.
Beta coefficient is a measure of the volatility of stock price in relation to movement in stock index of the market, therefore, beta is the index of systematic risk.
![]()
Where,
βi = Beta of individual security
Covim = Covariance of returns of individual security with market portfolio
Varm = Variance of returns of market portfolio (σm2)
Corim = Correlation coefficient between the returns of individual security and the market portfolio
σi = Standard deviation of returns of individual security
σm = Standard deviation of returns of market portfolio
According to the CAPM, in equilibrium, the expected return of a portfolio is equal to the risk free rate plus a risk premium, which is proportional to its beta.
A beta coefficient is a relative measure of the sensitivity of an assets’ return to changes in the return on the market portfolio.
Mathematically, the beta coefficient of a security is the security’s covariance with the market portfolio divided by the variance of the market portfolio.
The beta factor is the measure of volatility of systematic risk of a security or investment in the portfolio.
The beta factor of the market as a whole is 1.0.
A beta of 1.0 indicates average level of risk while more or less than that the security’s return fluctuates more or less than that of market portfolio.
A zero beta means no risk.
The degree of volatility is expressed as follows:
(i) If beta is more than one, it is more sensitive to the market or systematic risk than the average investment.
(ii) If the beta is one, then it has the same risk profile as the market as a whole, the average risk profile.
(iii) If the beta is less than one, it is not as sensitive to systematic or market risk as the average investment.
Term Paper # 7. Beta Coefficient of a Mutual Fund:
Beta determines the volatility or risk of a fund in comparison to that of its index or benchmark.
A fund with a beta very close to 1 means the fund’s performance closely matches the index or benchmark.
A beta greater than 1 indicates greater volatility than the overall market and beta less than 1 indicates less volatility than the benchmark.
An investor can select funds with a high betas, which increase your chances of beating the market.
Also if the market is bearish, the funds that have betas less than 1 are good choice because they would be expected to decline less in value than the index. Market risk is measured by beta.
Beta relates the return of a stock or mutual fund to a market index.
It reflects the sensitivity of the fund’s return to fluctuations in the market index:
![]()
Where:
Cov(Ir MFr) = Covariance between the index’s return and mutual fund scheme’s return Var(Ir) = Variance in the index return
CAPM asserts that the risk is directly related to the earnings stability of a company and its securities.
A company with relatively stable earnings will have a low beta value.
A company with unstable earning flow will have a high beta value.
The degree of systematic risk would be more if the company’s earnings are more volatile.
The total variance of returns of a company is equal to the market related variance plus company’s specific variance.
CAPM indicates the expected return of a particular security in view of its systematic or market risk.
The value of a share price is determined in relation to investment in shares of individual companies, rather than as a portfolio.
In practice, for estimation of beta factor the following regression equation is used:
Ri = αi + βi Rm + ei
Where:
Ri = Rate of return of individual security
αi = The intercept that equals the risk free rate (Rf)
βi = Beta factor of the individual security
Rm = Market rate of return
ei = Random error, which reflects the diversifiable risk of individual security
Illustration 3:
From the following information, calculate the expected rate of return of a portfolio:
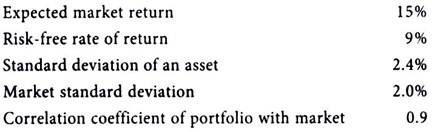
Solution:
Calculation Market Sensitivity Index (βi)
Since, market sensitivity index is not given in the problem, it is calculated by applying the following formula:
![]()
Where:
βi = Market sensitivity index or Beta factor
σi = Standard deviation of an asset i.e., 0.024
σm = Market Standard deviation i.e. 0.02
rim = Correlation coefficient of portfolio with market i.e. 0.90
βi = 0.024/0.02 × 0.90 = 1.08
Now we can calculate the expected rate of return of a portfolio by applying Capital Asset Pricing Model:
E(Ri) = Rf + βi (Rm – Rf)
Where:
E(Ri) = Expected rate of return of portfolio
Rf = Risk free rate of return i.e., 9%
Rm = Expected return of market portfolio i.e., 15%
βi = Beta coefficient of investment i.e., 1.08
By substituting, we get:
E(Ri) = 9 + 1.08 (15 – 9)= 9 + 1.08(6)= 15.48 or 15.48%
Term Paper # 8. Beta Factor of a Market Portfolio:
If the return from the market portfolio rises or falls, we should expect a corresponding rise or fall in the return from an individual share.
The amount of this corresponding rise or fall depends on the beta factor of the share.
The beta factor of an investor’s portfolio is the total of the weighted average beta factors of each security in the portfolio.
As the market portfolio represents all shares on the stock market, it follows that the beta coefficient of the market portfolio must be 1, and all other betas are viewed relative to this value.
Thus, if the return from the market portfolio rise by say 2%, the coefficient would be:
![]()
Illustration 4:
Star Finwest Limited, a mutual fund manager having highly sensitive securities in his portfolio. Its return on securities will vary twice the average market returns.
Suppose, if the market went up or down by 5%, then the returns on the securities of the above investor will increase or decrease by 10%. The beta factor of securities of the mutual fund investments is 2.0.
Illustration 5:
Citizen Welfare Fund Ltd. a pension fund management organization has invested in less risk securities which are less volatile to the market movements.
Suppose, if the market index moves by 5% on either side, the market price of securities in the portfolio will increase or decrease only by 2.5%, then the beta factor of Pension fund securities is 0.5. The expected return and Beta of all investment in a portfolio is the weighted average of return and betas of all securities in the portfolio.
Illustration 6:
If stock A has a beta of 1.6 and stock B has a beta of 1.2. They make-up the portfolio in the ratio of 70:30.
The beta of the portfolio would be:
![]()
Illustration 7:
Kamath Portfolio Ltd. has three investments in its portfolio. Its details are given below:
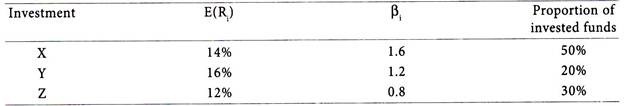
Calculate the weighted average of expected return and Beta factor of the portfolio.
Solution:
Weighted Average of Expected Return of the Total Portfolio:
![]()
Weighted Average Market Sensitivity Index of the Total Portfolio:
![]()
Illustration 8:
If an investor holds a portfolio consisting of:
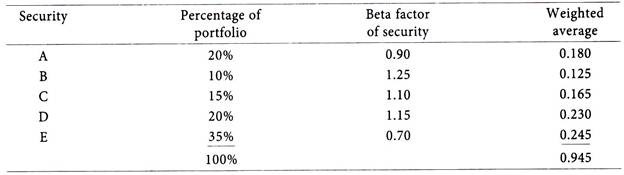
The beta factor of this portfolio would be 0.945.
Holding a portfolio with a beta factor of 0.945 is equivalent to an investor holding 94.5% of his investment in the average market portfolio and 5.5% of his investment in risk-free securities. Assuming the risk-free rate of return is 12% and the average market portfolio return is 20%, the expected return from the portfolio would be: = (0.945 × 20%) + (0.055 × 12%) = 18.9% + 0.66% = 19.56%.
The investor in the portfolio of shares should therefore expect a return of 19.56% and if diversification has completely eliminated unsystematic risk the actual return will also be 19.56%.
Term Paper # 9. Risk-Return Trade-Off:
The risk-return trade-off point can be calculated by applying the following formula:
![]()
Where:
Rm = Market rate of return
Rf = Risk free return
σm = Standard deviation of returns of market portfolio
Ri = Rate of return on individual investment
Illustration 9:
The beta coefficient of security ‘A’ is 1.6. The risk free rate of return is 12% and the required rate of return is 18% on the market portfolio. If the dividend expected during the coming year is Rs.2.50 and the growth rate of dividend and earnings is 8%, at what price should the security ‘A’ can be sold based on the CAPM.
Solution:
Expected Rate of Return is calculated by applying CAPM formula:
![]()
Price of security ‘A’ is calculated with the use of dividend growth model formula:
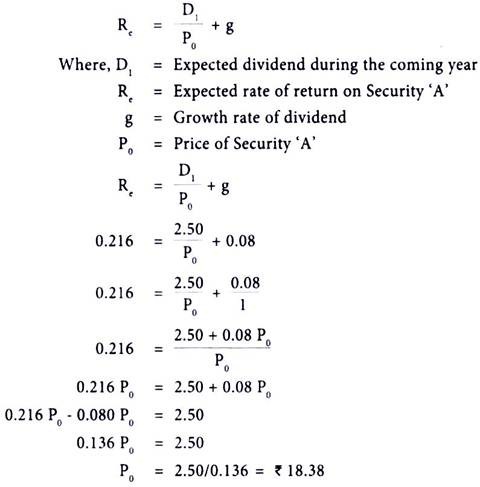
Term Paper # 10. Benefits and Limitations of CAPM:
Benefits:
1. Investors can estimate the required rate of return on a particular investment in company’s securities.
2. Investments in risky projects having real assets can be evaluated of its worth in view of expected return.
3. CAPM analyses the riskiness of increasing the levels of gearing and its impact on equity shareholders returns.
4. CAPM suggests the diversification of portfolio in minimization of risk.
Limitations:
1. In real world, assumptions of CAPM will not hold good.
2. In practice, it is difficult to estimate the risk free return, market rate of return, and risk premium.
3. CAPM is a single period model while most projects are often available only as large indivisible projects. It is therefore more difficult to adjust.