
William Sharpe (1964) published the Capital Asset Pricing Model (CAPM):
According to CAPM, return of a portfolio is equal to the sum of risk-free rate of return and a risk premium that is proportional to its beta. As per this model, risk and return are linearly associated.
Ri = Rf+ βi (Rm-Rf)
ADVERTISEMENTS:
Where,
Ri = Risk free rate of return
Rm = Return on market portfolio
βi = Beta coefficient of security i
ADVERTISEMENTS:
Rf = Expected return on security i
CAPM is based on the following assumptions of a simplified world:
1. Investors’ objective is to maximize utility of wealth.
2. There is a risk free asset, and investors can borrow and lend unlimited amounts at the risk free rate.
ADVERTISEMENTS:
3. There are no taxes or transaction costs.
4. Securities markets are efficient
5. All investors have the same expectations about the expected returns and risks of the securities.
6. A single period is considered (Identical time horizon)
ADVERTISEMENTS:
7. Investors make their choice on the basis of risk and return. They choose only those portfolios with the highest rate of return for a preferred level of risk or lowest risk for a preferred level of return.
8. Investors make only efficient portfolios i.e. they eliminate unsystematic risk by diversification.
CAPM decomposes a portfolio’s risk into systematic and unsystematic risk as shown in figure 6.3. Thus,
Total Risk = Systematic Risk + Unsystematic Risk

Specific Risk (Unique Risk or Unsystematic Risk or Diversifiable Risk):
It means risks associated with a specific firm. These types of risks affect a firm specifically and not all the firms in general. This can be easily understood in context of development of a new product, labor strike, emergence of a new competitor, etc. Unsystematic risk can be reduced through diversification so that a single event affects only a limited number of the assets. This supports the adage, “Don’t put all of your eggs in one basket.”
Types of Specific Risk:
1. Business Risk:
It is the risk in the operations of a company. Such a risk is more related to the smooth and profitable functioning of the business:
ADVERTISEMENTS:
The variability in demand for its products, variability in the input cost, operating leverage, variability of sales price are the vital factors which determine the business risk of an organization. Competition also causes a fall in the market share of the company due to the entry of new products. Poor management is a business risk which can be avoided by changing the board of directors. Example – The recent Satyam Company Scam (2009-2010).
2. Financial Risk:
Financial risk is related to the structuring of the finances of an organization. Such a risk will vary with the nature and type of investment. Financial risk is a function of the financial leverage which is the use of debt in the capital structure. This financial risk increases greatly when a certain organization decides to use debt from financial institutions for business expansion along with equity financing.
The fixed interest payments on debt capital create more variability in the earnings per share (EPS) available to equity shareholders. If the interest outgo increases, it leads to reduction in EPS, thus a negative effect on share prices. This is an example of avoidable risk.
ADVERTISEMENTS:
3. Systematic Risk or Non-Diversifiable Risk or Non-Controllable Risk or Market Risk:
It refers to risks associated to economy wide factors like growth rate of GNP (Gross National Product), the inflation rate, interest rate, etc. This results in an effect on the overall economy. All the companies and thereby their stock prices get affected due to it. However, the effect may vary across different companies based on their sector.
Following are some examples of the systematic risk:
a. Interest Rate Risk:
Variations in interest rate directly affect fixed income paying securities like bonds but indirectly affects shares. For example – if the interest rate on existing bond is 9% and the market interest goes to 11%, the price of the existing bond would decline, because the bond holder would sell his bond and invest in securities paying 11% and vice versa.
Many companies use borrowed funds to finance their operations. When interest rates move up, companies have to borrow at high rates and thus high interest outgo leading to low earnings for equity shareholders. Thus resulting in low stock prices.
ADVERTISEMENTS:
b. Market Risk:
This refers to the variation in returns caused by the volatility of the stock market movements. Market prices of shares move up or down consistently for some time periods. A general rise in share prices is referred as a bullish trend while fall in share prices is referred to as bearish trend. Business cycles are considered to be a major determinant of the timing and extent of the bull and bear phases of the market.
During this bullish or bearish phase, stocks of almost all companies will rise or fall, irrespective of their sector or financial performance. This is also caused due to sweeping changes in the investors’ expectations during the bullish or the bearish trend.
c. Purchasing Power Risk:
When a stock is bought, it is an investment for the purchaser. He is actually postponing his consumption. In the meantime, if the prices of goods and services increase due to inflation, the investor would experience a decline in the purchasing power of his investments and the return from his investments. This is known as purchasing power risk and its impact is felt on all the securities in the security market. Thus, it represents a systematic risk.
Measurement of Risk:
ADVERTISEMENTS:
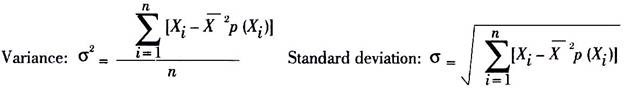
The most popular measurement of risk is the variance or standard deviation of the possible returns.
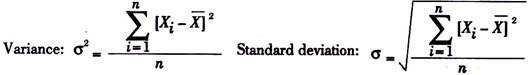
If the probability distribution of returns is given, then risk is the variance or standard deviation of the probability distribution of possible returns.
Pricing of Securities as per the CAPM Model:
Expected rate of return = Risk free rate + Beta * (Market Risk Premium)
R̅i = Rf + βi (R̅m – Rf)
ADVERTISEMENTS:
R̅i = Returns of the individual security
Rf = Returns of risk-free security
βi = Beta of the security
R̅m = Returns of the market
This relationship between the expected returns and beta of a security or portfolio can be plotted graphically. This is called as Security Market Line (SML). SML is the graphical representation of CAPM.
Let us consider a graph as seen in Figure 6.4 where expected returns are plotted on the y axis and beta coefficients are plotted on the X axis. A risk free asset has an expected return equivalent to Rf and Beta coefficient of zero. The market portfolio M has a Beta coefficient of one and expected return equivalent to R̅m. A straight line joining these two points is known as the security market line (SML).

Another graph which is used to evaluate the risk of a portfolio is Capital Market Line (CML) as shown in Figure 6.5.
 and Portfolio Risk")
CML is a linear efficient frontier passing from risk free return through market Portfolio. All portfolios lying along the CML are efficient portfolios.
Capital market line is the tangent line to the efficient frontier that passes through the risk-free rate on the return axis.
Difference between CML and SML:

Drawbacks of CAPM:
ADVERTISEMENTS:
i. Beta calculation is a very tedious job requiring a lot of data.
ii. The assumptions of CAPM are hypothetical and are impractical.