After reading this article you will learn about the bar chart and its limitations.
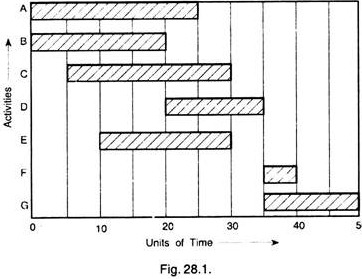
A pictorial chart, also known as the “Bar Chart” was for the first time developed by Henry Gantt around 1900 and is used to deal with complex activities. The bar chart consists of two coordinates, the horizontal represents the time elapsed and the vertical represents the job or activities performed. The jobs or activities are shown in the form of bars shown in Fig. 28.1.
The length of the bar shows the time the job or that activity takes for completion. In every project, some jobs are taken up concurrently and some are to be completed before others can begin. Hence in a bar chart, some of the bars run parallel or overlap each other time-wise and some run serially with one bar beginning after another bar ends.
ADVERTISEMENTS:
In Fig. 28.1 example, activities A and B can start at the same time and proceed concurrently or in parallel, though they take different time intervals for their completion. Activity C begins 5 days after the start of activity A and B. Activity D cannot be started until activity B is over. The bars representing B and D therefore run serially.
Let us consider few examples of Bar Charts:
Example 1:
Equipment consists of three parts A, B and C. These are assembled together after manufacture. Part A is of cast iron which requires a pattern and a mould, Part B is to be machined on a special machine and hence special machine is to be purchased and erected.
ADVERTISEMENTS:
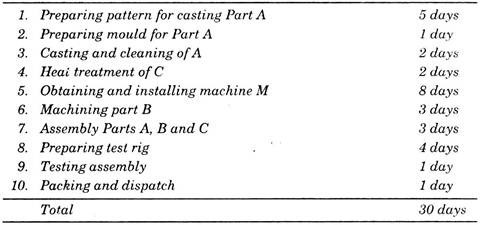
Part C needs special heat treatment before assembly. The assembly has to be tested with a specially fabricated rig before dispatch. The time needed by each activity is given below. Draw the bar chart.
Solution:
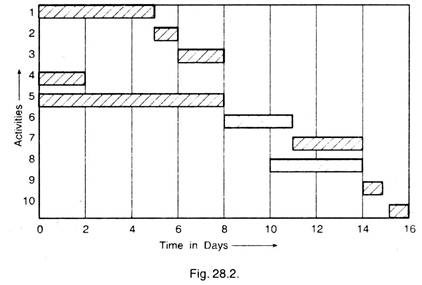
The bar chart for this example is given in Fig. 28.2.
From the study of the various activities, it is found that activity 1, 4, 5 and 8 can be started concurrently, i.e., at the same time. These have been indicated in the bar chart. Activity 2 begins after the completion of activity 1. Similarly activity 3 begins after the completion of activity 2. Bar chart shows that activity 6 can begin when the activity 5 is over and activity 7 begins when activity 6 is over.
Similarly activity 9 can begin when activity 8 is over and activity 10 can begin when activity 7 is over. From the bar chart, it is found that project completion time is 16 days, although total time required by all the activities is 30 days. In this way bar chart gives information, when and where the various activities should be started and end so that project completion time is minimum.
Example 2:
Draw a bar (Gantt) chart for the following examination work:
Solution:
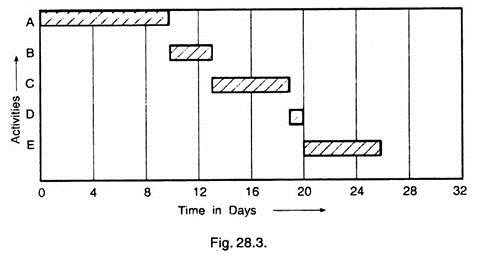
All the above activities are independent and in the order of sequence. The total duration is 26 days. The Gantt chart can be drawn as shown in Fig. 28.3.
Example 3:
ADVERTISEMENTS:
Draw the bar chart for the following drawing and printing Work:
Solution:
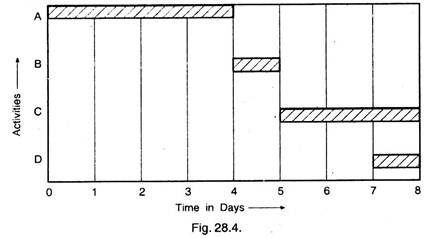
ADVERTISEMENTS:
Here in this problem, activity A, B and C are independent. It means activity B will begin when activity A is over and activity C will begin when activity B is over. Activity D consumes 1 day and this can be started simultaneously with activity C, on the 8th day and thus project completion time will be 8 days. Thus one day can be saved in this way.
Example 4:
Draw a bar chart for making a chair.
The details of activities are as under:
ADVERTISEMENTS:
(i) Make dimensional sketches of parts – 2 days
(ii) Make legs – 2 days
(iii) Make seat – 3 days
(iv) Make back – 3 days
(v) Assemble parts – 2 days
Solution:
ADVERTISEMENTS:
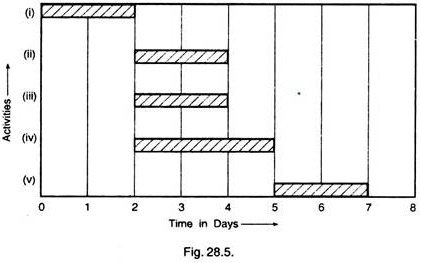
In this problem after activity (i) is over, activities (ii), (iii) and (iv) can be started at the same time, i.e., concurrent activities. These activities are independent one. Therefore project completion time will be 2 + 3 + 2 = 7 days. Bar chart will be as shown in Fig. 28.5.
Limitations of a Bar Chart:
A bar chart may appear to be an excellent pictorial representation of the project, but in actual practice, these have serious limitations.
A few of the limitations are:
1. In any project, there are large numbers of activities which can be started with a certain degree of concurrency; the bar chart cannot indicate clearly the independencies among the various activities. This is a major limitation. The mere fact that two or more activities are scheduled for simultaneous overlapping times do not always make them related to interdependent or completely independent.
ADVERTISEMENTS:
Suppose in example 2, activities, such as preparing a pattern, preparing a mould, casting and cleaning and heat-treating have to run serially i.e., one activity must be completed before the other can start.
The bars representing the activities are not allowed to overlap. While installing machine M and preparing the test rig can start concurrently because they are completely independent activities and therefore the bars showing them can run parallel to each other. This is the weakness of the bar chart because two parallel bars need not always stand for independent activities as the following example will show.
Suppose a project requires digging foundation, erecting shuttering and pouring concrete.
Digging foundation = 20 days
Erecting shuttering = 10 days
Concreting = 12 days
ADVERTISEMENTS:
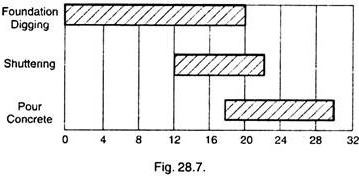
If the activities are not allowed to run in parallel but in strict sequence, the total time to complete the project will be 42 days. But here, it can be seen that erection of shuttering can be started after the 12 days’ work of foundation digging.
In the same way, pouring of concrete can begin say, 5 days after the erection of side boards. The bar chart for this is shown in Fig. 28.7. According to this plan, the side board erectors still have 2 days of work after the digging work is over.
If due to some unexpected difficulties the digging work is delayed by 8—10 days, how will this reflect on the shuttering or concrete pouring jobs? This is not indicated by the bar chart.
2. The bar chart does not indicate the progress of work; hence it cannot be used as a control device. In a dynamic programming, the knowledge of the amount of work in progress or work completed is very essential. Usual changes in plans are a necessary part of a large project and a bar chart gives much assistance under such circumstances.
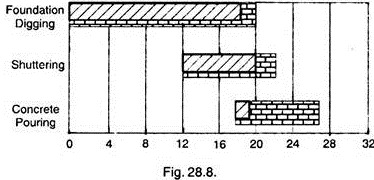
However, a conventional bar chart can be modified to give this additional information as shown in Fig. 28.8. Suppose 18 days have passed after the project started, the progress made in the project can be obtained by partially filling in the blank bars.
ADVERTISEMENTS:
Foundation digging is one day behind the schedule and concreting is also two day behind the schedule.
3. The third most important limitation of the bar chart is that it cannot reflect the uncertainty, or tolerances in the duration of times estimated for various activities. There are a number of uncertain activities, such as modern day space system or other complex projects are largely characterized by extensive research, development and technological progress.
In such programmes, the completion of various stages of jobs cannot be forecasted with exactness. In these programmes, rescheduling of various events is a necessary part of the project but this is not reflected by a bar chart.
