After reading this article you will learn about the meaning and uses of travel chart.
The chart which gives an estimate about the amount of materials handling between various work stations is known as “Travel Chart”. The aim in the construction of Travel Chart is to decide such a layout where overall materials handling function is performed at a minimum cost.
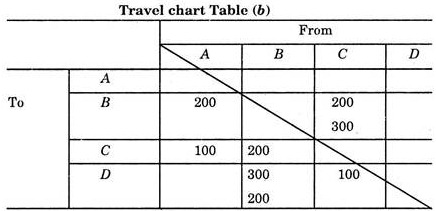
(i) The first step in the construction of this chart is to make the list of work stations along the heading and down the stub of the table as shown in table (b).
(ii) The next step is to establish a basic measure to indicate the amount of materials handling to be done between each work station. If all the parts are nearly of the same size, then number of parts to be moved from one work station to the next may be a satisfactory measure of the materials handling task. In other cases, we may use the physical volume of parts.
ADVERTISEMENTS:
As an example of Travel Chart, suppose there are three parts to be manufactured in four different shops. The required information for these parts is given in Table (a).
The information in Table (a) such as “Number of loads” is collected from an analysis of the annual or monthly production, and the processing sequences such as A, B, C, D, etc., are collected through various route sheets.
From Table (a), one finds that 200 loads of Product I are moved from Machine Group A to Machine Group B. In order to draw a travel chart, the figure 200 is entered in the square representing movements from Group A to Group B as shown in Table (b). Similarly figure 200 is entered in the square BC to represent its movement from Group B to C. Again figure 200 is entered in square C B and B D to represent its movement from Group C to B and B to D respectively.
In the similar way Table (b) is completed for part number II and III. This travel chart shows that total movement for the load between B and C is 700. This 700 shows that 200 load moved from B to C and 500 moved from C to B. Further, it gives that 200 load moved from A to B, 100 from A to C, 500 from B to D and 100 from C to D.
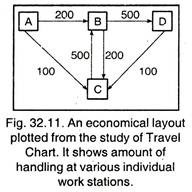
From this; it can be concluded that from materials handling point of view shops B and C be adjacent. Also shop D should be located close to shop B. It is less important that shops A and B, A and C, and C and D be adjacent.
With this information the planning departments proceed to locate individual work stations on the drawing. Much planning and rearranging still may be needed at the final stage of layout planning. In this case the desired economical layout will be as shown in Fig. 32.11.
Use of Travel Chart:
1. To analyse material handling, and plan department locations.
ADVERTISEMENTS:
2. To compare layouts and to determine their efficiency.
3. To plan materials handling procedure and routes.
4. To shorten manufacturing cycles.
ADVERTISEMENTS:
5. To reduce work in process.
6. To reduce labour costs.
7. To assist in improving materials handling procedure.
8. To determine relative self-sufficiency of various areas.
ADVERTISEMENTS:
9. To determine inventory control difficulties.
10. To make economical use of available areas.


