
Everything you need to know about how to do marketing research. Marketing research is the process of gathering, recording and analyzing of critical and relevant facts about any problem in any branch of human activity.
Marketing Research indicates critical and searching study and investigation of a problem, a proposed course of action, a hypothesis or a theory. It is a systematic, objective and intensive search for and analysis of the data (facts and figures) relevant to the identification and solution of any problem in the field of marketing.
A: The marketing research process consists of the following heads:-
1. Problem Definition 2. Development of an Approach to the Problem 3. Research Design Formulation 4. Sampling Plan 5. Data Collection 6. Data Preparation and Analysis 7. Preparation of Report.
ADVERTISEMENTS:
B: The Marketing research process is a set of eight steps which defines the tasks to be accomplished in conducting a marketing research study. These are:-
1. Defining the Marketing Problem to be Tackled 2. Identifying Marketing Research Problems Involved in the Task 3. Specifying the Information Requirement 4. Developing Research Design and Research Procedure 5. Gathering Information 6. Analyzing and Interpreting Information 7. Preparing Research Report 8. Follow Up Recommendations.
C: Marketing research involves the following stages:-
1. Defining the Objectives 2. Determining the Research Level 3. Determining the Research Approach 4. Collecting the Data 5. Analyzing the Results 6. Reporting the Findings.
ADVERTISEMENTS:
Doing your own market research isn’t difficult, although it does tend to be time consuming. If you own a small business, you’re probably researching your markets continually informally. Every time you talk to a customer about what he or she wants, or chat with a supplier or sales rep, you’re conducting market research.
Marketing Research – Process, Steps and Stages (with Calculations and Formula)
How to do Marketing Research – Process
The marketing research process consists of the following steps:
Process # 1. Problem Definition:
The first step in marketing research is to clearly define the marketing problem for which the solution is being sought. Before proceeding with the research, the management should know the objectives or the goals that are to be achieved through the process.
The researcher should determine the purpose of the study, the type of information needed, how the information will aid in decision-making, etc. Some exploratory research may be conducted in order to define the problem more precisely.
ADVERTISEMENTS:
For example, if the organization is planning to launch a new product, then it may conduct some exploratory research in form of customer interviews, review of market trends for the particular product category, etc.
Process # 2. Development of an Approach to the Problem:
Once the problem has been defined, the next step is to develop an approach or theoretical framework for the research. This includes determining the hypotheses, formulating the research questions and developing an analytical model for conducting the research. An approach can be developed through discussions with industry experts, case studies, analysis of secondary data, etc.
Process # 3. Research Design Formulation:
A research design is a framework for conducting the marketing research project. The research design outlines what data is to be collected, from whom it is to be collected, when it is to be collected and how it will be analysed once it has been gathered.
It basically deals with the following issues:
ADVERTISEMENTS:
(i) What type of data is to be gathered (primary or secondary)?
(ii) What are the sources from which data is to be gathered?
(iii) Hypotheses formulation and testing.
(iv) Evaluating the quality of secondary data and secondary data analysis.
ADVERTISEMENTS:
(v) What type of research design is to be used (exploratory, descriptive or causal/experimental research design)?
(vi) Methods of collecting primary data (survey, observation and experiments).
(vii) Measurement and scaling procedures.
(viii) Questionnaire design and testing the questionnaire.
ADVERTISEMENTS:
(ix) Sampling plan and sample size.
(x) Data analysis.
Process # 4. Sampling Plan:
A sample is a subset of individuals from within a population that is representative of the entire population. It is never feasible to study the entire population, so a small group of people is selected for the study.
The researcher has to decide what constitutes the population or the universe (for example, college students, working women, small kids, etc.). He also has to decide the size of the sample (for example- 100 college students, 500 small kids, etc.).
ADVERTISEMENTS:
The sample size depends upon a number of factors like the problem at hand, the budget and time constraints. Sampling has to be done very cautiously as an error in sampling can distort the results of the entire study. The chances of sampling error are more when a large sample is to be studied.
Some common sampling techniques:
(i) Simple random sampling
(ii) Convenience sampling
(iii) Stratified sampling
(iv) Systematic sampling
ADVERTISEMENTS:
(v) Cluster sampling
(vi) Sequential sampling
(vii) Disproportional sampling
(viii) Judgmental sampling
(ix) Snowball sampling
(x) Quota sampling
Process # 5. Data Collection:
ADVERTISEMENTS:
This involves the actual field work and collection of data from the selected sample. The primary marketing research data can be collected in a number of ways, the most common being surveys, personal interviews, observation and laboratory experiments. The staff collecting the data should be well trained in order to minimise the errors in data collection.
Process # 6. Data Preparation and Analysis:
The data so collected has to be verified, edited, and coded. Each questionnaire or observation form is inspected for any mistakes and codes are assigned to represent each response to each question in the questionnaire.
Then the data is sorted, transcribed and fed into computer. After this, the data is analysed using statistical software, specially designed for research purposes.
Computer programmes are used to tabulate and calculate the basic results of the research, such as the total number of participants, composition of respondents on basis of demographics like sex, age, etc., the most common answers chosen by the respondents, the least chosen response, etc.
Averages, percentages, statistical measures like mean, median, standard deviation, etc. are also calculated for each question. The information generated from the analysis can be used to draw general conclusions about the consumer behaviour or preferences.
Process # 7. Preparation of Report:
The entire process of marketing research has to be documented in the form of a report. The report should detail the research problem, the research design, methods of data collection, procedure of data analysis, the results and major findings.
ADVERTISEMENTS:
The report should be presented in a format that is easy to read, and can be readily used as a reference for decision-making. Graphs, figures and tables should be used to improve the presentation and impact.
Normally, the given format is used while preparing reports:
(i) Title Page.
(ii) Table of Contents.
(iii) List of Illustrations.
(iv) Executive Summary.
ADVERTISEMENTS:
(v) Research Objectives.
(vi) Methodology and Limitations.
(vii) Findings.
(viii) Recommendations.
(ix) Appendices containing copies of questionnaires, etc.
How to do Marketing Research – Steps
The Marketing research process is a set of eight steps which defines the tasks to be accomplished in conducting a marketing research study.
ADVERTISEMENTS:
These are discussed below:
Step # 1. Defining the Marketing Problem to be Tackled:
The researcher, in order to carry out the research, must be clear about what is needed. The basic problem, that is marketing problem, must be given importance instead of the marketing research problem. Clear understanding of the problem is essential.
Step # 2. Identifying Marketing Research Problems Involved in the Task:
Most marketing management problems are tip of the iceberg. When probed further, they lead to the real investigative research problem. The foremost task in the problem discovery stage is to transform the marketing problem into a marketing research problem by looking at the context of the problem, the observations of the market and the exploration of the problem by putting up questions to the original problem.
Step # 3. Specifying the Information Requirement:
The researcher must very clearly decide what kind of information is required and what information is irrelevant to the research.
In deciding the information needed, the objective of research must be given due consideration. The information must be necessary, relevant and sufficient. If any of the above mentioned three criteria are not fulfilled, fresh data must be sought.
Step # 4. Developing Research Design and Research Procedure:
The problem discovery and consequently marketing problem definition is an incomplete process unless the broad dimensions of marketing research design are considered.
One of the following three marketing research approaches may be selected:
(a) Exploratory Research:
This approach is selected when there is little information available regarding the problem. In such a situation it is imperative that such information be explored and found out.
(b) Descriptive Research:
If the researcher is aware of the availability of relevant information then all that is required of him is to assimilate and compile the information and then describe the relationship between the marketing problem and the available information.
(c) Causal Research:
Such a research attempts to establish a cause-effect relationship among variables being explored. If the marketing researcher gets signal from the top management that there should be clearly defined effect from the proposed solution then causal research must be undertaken.
Research procedure involves the following steps:
(i) Determination of marketing research design.
(ii) Selection of Research Methods:
To conduct marketing research, the marketing research department may collect information either from primary sources through field surveys, observation or experimentation or through secondary sources including publications, books, journals, data from research institutions etc.
(iii) Selection of Sample Design:
Most researches would be conducted on a small representative sample instead of the entire population. This happens due to cost constraints and limitation of time.
It is important that the samples be selected carefully and with due consideration to organisational objectives.
Step # 5. Gathering Information:
Once the problem has been defined and the procedures decided, then the plans have to be implemented. The first stage of implementation is collection of information.
Step # 6. Analysing and Interpreting Information:
After collecting data, it must be tabulated and classified. Proper and logical classification gives greatest value in the interpretation work. Also it is easier to convert such data into a computer usable format.
Data analysis process involves the use of appropriate statistical techniques in order to know the meaning of the data collected.
Different Types of Analysis are:
(a) Univariate Analysis:
The purpose is to look at one variable at a time. This is the process of generating information from techniques like mean, median, mode, standard deviation etc.
(b) Bivariate Analysis:
When two variables are examined at a time, it is known as Bivariate Analysis. Such tools include correlation, regression etc.
(c) Multivariate Analysis:
Analysis of three or more variables at a time. Techniques used for such analysis includes multiple regression, variance analysis, cluster analysis etc. After collecting, tabulating and analysing data we must draw conclusions that are relevant to the problem defined at the first stage. Interpretation provides specific meaning to the data and helps convert them into information.
Step # 7. Preparing Research Report:
The conclusions, recommendations and suggestions drawn from the research must be written in a structured and organised form. All these must also be supported by detailed analysis of findings. Language of such a report must be clear and properly paragraphed.
Step # 8. Follow Up Recommendations:
Follow up will ensure the implementation of recommendations made by the marketing research. If this is not done then recommendations may not be implemented.
How to do Marketing Research – Stages
The stages involved in marketing research is as follows:
Stage # 1. Defining the Objectives:
This is the most important stage of all market research, and the one at which the research is most likely to be misdirected. Only the client can know the problem area that he or she wants the research to investigate. However, problem identification can be a great challenge. All too often, symptoms are mistaken for problems, and, as a result, research programs are developed that chase shadows instead of substance.
An instance of such a mistake would be research conducted by Federal Express with the intention of avoiding loss of market share to UPS, when the real problem may be the increased use of fax machines. A marketing research expert can help to translate the client’s ideas into a suitable framework. Without expertise it is all too easy to pursue the wrong issue or to introduce bias that will skew the results.
The objectives need to be clearly stated and unambiguous. On the other hand, they should not prejudge the issue. Market research will fail if it is merely asked to confirm the existing theories of the commissioning organization. This can be the result of errors of commission by slanting questions to produce the answers that the organization expects or wants.
A good market research agency should detect such bias and remove it. Errors of omission—key questions never asked— are more difficult to deal with; this is a problem that few market research organizations are in a position to detect unless they are thoroughly familiar with the issues under study.
Stage # 2. Determining the Research Level:
There are three possible research levels- exploratory, descriptive, or causal. The differentiation is necessary because each level requires varying commitments of time and funding. Furthermore, the answers supplied have varying utility to the corporation, ranging from mainly tactical at the exploratory level to strategic and long-term at the causal level. Each objective has merit, depending on corporate needs, but the strategic insights are most useful for the long-run success of the firm.
i. Exploratory Research:
Exploratory research is most appropriate when the primary objective is to identify problems, to define problems more precisely, or to investigate the possibility of new, alternative courses of action. Exploratory research can also aid in formulating hypotheses regarding potential problems or opportunities that are present in the decision situation. Frequently, exploratory research is only the first step in further research activity.
To some extent, it can be compared to a fishing expedition or to a charting of the waters for the uninitiated. Exploratory research can be very useful to gain initial insights into the new environment, its customers, and its suppliers. Exploratory research is often characterized by the need for great flexibility and versatility. Because the researcher is not knowledgeable about the phenomenon under investigation, there is a need to quickly adapt to newly emerging situations in order to make the research worthwhile.
The emphasis is on qualitative rather than quantitative data collection, and on quick rather than slow answers. This, of course, means that exploratory research is less subject to the rigors of more precise research and is therefore less reliable.
Exploratory research can be most useful in answering the basic question for the researcher, “What is the problem?” Defining and formulating the problem are often far more essential than its solution, which may be merely a matter of mathematics or experimental skill If the basic research objective is to define a problem or to gain a feel for a situation or to provide an overview, exploratory research may be the most appropriate activity from the standpoint of both time and money.
ii. Descriptive Research:
Descriptive research provides information about existing market phenomena. For example, market characteristics such as the socioeconomic position of customers or their purchasing intent may be analyzed. Such research is often used to determine the frequency of marketing events, such as the frequency of customers visiting the store or of machines needing to be replaced, and investigates the degree to which marketing variables are associated with one another.
Based on this determination, predictions can then be made regarding future occurrences in the market. The researcher typically uses descriptive work to look for similarities and differences between markets and consumer groups. Similarities can then be exploited through standardization, and differences can assist in the formulation of an adaptive business strategy.
Although several interviews may be sufficient for exploratory research, descriptive studies often require larger quantities of data because the requirements for an accurate portrayal of the population under study are much more stringent. To carry out descriptive work, the researcher needs a substantial amount of information about the phenomenon under study. Hypotheses are customarily pre-formulated and subsequently tested with the accumulated data.
The research design needs to be carefully planned and structured. The intent of descriptive research is to maximize accuracy and to minimize systematic error. The researcher aims to increase reliability by keeping the measurement process as free from random error as possible. Descriptive research does not provide any information about causal interrelationships, but this does not necessarily detract from its value.
Quite often, firms have little interest in the underlying causes for interaction and are satisfied if linkages can be described. As an example, a firm may benefit from knowing that in January, soft drink sales will drop by 30 percent from December’s levels. Whether this development results from lower temperatures or from decreased humidity may be much less useful information.
iii. Causal Research:
Causal research identifies precise cause-and-effect relationships present in the market. The level of precision is higher than that for other types of research because reasonably unambiguous conclusions regarding causality must be presented. Therefore, causal research is often the most demanding type in terms of time and financial resources. It intends to present answers for why things happen and to highlight details of the relationships among variables.
To extract the causality from a variety of unrelated factors, investigators often need to resort to longitudinal and experimental measures. Longitudinal measures, which are measurements repeated over time, are required because after-the-fact measurement alone cannot fully explain the effect of causality. Similarly, experimentation is often necessary to introduce systematic variation of factors and then measure the effect of these variations. Take the example of soft drink sales.
If one were to measure only the sales of a particular brand at one time, it would be difficult to detect usage patterns over time. Repeat measurements can assist in tentatively identifying the effects of temperature and time of year. However, in order to understand the relationship precisely, it is also important to control for factors such as competitive prices, promotion, and store shelf location.
Therefore, experimentation is required in order to cleanly filter out other causal effects. Obviously, causal research is useful only if the research objective is to identify interrelationships and if this knowledge makes a sufficient contribution to the corporate decision process to justify the investment.
Descriptive studies constitute the vast majority of marketing research. Exploratory research is often seen as an insufficient basis for major corporate decisions, and causal research is seen as too time consuming, too expensive, and insufficiently beneficial to be justified. Corporations are mostly satisfied when management believes that a thorough understanding of a market situation has been obtained and that reasonable predictability is possible. Since corporate research is usually measured by its bottom-line effect, descriptive studies often appear to be most desirable.
Stage # 3. Determining the Research Approach:
Although there are many different types of research approaches, one principal differentiation is their type of data yield, which can be either qualitative or quantitative. The qualitative approach intends to gain informed insight and a better understanding of a phenomenon—without too many pretenses about generalizability.
The quantitative approach is the numerical one, where researchers intend to manipulate numbers to extract information such as correlations. In the latter case, conditions of representativeness of data must be met (often through random sampling) together with minimum numbers of data points. Only if these conditions are fulfilled can statistical procedures be applied.
i. Qualitative Research:
Among the types of qualitative data-gathering techniques, observation, in-depth interviews, and focus groups are the most frequently used.
Observation involves watching participants as they undertake some activity simply to see what happens. The pattern of customer flow in a supermarket is best determined by simply watching it (albeit using sophisticated video recording and computer analysis to make the data more meaningful). Observation can also help in understanding phenomena that would have been difficult to assess with other techniques.
For example, Toyota sent a group of its engineers and designers to southern California to nonchalantly observe how drivers get into and operate their cars. They found that women with long fingernails have trouble opening the door and operating various knobs on the dashboard. Based on their observations, Toyota’s researchers redesigned some of the automobile exterior and interior features.
In-depth interviews can last an hour or more. One format is the nondirective approach, in which the interviewer allows the respondent to answer in any form to the semi structured interview. By keeping the answers totally open-ended, the freedom of expression often leads to a less-constrained view of true attitudes, but the responses must be analyzed by skilled personnel.
In focus groups a selected, relatively homogeneous group of 6-10 participants is encouraged to discuss the topics that the researchers are investigating. The moderator, who is often a trained psychologist, carefully leads the discussion, ensuring that all of the group members express their views. The interviewer’s role is essentially a passive one, mainly to foster group interaction and to control any individual who is dominating the group.
The goal of a focus group is for the participants to develop their own ideas in an unstructured fashion, interacting with and stimulating others. The whole session is usually captured on tape or video for later in-depth analysis. This often allows insights that are hidden by the preconceived questions posed in conventional surveys.
The concept of focus groups is based on the assumption that individuals are more willing to talk about a problem amid the security of others sharing the same problem. Focus groups are a superb mechanism for generating hypotheses when little is known and thus constitute a particularly productive approach to developing the first stage of larger research projects.
Focus groups are often, used as a cheaper and faster alternative for those organizations that cannot afford full-scale research. However, the researcher should beware of attributing too much generalizable significance to the results—in particular to any purported statistical outcome— because nonrandom samples do not allow for any statistical conclusions. In addition, the conclusions are dependent upon the researcher’s interpretations. With the advances that have occurred in the communication field, focus groups can now be conducted electronically, thus saving time and money.
ii. Quantitative Research:
Quantitative research provides a sufficient number of scientifically collected data points to permit the application of statistical techniques in the analysis. The importance of such techniques varies by individual manager and culture. In some countries, for example, primary emphasis is on understanding a phenomenon through creative—and sometimes daring— interpretation of limited data.
In others, such as the United States, the accumulation of large quantities of data, their subsequent manipulation through sophisticated analytical procedures, and the discovery of statistically significant results are seen as important components of research. Regardless of the approach taken, the key is the managerial significance of data, which refers to the resulting knowledge that permits the manager to make better decisions. Typical quantitative research approaches are experimentation and surveys.
Experimental research exposes selected participants to different treatments. It may range from testing new products to viewing commercials and measuring responses to them. In theory this approach may be used to establish causal relationships. In practice it is more frequently used to select the best alternative from a range of products or advertising concepts or even more pragmatically to check that the one already chosen is acceptable.
The basis of much experimental research is a comparison between groups. In a before-and-after setting, which is the most customary approach, the subject is tested prior to and after exposure to a stimulus, typically a product or commercial. The performance of the product or commercial is judged by the change in the measurements taken of the subject, normally in terms of attitudes.
An example for such an approach may be a taste test of different colas administered to consumers. In a split-run approach, the different stimuli are applied to separate but statistically equivalent groups and the results are compared. For example, cable TV systems permit the broadcasting of different direct response advertisements in the same test market city. This way, the effectiveness of the various advertisements can be measured.
The most widely used marketing research is survey, or questionnaire-based research. Typically, this may be designed to discover the participants’ habits, attitudes, wants, and so on, simply by asking the respondent a number of questions. The question structure must be developed carefully and skillfully. First, the questions must be comprehensive, because a question not asked will not be answered. Second, they need to be in a language that the respondent understands, so that the answers will be clear and unambiguous.
Many words used by researchers and their clients, even those from their everyday language, may be unfamiliar to the respondents they are testing, particularly if their respondents are less well educated. Even a word such as incentive is likely to be fully understood by only about half the population. The key is to keep questions clear by using simple words, by avoiding ambiguous words and questions, by omitting leading questions, and by asking questions in specific terms, thus avoiding generalizations and estimates.
The researcher must also pay close attention to question content. Questions must reflect the ability and willingness of respondents to supply the answers. The knowledge and information available to respondents may vary substantially because of different educational levels, and that may affect their ability to answer questions. Further, societal demands and cultural restrictions may influence the willingness of respondents to answer certain questions.
For example, in countries where the tax collection system is consistently eluded by taxpayers, questions regarding level of income may be deliberately answered inaccurately. For some respondents, the focus of a particular question may be sensitive, so one may want to address a topic indirectly. For example, rather than ask, ‘How old are you?” one could ask, “In what year were you born?”
To ensure that the questions asked are valid and meaningful, it is sound practice to pretest the questionnaire on a number of respondents so that potential problems can be debugged before the cost of a full survey is incurred. The communications elements of questionnaire design are too easily forgotten by researchers—and confusion is as much a problem in research work as bias. It is worth remembering at all times that marketing is about a dialogue—a two-way communication. Clarity in the questionnaire and in the ideas behind it is rewarded by clarity in the results.
Questions can be unstructured or structured. Unstructured questions allow respondents to answer in their own words. Although the question is fixed, there is no preconceived set of expected answers. This means, however, that to be statistically useful, the resulting answers later have to be categorized into groups that make sense. This imposes extra costs and requires that the person coding the results understands what the cryptic comments from the respondent really mean.
These open questions may take simple forms such as “Why did you buy Brand A?” With structured questions, the respondent is asked to choose from among several alternatives, or the interviewer is asked to listen to and then code the respondent’s answer to an apparently open question against a number of preconceived answers. The advantage of structured questions is that the answers are easy to analyze and are unambiguous. The obvious disadvantage is that this precludes the respondent from giving an answer outside these limits, although often one choice is “Other,” allowing for a free-form explanation.
In structured questionnaires, respondents are often asked questions such as “How frequently do you purchase Brand A?” or “How much did you pay?” This may require almost impossible feats of memory for many respondents unless the process being investigated is a very regular one. Mitigating this problem is the development of categories, which can be handled more easily. For example, the basic question can be expanded to cover a number of alternatives from which the respondent is asked to select one or more.
Also useful are semantic differentials, in which the respondent is asked to choose a position on a scale between two bipolar words or numbers (for example, Excellent, Good, Adequate, Poor, and Inadequate; or from 5, powerful, to 1, weak). As originally developed by Osgood, there were 20 specific rating scales. One widely used form of scaling, developed by Likert, asks the respondent to rate opinion statements presented one at a time in terms of Strongly Agree, Agree, Neither Agree nor Disagree, Disagree, and Strongly Disagree.
Stage # 4. Collecting the Data:
At this stage of the research an army of interviews descends upon the unsuspecting public.
Among the possible methods of contacting respondents are:
i. Mail,
ii. Telephone, and
iii. Personal interviewing.
i. Mail:
Mail is the least expensive solution to data collection. Large overall samples can be used, allowing investigation of small market groups—especially in industrial markets—while still remaining within acceptable statistical levels. But in many respects a mail questionnaire is the least satisfactory solution because the questions have to be simple and the questionnaire short.
The mail questionnaire must be particularly well designed in order to keep the respondent interested and motivated to reply. Still, the response rates are sometimes so low that the statistical validity of the results may be questioned, because it is arguable that the non-responding majority might behave differently from those who have responded. This problem may be addressed in several ways.
One can attempt to increase the response rate by pre notifying individuals that they will receive a survey, by offering participants some form of reward in return for the completed questionnaire, or by conducting follow-up mailings that ask non respondents again for their participation. One can also attempt to reduce the nonresponse bias of sampling by following up, typically by telephone, on a subsample of those not completing the questionnaire, to see if their views are different from those replying. If they are not different, the assumption is made that those responding are representative of the sample as a whole.
ii. Telephone:
Using a telephone to contact respondents is a very fast survey technique; results can be available in a matter of hours. Therefore, this approach is often used for opinion polls where time is of the essence. It is also relatively inexpensive and thus affordable. Telephone interviews can last only a short time, and the types of questions are limited, particularly because the interviewer cannot check visually to see that the question is understood. However, the interviewer can follow up on questions, clarify issues, and adapt the entire questionnaire to the respondent’s specific situation during the questioning.
iii. Personal Interviews:
This is the traditional face-to-face approach to marketing research, and it is still the most versatile. The interviewer has much control of the interview and can observe the respondent’s body language as well as his or her words. It is, however, the most expensive approach, and it is heavily dependent on the reliability and skill of the interviewer.
This means that the quality of the supervision provided by the field research agency is critical. In order to avoid interviewers making up interviews, reputable agencies do exert the necessary control over their personnel, usually by having a field manager conduct follow- ups of a subsample.
Samples:
With all quantitative techniques it is important to obtain a representative sample, although local conditions may make such a task difficult. In some regions, reliable mailing addresses may not be available—for example, in Venezuela, most houses are not numbered but are given names like “Casa Rosa” or “El Retiro.” Mailing lists may not exist, and only limited records may be available about the number of occupants in a dwelling.
Telephone ownership may be unevenly distributed among the population under study, or some subgroups may have more unlisted numbers than others. When privacy laws prohibit random dialing, important groups may not be represented in the research findings.
The basic principle of sampling is that one can obtain a representative picture of a whole population—the total group of people being investigated—by looking at only a small subset. This is a very cost-effective way of obtaining information. Samples are important in terms of understanding the accuracy that may be placed on the results. They also offer a good indication of the quality of the work being carried out.
To guarantee accuracy, the respondents to any respectable market research should be chosen to offer a statistically valid sample, which permits valid statistical analyses. The typical ways in which a sample is chosen are the random approach and the quota approach.
1. Random samples are the classically correct method. A list of the total population to be sampled is used as the basis of selecting the sample, most rigorously by using tables of random numbers, but most simply by selecting every “nth” name. A reasonable degree of accuracy may be achieved with samples as small as a few hundred. Occasionally much larger overall samples are used in order to also observe smaller subsamples.
An alternative and cheaper approach is cluster sampling, which may lose little accuracy if correctly employed. This consists of selecting the districts for interviewing on a random basis. Within these districts respondents can also be specified randomly or can be obtained quasi randomly, by “random walk” (that is, by querying every tenth house on a given street). In the case of a stratified sample the original population is categorized by some parameter—age, for example—and random samples are then drawn from each of these strata.
This method ensures that there are adequate numbers in each of these sub-samples to allow for valid statistical analyses.
The advantage of random samples is that they are statistically predictable. Apart from any questions on how comprehensive the original lists are, they are unlikely to be skewed or biased. Even then, results from poorly controlled research may be biased by poor sampling. This may be due to inadequate coverage, attributable to incomplete lists of the overall population. It is more likely due to a high proportion of non-respondents.
It has to be assumed that their responses would have been different from those who did respond, with the result that particular groups of respondents are overrepresented. Whatever the circumstances, the statistics, particularly those related to the degree of confidence that can be placed on the results, are easily applied.
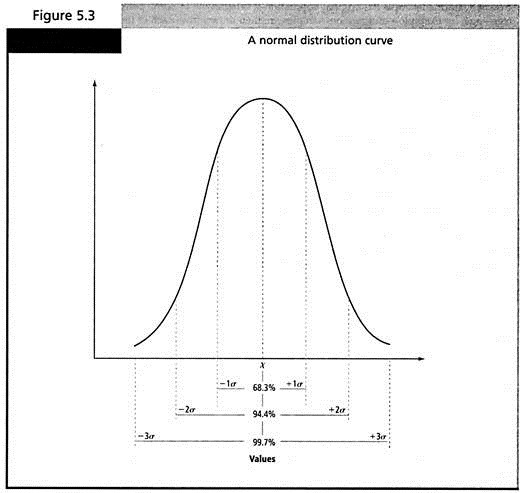
Statistical theory assumes that the results will follow a normal distribution, with normal being used in a particular statistical sense to describe a symmetrical bell-shaped curve (see Figure 5.3). Under these circumstances, the statistical chance of deviation from the central part of the curve, the mean, is given by the standard error. Statistically, this means that 68 percent of any results would lie within one standard error of the mean, and 95 percent within two standard errors.
The formula for the standard error (SE) is:
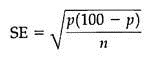
Where p is the percentage of the population having the attribute being measured and n is the sample size. Thus if 10,000 households are included in the sample and we find that 10 percent of them record the behavior we are measuring, then we can calculate that –
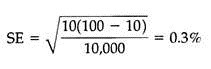
This would enable us to say that we were 68 percent confident that the result lies between 9.7 and 10.3 percent, and 95 percent confident that it was between 9.4 and 10.6 percent. If, on the other hand, the sample was just 400, the range within which we could be 95 percent confident would need to be much wider (between 7 and 13 percent—as the standard error would then be 1.5 percent). It is clear, therefore, why sample sizes often approach 1,000 respondents.
2. Quota samples aim to achieve an effect similar to stratified random samples by asking interviewers to recruit respondents to match an agreed quota of subsamples. This is supposed to guarantee that the overall sample is an approximately representative cross-section of the population as a whole.
For example, the interviewer may be required to select certain numbers of respondents to match specified ages and social categories. This technique clearly may be subject to bias, because interviewers select only the more accessible respondents and exclude the more elusive elements of the population. In the strict theoretical sense, it is inappropriate to apply statistical tests to these data.
However, quota sampling is significantly cheaper than using random samples, and so it is an approach frequently used for commercial research. Despite its apparent theoretical shortcomings, it often works well. As the quality of quota sampling depends directly upon the quality of the interviewer, it is the approach most likely to suffer from sacrificing quality to achieve cost savings. If poorly controlled, it may all too easily degenerate into “convenience sampling” or interviewing whoever is easiest—not a genuine form of sampling by any standard.
The drawing of large samples is relatively easy in consumer market research, because there are usually large numbers of consumers available. The application of sampling is less easy in an industrial market setting. At one extreme, the industry itself may be so small that a survey will cover all the customers—-therefore becoming a census. Because of this small population, there may be problems in individual willingness to respond, as even aggregate data may be too revealing of a specific firm’s data.
In larger industries, with a few industry leaders, there may also be the problem of information request overload. For example, the firms on the Fortune 500 list often receive hundreds of questionnaires a week and are therefore no longer able and willing to participate in survey research. Furthermore, it is increasingly difficult to ensure that a mail questionnaire, for example, actually reaches the intended recipient.
Often such research instruments are either screened out by a gatekeeper or are responded to by individuals who are not well informed about the phenomenon under study. Unless a particular line of inquiry is of special importance to the industrial recipient of a questionnaire, response willingness tends to be low. Low response rates, in turn, prompt doubts about the validity of the results. However, technology again comes to the rescue— at least momentarily. E-mail permits surveys to be administered quickly, at a low cost, and to the precise respondent intended.
Stage # 5. Analyzing the Results:
Collected data can be analyzed in a variety of ways. Increasingly, analysts use the massive computing power now available to cut through the superficial results. The mathematics of these various techniques is beyond the scope of this book; the practical skill needed is that of finding the best expert to implement them and knowing how much reliance to place on his or her judgment.
The researcher should, of course, use the best tools available and appropriate for analysis. On the other hand, researchers should be cautioned against using overly sophisticated tools for unsophisticated data. Even the best of tools will not improve data quality. Therefore, the quality of data must be matched with the quality of analytical tools.
Some examples of the more popular analytical tools used by practitioners include multiple regression analysis, factor analysis, cluster analysis, and conjoint analysis. All of them can serve to identify common elements or connections within the data. By grouping data into related variables, these techniques reduce the scope of the data set and achieve stronger differentiations between groups, which in turn allows the marketer to focus better on each one of them.
Stage # 6. Reporting the Findings:
The final research stage is to disseminate the results. This process may require more effort, and be more important, than the simple clerical task that it superficially seems to be. For one thing, one needs to identify those to whom the results are useful. Equally important, the language of the report may need to be “translated” for different audiences; very few managers may care about the detailed terminology of market research.
This poses some problems. The process of simplification may result in the loss or alteration of some meaning. One favorite approach in presentation to top management is to augment the dry statistics that have already been considerably simplified with verbatim quotes from individual respondents. Instead of mysterious symbols and dull tables, there are direct quotations in which believable people give their views at length and in their own words.
For many clients this is the texture of the world. The particular danger here is that senior management unversed in market research skills will merely remember the most striking comments (particularly the ones that reinforce their existing prejudices) rather than the boring statistics.
Many managers find themselves on the receiving end of research reports yet are poorly trained in the skills needed to make sense of such reports. As a result, they tend to read the related conclusions uncritically, accepting or sometimes rejecting them at face value, usually based on what they think of the researcher presenting them or on whether these results confirm their own prejudices.
In evaluating a report, a number of initial guidelines should be kept in mind:
(i) Relevance:
Fortunately, the relevance can usually be deduced from a quick scan through the summary, coupled with an understanding of where the report has come from and why it was produced.
(ii) Reliability:
Perhaps the most important question, but the one least often asked, is how reliable the reported results are. What weight can be put on them and on the judgment of the researchers and experts who are recommending some form of action to be taken on the basis of the findings? Here one can examine the methodology, such as the questionnaire and sample design, because this is likely to give the best indication of the quality of the work, or consider the past performance and reputation of the researcher.
(iii) Accuracy:
After establishing that the material is both relevant and reliable, the above step is to determine its accuracy. All too often accuracy is a technicality that is buried deep in dense appendixes that never reach the general reader. Accuracy is not the same as reliability. As long as it is allowed for, low accuracy may be quite reliable and useful in decision making. The problem is to establish what accuracy can be tolerated.
In marketing research the answer can normally be deduced from the sample size. If the sample size is greater than 500, the results are likely to be accurate to within 2 to 3 percent. If the sample is greater than 1,000, it may be accurate within 1 percent. Below 100, though, as many of the more dubious pieces of so-called quantitative research are, any statistical accuracy may be almost nonexistent. Nevertheless, some of the qualitative aspects of such research may still be quite meaningful.
(iv) Bias:
Most research reports contain bias, whether conscious or unconscious. It is very difficult for even the most professional researcher to remove all of his or her biases. You would be wise to assume that the material still contains some elements of distortion. This bias may not be without value – The best research starts with a strong thesis as to what is likely to be found. Although this will inevitably color the results, it also ensures that the research is focused and pro-vides meaningful insights, as long as you recognize what the focus or bias is.