
In this article we will discuss about the benefits of having a diversified investment portfolio.
Yearly Returns from Each Investment Avenue:
Let us first consider the returns that you would have earned each year during the period from 2000 to 2010 from four main investment avenues- Equity, Fixed Income, Commodities and Gold.
For the purpose of measuring returns from each of these investment avenues, we have considered the following benchmarks or indexes:
I. Equity:
ADVERTISEMENTS:
Broad market represented by BSE 200 Index and conventional Large Cap represented by S&P CNX Nifty
II. Gold:
USD per Ounce as per New York Close; converted into INR at RBI Reference Rate
III. Commodity:
ADVERTISEMENTS:
CRB Continuous Commodity Index
IV. Fixed Income:
l-Sec Sovereign Bond Index l-Bex
The annual returns from each of these investment avenues over the ten year period along with their average (Mean) and standard deviation (St Dev) are given in the table below:
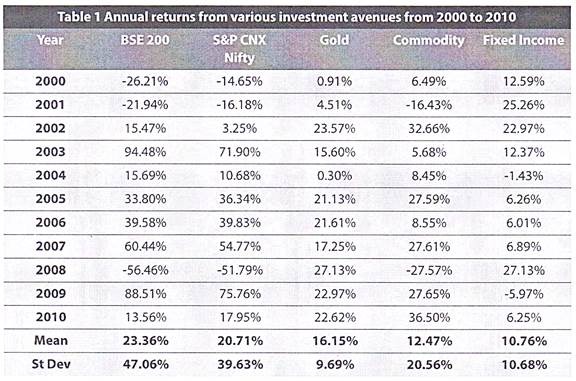
The Table 1 above gives a simple perspective on these investment avenues by showing the calendar year returns. This being the primary data set, let us now evaluate this data to find if it’s really worth creating a diversified portfolio.
Correlation between Different Asset Classes:
The basic rationale of diversification is that the returns on various investment avenues are not perfectly correlated to each other (i.e. they don’t go hand in hand). The extent to which they are related to each other is measured by the concept of correlation.
We have analysed below, the correlation between various investment avenues. But before we proceed to the table, let us briefly tell you how to interpret the correlation number.
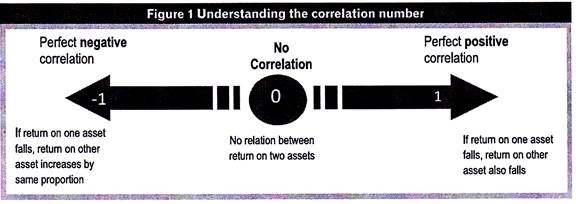
With this understanding in mind, let us now look at how all these assets are related to each other:
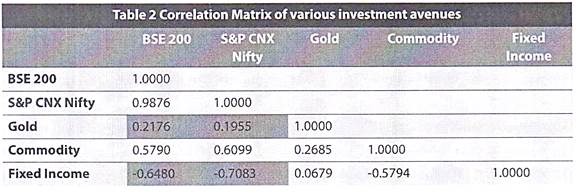
As can be seen above, Gold has about 20% (0.1955) to 22% (0.2176) correlation with equities. However, it can be seen that fixed income investments are an even better hedge for risks of investing in equities as they show a strong negative correlation with them. Fixed Income Investments show -65% (-0.6480) to -70% (-0.7083) correlation with equity.
That means, if you add a Fixed Income security or Gold to your portfolio of equity investments, it would offer a good diversification benefit.
ADVERTISEMENTS:
Return and Risk of a Portfolio:
The greater the ‘return’ you want, the more the ‘risk’ that you should be willing to accept. In portfolio theory, ‘risk’ primarily means variability of returns. An investment may give you a return of 100% in the first period, -75% in the second period and 5% in the third period. This variability of returns makes the investment a risky asset. This ‘riskiness’ of an investment avenue is measured in terms of the standard deviation of its returns.
In this context, let us again look at the mean return and standard deviation of our investment avenues mentioned in table 1 above:
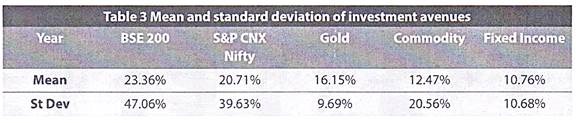
As is seen above, equities (BSE 200 and S&P CNX Nifty) have a high return as well as high risk (Standard Deviation) while fixed income securities have a low return and a low risk.
ADVERTISEMENTS:
The whole idea of creating a portfolio is to minimize the total portfolio risk for a given level of total portfolio return. Total portfolio return is the weighted average of individual asset returns.
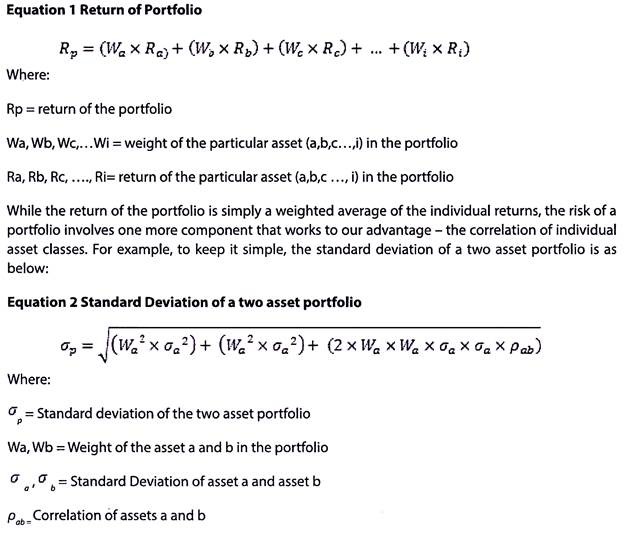
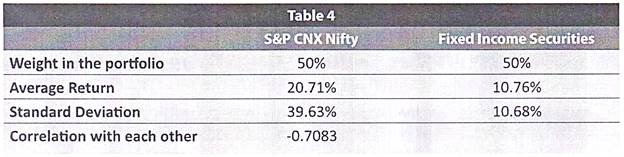
Let us now practically apply these formula to understand their implications. For this purpose, consider a portfolio where 50% of the funds are invested in the S&P CNX Nifty Index and the balance 50% in Fixed Income securities. Based on the Table 2 and Table 3, we have everything that we need to calculate this portfolio’s return and its standard deviation.
ADVERTISEMENTS:
The same would be as below:
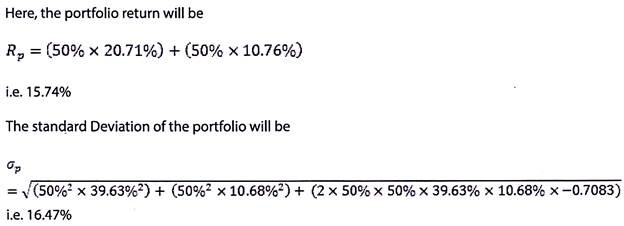
Had we ignored the correlation portion of the equation, and simply taken a weighted average of the standard deviations of the individual assets, the portfolio standard deviation would have been 20.52%. The negative correlation between equity and fixed income plays an important role in reducing the overall standard deviation of the portfolio.
Thus, a ‘well diversified’ portfolio is one that includes various investment assets and in such proportion that the overall risk (portfolio standard deviation) is minimized.
Mean Variance Frontier:
ADVERTISEMENTS:
The most important advantage of a well-diversified portfolio is that when two or more assets in the portfolio do not move in sync with each other, they automatically hedge against the risk of a wide fluctuation in portfolio returns depending on the fluctuation in the returns of a single asset in the portfolio.
Given any two investment assets, we can create almost infinite number of portfolios by modifying their weights. The mean variance frontier is basically a list of all the portfolios that can be created from the given assets such that the portfolio generates the lowest risk for a given level of return.
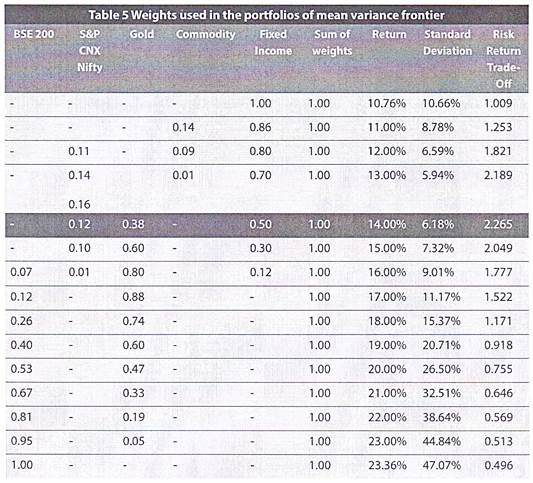
We have created a mean variance frontier using regression analysis and the results are shown in the table below:
When plotted on a graph, the Mean Variance frontier will look like this-
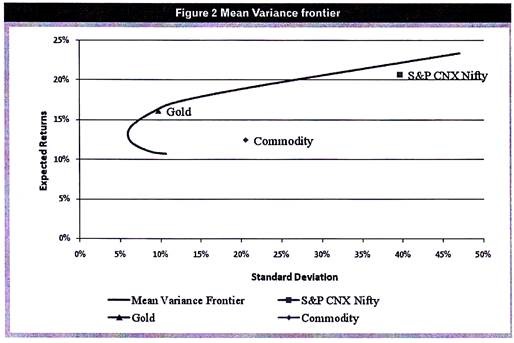
Mean Variance Frontier identifies the best possible risk-return combination of assets.
ADVERTISEMENTS:
The last column of Table 5 Weights used in the portfolios of mean variance frontier above determines the risk return trade-off i.e. it calculates the return that a portfolio generates per unit of risk that it undertakes. This is sometimes also referred to as the reward to risk ratio.
The formula for risk return tradeoff is as below:
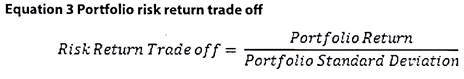
In the theory on portfolio concepts, there is an additional concept of an ‘Efficient Portfolio’. An efficient portfolio is the ideal portfolio and one that has the highest reward to risk ratio. In our case, the portfolio highlighted in table 5 is the one that has the highest reward to risk ratio and is the ideal portfolio.
As can be seen in Table 5 Weights used in the portfolios of mean variance frontier, the risk-return trade off increases with an increase in the returns, peaks at 2.265 with a 14% return and then begins to fall. From a risk-return perspective, this portfolio, giving a 14%, is the most efficient among all the portfolios.
ADVERTISEMENTS:
The weights of assets in this portfolio are:
I. Equity (Nifty) 12%,
II. Gold 38%; and
III. Fixed Income Investments 50%.
This allocation is only theoretical and is based on the 10 year historical returns. The efficient portfolio will differ as the returns and the standard deviations of individual assets differ as well as when the time horizon of review differs.
However, the fact remains, that diversification ensures that you can create a portfolio of assets that suits your risk-return profile. This theoretically efficient portfolio is purely from a risk return stand point based on historical performance.
ADVERTISEMENTS:
We understand that making all this analysis and developing an efficient portfolio may not be practically feasible. Further, this ideal portfolio may seem too academic to some people. We have therefore considered some practically feasible portfolio combinations to demonstrate that creating a diversified portfolio may not always require complex financial modeling.
Practically Feasible Portfolios:
Plotting a mean variance frontier involves a lot of number crunching and may not be feasible for all investors. Nonetheless, diversification does ensure that you reduce your risks. To prove this point, we have taken 3 possible portfolios in further analysis – the efficient portfolio developed above, an equal portfolio (20% in all 5 asset classes), and a 60:40 portfolio (60% in large cap equity and 40% in fixed income investments).
The returns from such portfolios vis-a-vis the individual asset class returns are shown in the table below:
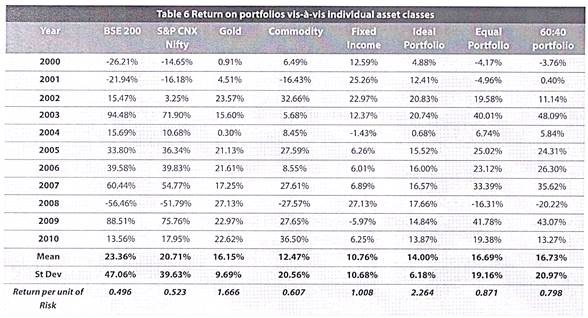
The efficient portfolio gives the highest return for each unit of risk (volatility) that an investor takes. The equal and 60:40 portfolios have a relatively higher weighting in equities. We can see that while the average return on these portfolios would have been only 17% as compared to about 23% in equities (about 6% lower), their standard deviations are only about 21% as compared to about 40% to 47% in equities (up to 26% lower).
This makes it amply clear that portfolios help eliminate a chunk of risk for a small loss in return.
Return-Based Ranking of Investments:
ADVERTISEMENTS:
Keeping all the alternatives above, we have analysed them from another standpoint – by ranking them from 1 (highest return for the particular year) to 8 (lowest return for that year).
The results of this analysis are as below:
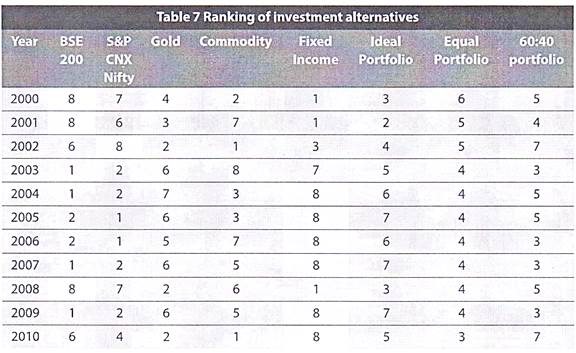
A glaring point we can make from the above table is that none of the portfolios have ever performed best but neither have they ever performed worst. This is only apparent because a portfolio has only a fraction of the best or worst performing asset, as against 100% in one asset.
If we consider the top- 5 return earners in a year, the equal portfolio finds a place in 10 out of the past 11 years, the 60:40 portfolio in 9 out of the past 11 years. The BSE 200 appears in the top-5 in 5 while the Nifty appears in 7 out of the past 11 years.
The point to draw home is that diversified portfolio may not give the best return, but does not give the worst. The investor should take his decision accordingly.
Value of Investment, had it been made at Beginning of the Year 2000:
We now look at the same alternative investment avenues from another standpoint. Consider a scenario where you would have invested Rs. 100 in each of these alternative investment avenues at the beginning of the year 2000.
In such case, the value of your investments in each of these years would have been as below:
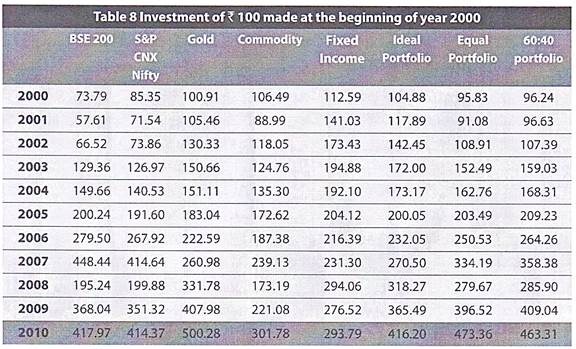
If you could not make out much from the table above, consider the Figure 3 Growth in various investment avenues from 2000 to 2010 below:
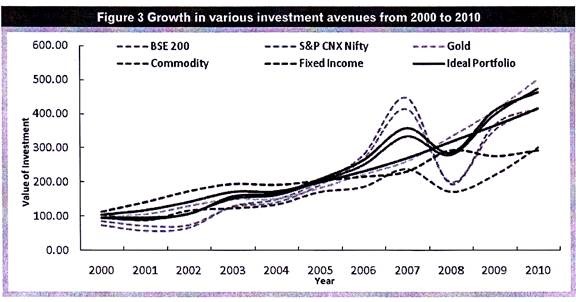
The portfolios (thick lines) had the most stable run with the ideal (efficient) portfolio being the most stable of all. On the other hand the individual investment avenues showed wide fluctuations in portfolio values over the 10 year period.
Thus, the portfolios would have earned you a similar return as equities, with much less variation. The value growth in portfolios is more linear compared to individual assets.
We can see that the peaks and the troughs in the value line are evened out in the portfolios while ultimately creating a similar investment value at the end of the investment horizon. This more stable earning capacity is well brought out in the CAGR.
Compounded Annual Growth Rate (CAGR):
CAGR is a measure of return that is most useful in the case of investments that earn erratic returns.
We have therefore calculated the CAGR of each of our investment avenues and is shown in the table below:

The CAGR of the portfolios is actually better as compared to the equities. While portfolios gave a CAGR ranging from 18.5% to 19%, the equities gave a CAGR of about 15.5%. For evaluation of a fluctuating investment return over a period of time, the CAGR is a better indicator as compared to the simple returns.
Thus, diversified portfolio gives returns nearly equal to the highest return category, it may actually give even better return over a long horizon.
Equal Annual Investment in Each Year:
Just to make you completely understand the significance of diversification, let us analyse these investment alternatives again from another angle. Consider the case of a ‘Systematic Investment’ wherein you invest Rs. 100 at the beginning of each of the 10 years from 2000 to 2010 in each of these investment alternatives.
In such case, your investment value at the end of 2010 will be as shown in the table below:
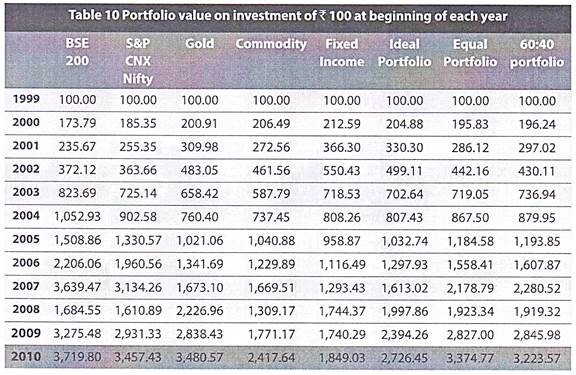
In contrast to the results seen when an investment of Rs. 100 was made only in the initial year, it is seen that equity investments (both broad market and large caps) have created a greater value than all the 3 types of portfolios. An equal amount (say Rs. 100) invested at the beginning of every year shows that equity has provided the best return over the past 11 years, but diversified portfolios are not far behind.
Conclusion:
I. Highest returns always come at the cost of highest risk. In the long run of, say 10 years, equity investments may have yielded the best average returns. But if the investment is required to be liquidated in any year, which unfortunately happens to be a bad year, it may wipe out all the gains earned in the earlier years.
II. It is always better to add certain stable earning assets to your equity portfolio, even if it is at the cost of a bit lower return. The relative stability that it would add to the variation in returns would more than compensate for the loss.