
In this article we will discuss about:- 1. Introduction to Portfolio Management 2. Strategies of Portfolio Management 3. Return of Single Asset 4. Risk of Single Asset 5. Portfolio Diversification and Minimization of Risk 6. Risk and Required Return.
Introduction to Portfolio Management:
Portfolio management is concerned with efficient management of investment in the securities.
An investment is defined as the current commitment of funds for a period in order to derive a future flow of funds that will compensate the investing unit:
(i) For the time the funds are committed,
(ii) For the expected rate of inflation, and
(iii) For the uncertainty involved in the future flow of funds.
The portfolio management deals with the process of selection of securities from the number of opportunities available with different expected returns and carrying different levels of risk and the selection of securities is made with a view to provide the investors the maximum yield for a given level of risk or ensure minimize risk for a given level of return.
The portfolio management consists of three major activities:
(i) Asset allocation i.e. selection of various securities with different risks and returns to place them in a portfolio.
(ii) Redesigning of portfolio basing on the market conditions to achieve the portfolio objectives.
(iii) Security selection with in asset classes.
The basic objective of portfolio management is to build a portfolio which consists of various securities with different risks and returns to fulfill the financial objective of an individual investor or group of investors.
The portfolio management services are normally offered by a portfolio management company which must compulsorily be registered with SEBI for offering such services in India.
The portfolio manager will enter into a contract or arrangement with a client for rendering investment advisory services to the client or to undertake the management or administration of a portfolio of securities or funds on behalf of a client.
Different schemes of funds or portfolios may be formulated to address the needs of different investor groups.
The investors will have well defined risk appetite and the portfolio manager administers or manages various funds to maximize the return for the investment risk undertaken.
Each scheme of fund will have a designated fund manager who will take responsibility for constructing, managing and protecting portfolios to achieve predefined investment objectives.
The mutual fund companies are working in the lines of companies offering portfolio management services, except that mutual fund companies don’t offer investment advisory services.
The mutual fund companies offer only fund management services. For constructing, managing, revising and maintaining the portfolios, investors are charged with asset management fee.
Strategies of Portfolio Management:
1. Constant Proportion Strategy:
In a constant ratio plan an investor maintains a fixed ratio between stocks and bonds throughout the investment period with regular adjustments made to compensate for different levels of price increases and decreases.
It requires the investors to define a floor and a multiplier.
Portfolio management services firms in India use similar process to manage their capital guaranteed products.
It loads more equity into the portfolio when the market moves up and reduces exposure when the market moves down.
Illustration 1:
Mr. X wants to invest an amount of Rs.10 lakhs which he wants to allocate between stocks and bonds. Assume a floor of Rs.8 lakhs and a multiplier of 2. The difference between the total assets and the floor is called the ‘cushion’. The equity exposure is a multiple of the cushion.
The investor is having a cushion of Rs.2 lakhs. With a multiplier of 2, the initial equity exposure will be Rs.4 lakhs. The balance Rs.6 lakhs will be typically invested in bonds or term deposits.
If the equity portfolio declines by 10 per cent, the total portfolio would be worth Rs.9.6 lakhs and equity exposure permissible is Rs.3.2 lakhs [2(Rs.9.6 lakhs – Rs.8 lakhs). This means that the investor would have to rebalance the portfolio by selling Rs.40,000 worth of equity and invest in bonds.
If the equity portfolio moves up by 10 per cent, then the total portfolio would be worth Rs.10.4 lakhs. The cushion would be Rs.4 lakhs, which allows an equity exposure of Rs.4.8 lakhs. Then the investor would have to sell Rs.80,000 worth bonds and invest in equity.
2. Constant Mix Strategy:
It maintains constant equity exposure as a percentage of the total assets.
In this, the investors buy more equity when prices go down and sell as prices go up.
This continual buy-and-sell strategy helps investors take advantage of reversals within a range-bound market.
It under performs when the market is trending up or down, for the same reason that it does well on reversals.
It plays on the behavioral psychology of investors. The reason is that it engages in value-buying by increasing equity exposure when stock prices decline.
The strategy also helps investors take profits quickly, as it cuts exposure when stock prices move up.
It helps in taking profits while stock prices rises and when the price falls, buy more shares, thereby allowing to take advantage of the expanded purchasing power of money.
Illustration 2:
Mr. Y decides to invest Rs.10 lakhs, out of which the investor intends to maintain 60% equity exposure. The initial portfolio will have Rs. 6 lakhs in equity and Rs.4 lakhs in bonds.
If the equity portfolio declines by 10%, it would be worth Rs.5.4 lakhs i.e., 57% of the total assets of Rs.9.4 lakhs. To have an equity exposure of 60%, the investor would have to buy shares worth Rs.24,000 and sell equivalent value of bonds.
If the equity portfolio moves up by 10% to Rs.6.60 lakhs, then the total portfolio would be worth Rs.10.60 lakhs. The portfolio would have to be rebalanced, as 60% of Rs.10.60 lakhs is Rs.6.36 lakhs. The investor would, therefore, have to sell Rs.4,000 worth shares and invest in bonds.
3. Rupee Cost Averaging Strategy:
The rupee cost averaging (RCA) is always not possible to keep track of the share price movement and investors may not catch right shares at low prices to sell at higher prices.
The investor will go on investing at regular intervals at a fixed amount of installment.
This strategy will catch the turns in the market. Regular investing will allow you to buy more shares when prices are low given a fixed investment schedule.
This plan is suggested for those investors who are having small amounts to invest on regular intervals, and who are risk-averse but would still like to invest.
It suggests a long-term plan of investment to catch the markets and be fully invested in the up-markets.
The investor has to retain his investments when the market is down to minimize loss.
Illustration 3:
Mr. Y wants to make an investment of Rs.10,000 in a fixed monthly installment of Rs.1,000 under rupee cost averaging plan.
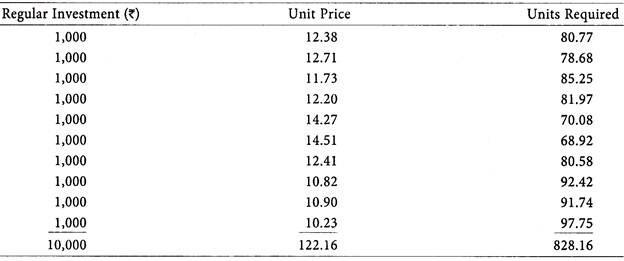
Average unit cost to the investor = Rs.10,000/828.16 = 12.07
Average unit price to the investor = Rs.122.16/10 = 12.22
The investor has acquired 828 units by investing an amount of Rs.10,000. The average cost incurred by the investor to acquire these units is Rs.12.07 and the average market price of such investments is Rs.12.22.
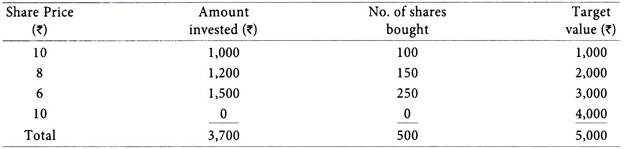
4. Value Cost Averaging Strategy:
The concept is also called as ‘value averaging’ in which the investor will invest his money gradually in the market by picking a target amount or value for his account to reach, for each time period e.g. per month.
Instead of investing a fixed amount regularly, the investor will increase his investment by a specified amount till the cumulative amount reaches the target amount meant for investment, in the rising market.
When the market is in declining state, the investor will gradually decrease his investment by a specified amount till the cumulative amount reaches the target amount meant for investment.
The investor will benefit from lower market prices by ending up buying more shares as security prices go down and less shares when prices go up.
It is suggested for the investors who can sustain higher price volatility.
This investment approach delivers reasonable returns. It entails more money at regular intervals to buy more shares when prices are low.
It works best when markets go sideways or down for an extended period (measured in years) then go back up and recover with strong upside.
Illustration 4:
Mr. X wants to make his investment to a targeted value of Rs.5,000 under rupee cost averaging plan.
The method of investment resorted is explained below:
5. Matrix Investment Strategy:
The management of investments and portfolio decision is complex task which requires careful analysis and planning which involves number of variables like, return, liquidity, safety, image etc. of the investment.
By using the matrix strategy, the investment is selected which fetches the highest score, based on the weights given for various features of the security.
Illustration 5:
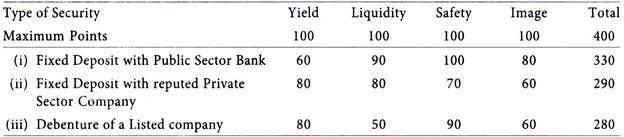
The investor can assign points to each character of the investment, and he can select the portfolio which has been awarded with high score of points. This method is criticized for the reason that some element of subjectivity is involved in awarding of marks. If this method is used with care, will give good results.
6. Other Investment Strategies:
1. Traditional Allocation:
It refers to allocating assets primarily between stocks and bonds. Most investors prefer equity for their core portfolio, adding bonds to reduce volatility and downside risk.
2. Core-Satellite Allocation:
The asset allocation policy of mutual funds, pension funds, and insurance companies includes allocating assets to stocks, bonds, commodities, derivatives and non-directional hedge funds. Their portfolio construction process is called ‘core-satellite approach’.
3. Reverse Asset Allocation:
Some investors prefer to enhance their exposure to alpha generators (investments that outperform their class). Such investors can apply a new concept called ‘reverse asset allocation’, where alpha generators constitute the core portfolio instead the satellite portfolio.
4. Buy and Hold:
In this strategy the investor will purchase and hold high quality stocks for a longer period. It is a passive management strategy which produces substantial returns with least management of investments. The dividend receipts will also be reinvested in the same category of stocks which is having compounding effect. The buy and hold strategy will result in a position to profit from long-term upward trend of the stock market.
5. Growth Stock:
In this strategy the investment will be made in those companies who have above average earnings growth over a period of time which will tend to produce stock values that will lead to above average returns for the investor.
6. Under Valued Stock:
The investors following this approach invest in companies that have either high dividend yields, low market to book value ratios or low price earnings ratios to achieve higher current income.
7. Out-of-Favour Stocks:
In this strategy the investors will invest in shares with low P/E ratios and those stocks are out of favour due to the economic cycle in which a particular industry is passing through.
8. Small Capitalization:
The small capitalization companies are growing attraction for the investors due to their potential for rapid growth.
9. Market-Timer:
In this approach, the investor will vary stocks proportion in his portfolio depending on where he views the stock market to be at a particular time.
10. Selling Short:
Selling short is a strategy investor’s use to profit during a price decline. Under this strategy, in anticipation of a price decline, first the investor will sell stock at high price and later buy it back at a lower price. Short sellers will make profit when the price of the stock declines and if the price of the stock rises, short sellers lose.
11. Systematic Investment Plan:
The systematic investment plan (SIP) enforces discipline among the investors in saving the money for the future requirements and enables them to contribute to the stocks in monthly installments instead of making one -time payment of lump sum amount. This type of investment option gives greater flexibility to the investors especially salaried employees.
12. Systematic Withdrawal Plan:
The systematic withdrawal plan (SWP) enables an investor to systematically withdraw his money from the investment in securities.
13. Growth Option Plan:
Investors who prefer capital appreciation opt for growth plan. The scheme wouldn’t declare dividends under the growth plan. The income earned on the stocks will remain invested within the stocks.
14. Income Option Plan:
Investors who wish to receive regular income can opt for dividend plan. In this plan dividend and/or interest is received regularly from the investment.
15. Income Reinvestment Plan:
In this plan, the investors decide to reinvest dividends and/or interest in additional stocks available in the market.
16. Switch Facility:
The unit holders are given freedom to switch over from one scheme to another. The switchover will take place at the applicable NAV based prices. The unit holders are allowed to exchange their units under existing investment plans to some other plans.
17. Fixed Sum Investment Plan:
In this plan, the investor will prefer to invest a lump-sum at a time and wait for growth of his investment. This plan is suggested when markets surge. It delivers handsome returns over the long-term. The investor can choose this plan when chunk of money is available for investment. While making the investment, the investor has to choose a blend of stocks in his portfolio to minimize risk.
Return of Single Asset:
The typical object of investment is to make current income from investments in the form of dividends and interest income.
The investments should earn reasonable and expected rate of return on investments. Certain investments like bank deposits, public deposits, debentures, bonds etc. will carry a fixed rate of return payable periodically.
In case of investments in shares of companies, the periodical payments in the form of dividends are not assured, but it may ensure higher returns than fixed income investments.
But the investments in equity shares of companies carry higher risk than fixed income instruments.
Another form of return is in the form of capital appreciation.
This element of return is the difference between the purchase price and the price at which the asset can be sold, it can be a capital gain or capital loss arising due to change in the price of the investment.
Annual Rate of Return of Single Asset:
The annual rate of return of a particular investment can be calculated as follows:
![]()
Where:
R = Annual rate of return of a share.
D1 = Dividend paid at the end of the year.
P0 = Market price of share at the beginning of the year.
P1 = Market price of share at the end of the year.
The above formula is used for calculation of annual return of an investment in shares. In the above formula, D1/P0 represents dividend yield and (P1 – P0)/P0 represents capital gain or loss.
Illustration 6:
Mr. Manohar has purchased 100 shares of Rs.10 each of Kinetic Ltd. in 2009 at Rs.78 per share. The company has declared a dividend @ 40% for the year 2012-13. The market price of share as at 1-4-2012 was Rs.104 and on 31-3-2013 was Rs.128. Calculate the annual return on the investment for the year 2012-13.
Solution:
Dividend received for 2012-13 = Rs.10 × 40/100 = Rs.4
Calculation of Annual Rate of Return on Investment for the year 2012-13
![]()
Average Rate of Return of Single Asset:
The rate of return can also be calculated for a period more than one year. The average rate of return represents the average of annual rates of return over a period of years.
The formula used for calculation of average rate of return is given below:
R̅ = 1/n (R1 + R2 +..….. Rn)
Where,
R̅ = Average rate of return
R1 + R2 +..….. Rn = Annual rate of return in period 1,2,……
n = Total number of periods
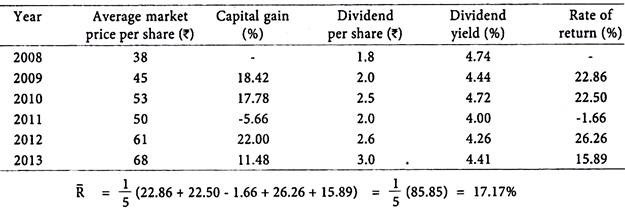
Illustration 7:
The average market prices and dividend per share of Fincorp Ltd. for the past 6 years are given below:
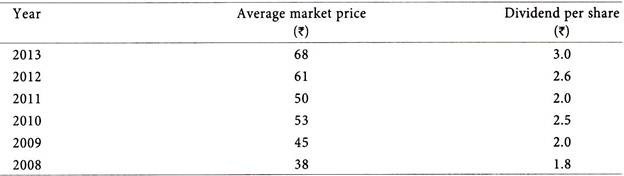
Calculate the average rate of return of Fincorp Ltd.’s shares for past 6 years.
Solution:
Risk of Single Asset:
The concept of risk is more difficult to quantify. Statistically we can express risk in terms of standard deviation of return. For example, in case of gilt edged security or government bonds, the risk is nil since the return does not vary – it is fixed.
But strictly speaking if we consider inflation and calculate real rate of return (inflation adjusted) we find that even government bonds have some amount of risk since the rate of inflation may vary.
Return from unsecured fixed deposits appear to have zero variability and hence zero risk.
But there is a risk of default of interest as well as the principal.
In such case the rate of return can be negative.
Hence, this investment has high risk though apparently it carries zero risk. For other investments like shares, business etc., where the rate of return is not fixed, there may be a schedule of return with associated probability for each rate of return.
The mean of the probable returns gives the expected rate of return and the standard deviation or variance which is square of standard deviation measures risk.
Higher the range of the probable return, higher the standard deviation and hence higher the risk.
A risk averse investor will look for return where the range is low. Hence, low standard deviation means low risk.
The problem is to minimize the standard deviation without sacrificing expected rate of return. This is possible by diversification. Risk is measured in terms of variability of returns.
If Investment ‘A’ and Investment ‘B’ whose mean rate of return is same as shown in Figure 10.1.
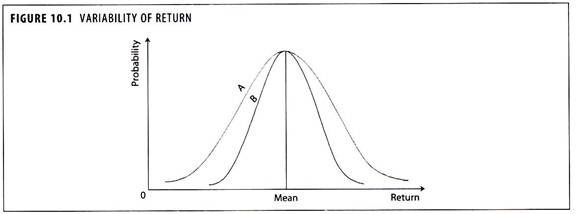
The returns of Investment ‘A’ show more variability than Investment ‘B’. In view of the variability of returns, Investment ‘A’ is more risky, even though both the investments are having the same mean returns. The following illustrations explain the quantification of risk in terms of standard deviation.
Illustration 8:
The rate of return of equity shares of Hill Top Ltd. for past six years are given below:
![]()
Calculate the average rate of return, standard deviation and variance.
Solution:
Calculation of Average Rate of Return (R̅):
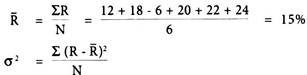
Illustration 9:
Mr. Srivastav invested in equity shares of Drydock Ltd., its anticipated returns and associated probabilities are given below:
![]()
You are required to calculate the expected rate of return and risk in terms of standard deviation.
Solution:
Calculation of Expected Return and Risk in terms of Standard Deviation.
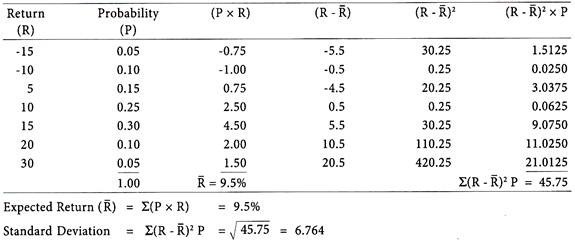
The risk in the above illustration, can be measured by taking the range of 45% [i.e. 30% – (-) 15%] and standard deviation of 6.764. The investment carries greater risk in terms of high variation in return.
Illustration 10:
The probabilities and associated returns of Modern Foods Ltd. are given below:
![]()
Calculate the standard deviation.
Solution:
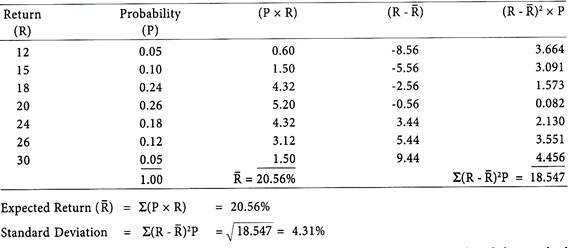
The expected return is greater at 20.56%, the range of returns is 18% (i.e. 30% – 12%) and the standard deviation is lower at 4.31%. The investment carries lesser risk in terms of low variation in return.
Illustration 11:
The possible returns and associated probabilities of Securities X and Y are given below:
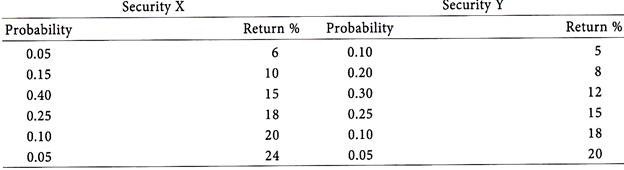
Calculate the expected return and standard deviation of Security X and Y.
Solution:
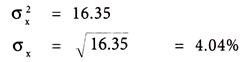
Calculation of Expected Return and Standard Deviation of Security X:
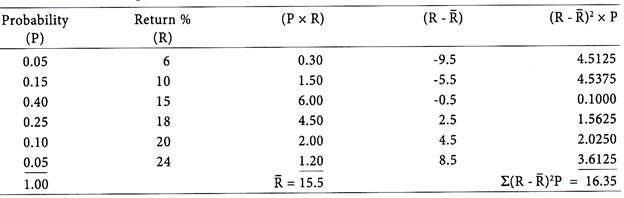
Expected Return of Security X (R̅) = 15.5%
Standard Deviation of Security X:
Calculation of Expected Return and Standard Deviation of Security Y:
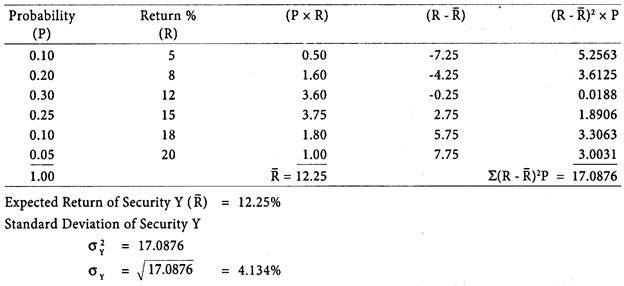
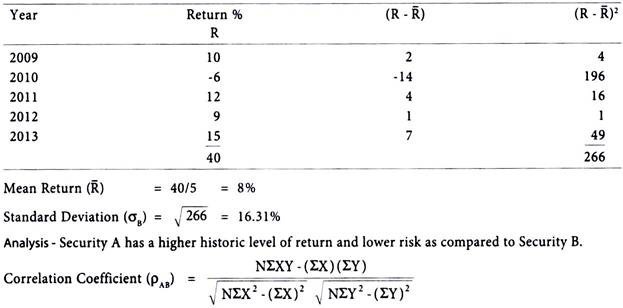
Analysis – Security A has higher expected return and lower level of risk as compared to Security Y.
Term Paper # 4. Risk Return of Portfolio of Two Assets:
The expected return from a portfolio of two or more securities is equal to the weighted average of the expected returns from the individual securities:
S(RP) = WA(RA) + WB(RB)
Where:
S(RP) = Expected return from a portfolio of two securities
WA = Proportion of funds invested in Security A
WB = Proportion of funds invested in Security B
RA = Expected return of Security A
RB = Expected return of Security B
WA + WB = 1
Illustration 12:
A Ltd.’s share gives a return of 20% and B Ltd.’s share gives 32% return. Mr. Daniel invested 25% in A Ltd. shares and 75% of B Ltd. shares. What would be the expected return of the portfolio?
Solution:
Portfolio Return = 0.25 (20) + 0.75 (32) = 29%
Illustration 13:
Mr. Amar’s portfolio consists of six securities.
The individual return of each of the security in the portfolio is given below:
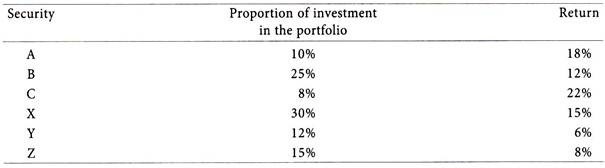
Calculate the weighted average of return of the securities consisting the portfolio.
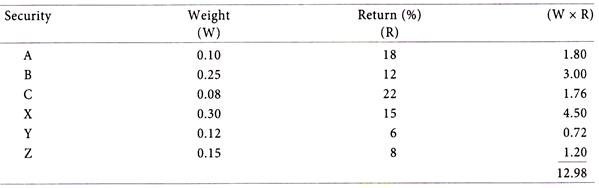
... Portfolio return is 12.98%
Risk of Portfolio of Two Assets:
The risk of a security is measured in terms of variance or standard deviation of its returns. The portfolio risk is not simply a measure of its weighted average risk. The securities consisting in a portfolio are associated with each other. The portfolio risk also considers the covariance between the returns of the investment, covariance of two securities is a measure of their co-movement, it expresses the degree to which the securities vary together.
The standard deviation of two share portfolio is calculated by applying the formula given below:
![]()
Where:
σp = Standard deviation of portfolio consisting securities A and B
WA, WB = Proportion of funds invested in Security A and Security B
σA , σB = Standard deviation of returns of Security A and Security B
ρAB = Correlation coefficient between returns of Security A and Security B
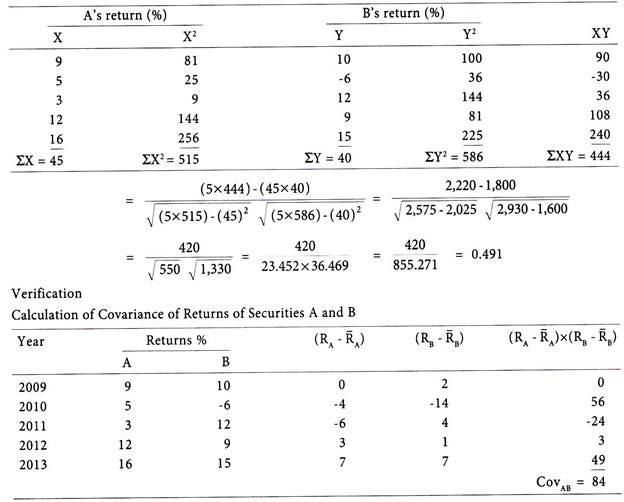
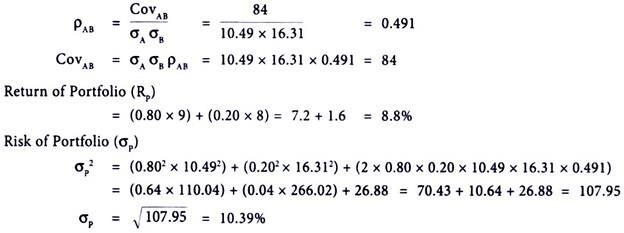
The correlation coefficient (ρAB) can be calculated as follows:
ρAB = CovAB/ σA σB
The covariance of Security A and Security B (CovAB) can be presented as follows:
CovAB = σA σB ρAB
The diversification of unsystematic risk, using two security portfolio, depends upon the correlation that exists between the returns of those two securities. The quantification of correlation is done through calculation of correlation coefficient of two securities (ρAB).
The value of correlation ranges between -1 to 1, it can be interpreted as follows:
If ρAB = 1 No unsystematic risk can be diversified
If ρAB = -1 All unsystematic risk can be diversified
If ρAB = 0 No correlation exists between the returns of Security A and Security B.
Illustration 14:
The returns of Security A and Security B for the past six years are given below:
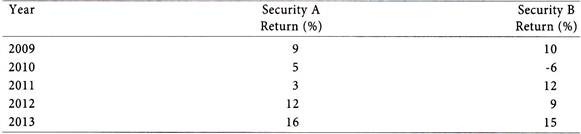
Calculate the risk and return of portfolio consisting.
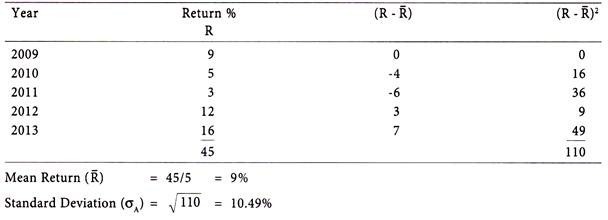
Calculation of Mean Return and Standard Deviation of Security A:
Calculation of Mean Return and Standard Deviation of Security B:
Optimal Portfolio of Two Assets:
The investor can minimise his risk on the portfolio. Risk avoidance and risk minimization are the important objectives of portfolio management. A portfolio contains different securities, by combining their weighted returns we can obtain the expected return of the portfolio. A risk averse investor always prefer to minimize the portfolio risk by selecting the optimal portfolio.
The minimum risk portfolio with two assets can be ascertained as follows:

Calculation of the proportion to be invested (WA) in Security A.
![]()
Therefore, 87.5% of funds should be invested in Security A and 12.5% should be invested in Security B, which represents the optimal portfolio.
Portfolio Diversification and Minimization of Risk:
The important principle to consider that in an efficient capital market, investors should not hold all their eggs in one basket; they should hold a well-diversified portfolio.
In order to diversify risk for the creation of an efficient portfolio (one that allows the firm to achieve the maximum return for a given level of risk or to minimise risk for a given level of return), the concept of correlation must be understood.
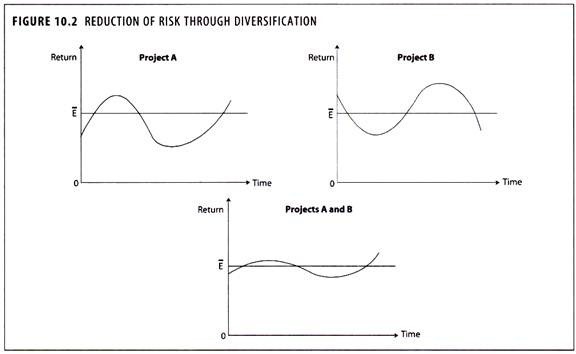
The gains in risk reduction from portfolio diversification depend inversely upon the extent to which the returns on securities in a portfolio are positively correlated.
Ideally the securities should display negative correlation.
This implies that if a pair of securities has a negative correlation of returns, then in circumstances where one of the securities is performing badly the other is likely to be doing well, and vice versa in reverse circumstances.
Therefore the ‘average’ return on holding the two securities is likely to be much ‘safer’ than investing in one of them alone.
Risk and Required Return:
The expected rate of return of an investment reflects the return an investor anticipates receiving from an investment.
The required rate of return reflects the return an investor demands as compensation for postponing consumption and assuming risk.
The required rate of return of an investment depends on the risk free return, premium required for compensating business and financial risks attached with the firm’s security.
The required rate of return also reflects the default risk, managerial risk and marketability of a particular security.
The greater the risk, the greater the compensation one would require.
This compensation is in the form of increased rate of return. Investments which carry low risks, such as high grade bonds, will offer a lower expected rate of return than those which carry high risk such as common stock of a new unproven company.
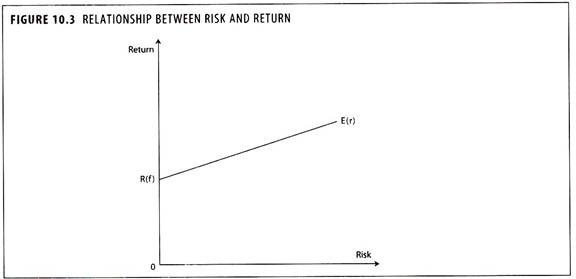
Risk is measured along the horizontal axis and increases from left to right. Expected rate of return is measured on the vertical axis and rises from bottom to top, the line from 0 to R(f) is called the rate of return on riskless investments commonly associated with the yield on government securities.
The diagonal line from R(f) to E(r) illustrates the concept of expected rate of return increasing as level of risk increases.
The example shows a linear relationship between risk and return, but it need not be linear.
Most of the theoretical work on portfolio management assumes a linear relationship between risk and return which may be true for an efficiently run competitive market in developed economies, but in developing countries like ours with administered interest rates and many other restrictive regulations, this linear relationship generally does not hold.
The entire scenario of security analysis is built on two concepts of security return and risk. Figure 10.4 represents the relationship between risk and return.
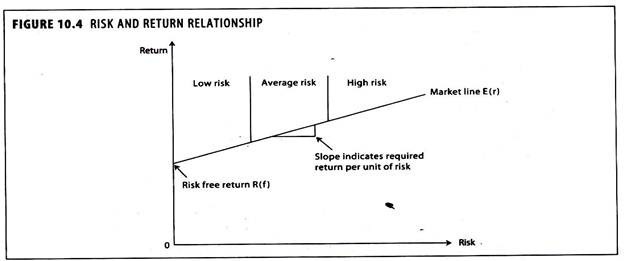
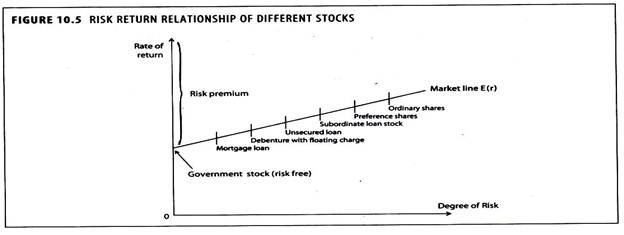
The slope of the market line in Figure 10.5 indicates the return per unit of risk required by all investors. Highly risk-averse investors would have a steeper line, and vice versa.