
Here is an essay on the ‘Investors and their Characteristics’ for class 11 and 12. Find paragraphs, long and short essay on the ‘Investors and their Characteristics’ especially written for school and college students.
Essay on Investors and their Characteristics
Essay Contents:
- Essay on the Introduction to Investors and their Characteristics
- Essay on the Age Wise and Sex Wise Distribution of Investors
- Essay on the Income Wise Distribution of Investors
- Essay on the Education Level Wise Classification of Investors
- Essay on the Occupation Wise Classification of Investors
- Essay on the City Wise Distribution of Investors
Essay # 1. Introduction to Investors and their Characteristics:
ADVERTISEMENTS:
Demographic variables are a popular basis for segmentation of investors.
The reasons for their popularity are:
(i) The “actionability” or accessibility to segments described by the variables and
(ii) The relative ease and accuracy of measurement and interpretation of these variables and easy availability of information both at the macro and micro level from various secondary sources.
ADVERTISEMENTS:
Demographics describe who the investors are? Demographics have their place in segmenting individual investors. The demographic characteristics refer to Age, Sex, Income, Education, Occupation and city of residence of individual investors. The analysis in the following sections will throw light on these aspects.
Essay # 2.
Age Wise and Sex Wise Distribution of Investors:
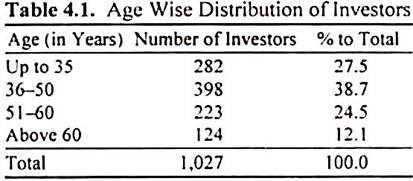
The age wise distribution of investors is given in Table 4.1. The Table reveals that a little less than two fourths of the investors are in 36-50 years, a little more than one fourth of the investors to be up to 35 years of age and the balance one third of investors are above 50 years of age. It can be said that 36-50 years age group investors dominate the sample. The average age of the investors works out to 45 years.
Sex Wise Distribution of Investors:
ADVERTISEMENTS:
Table 4.2 presents the sex wise composition of investors.
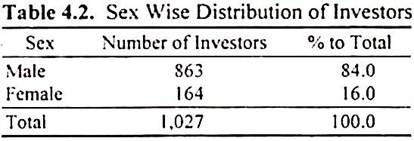
Male investors constitute a large majority 84 percent as compared to 16 percent of the female investors. In other words, male investors were more than 5 times in numbers compared to female investors.
ADVERTISEMENTS:
Age and Sex Wise Classification of Investors:
The age wise classifications of investors were further classified into male and female. The results are given in Table 4.3 and Fig. 4.1.
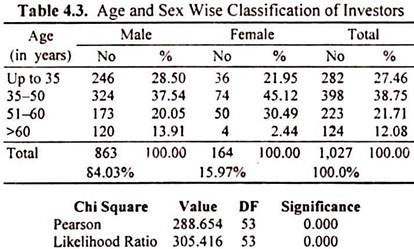
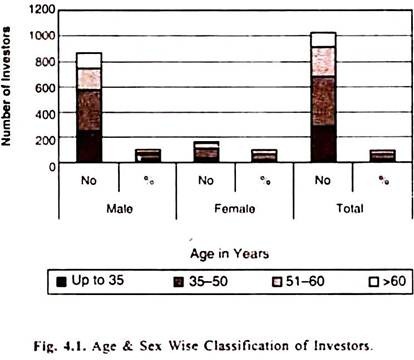
Table 4.3 and Fig. 4.1 reveal that among the various age groups both female investors and male investors are in the highest proportion in the 35-50 years age group. The 35-50 years group is the modal age group. 37.5% of males and 45.1% of females belong to this age group. Two thirds of investors were below 50 years of age.
ADVERTISEMENTS:
Essay # 3.
Income Wise Distribution of Investors:
ADVERTISEMENTS:
The distribution of investors according to their income level is presented in Table 4.4.
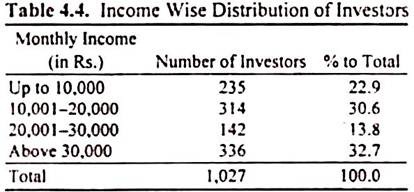
The modal income class is above Rs. 30,000 per month. This group constitutes nearly one third of the sample and the Rs. 10,001 – 20,000 income group accounts for another 31%, while the rest two groups (up to Rs. 10,000 and Rs. 20,001-30,000 per month) accounting the balance 36%.
ADVERTISEMENTS:
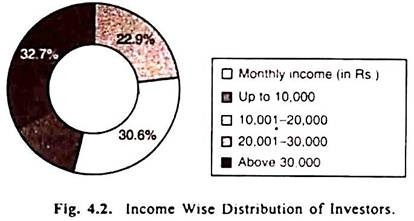
To indicate the population strata represented by investors, it may be mentioned that the mean monthly income of the investors was Rs. 15,000 and the upper quartile was Rs. 35,000. Interestingly, the largest number of investors belongs to the highest income group. Figure 4.2 makes a pictorial presentation of income based classification of investors.
Income and Sex Wise Classification of Investors:
ADVERTISEMENTS:
Having known the income wise distribution of the investors, it is necessary to know the sex wise distribution of investors with in these income groups. Table 4.5 provides this classification.
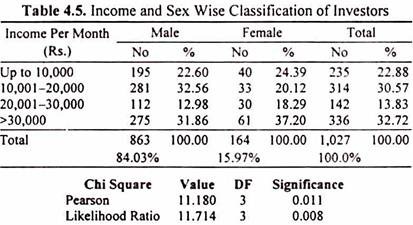
Table 4.5 and Fig. 4.3 highlight the income and sex wise classification of investors. The modal income class of the male investors is Rs. 10,001-20,000 with 32.5% of investors falling there in. Female investors belong to a higher modal income class, for the highest proportion (37.2%) of them belonging to the above Rs. 30,000 income group. 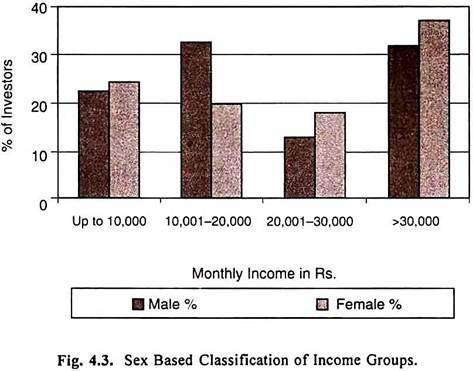
Income and Age Wise Classification of Investors:
The income wise classified investors were further classified on the basis of their age groups. Table 4.6 brings out the classification.
The Table 4.6 reveals that the upto Rs. 10,000 income per month group is dominated by 50-60 years of age investors, Rs. 10,001-20,000 income group is dominated by 36-50 years of age investors, Rs. 20,001-30,000 income group is dominated by up to 35 years of age investors and the above Rs. 30,000 income per month group too is dominated by 36-50 years age group.
ADVERTISEMENTS:
The above 60 years of age investors are spread nearly equally in all the income groups except in the 20,001-30,000 income group.
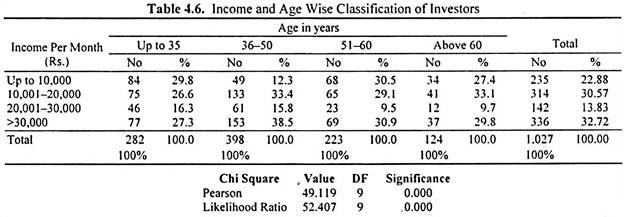
The chi-square test identifies that there exists significant differences among the income groups on the basis of the investor’s age.
Essay # 4.
Education Level Wise Classification of Investors:
Education is an important parameter of analysis. It makes the investors more prudent and analytical, for one can learn more about the intricacies of the investment with increasing levels of education. The distribution of investors according to the levels of education is given in Table 4.7 and Fig. 4.4.
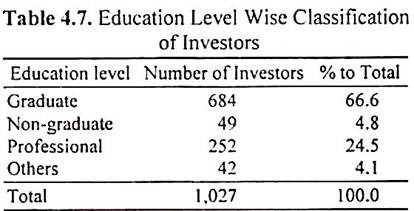
The Table reveals that two thirds of the investors are graduates and one fourth to be professionals and the balance shared equally by non-graduates and others.
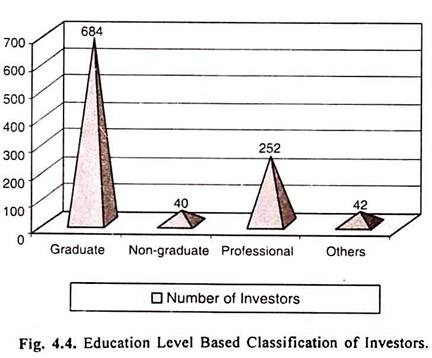
Thus it can be said that 9 out of 10 investors are educated enough to understand the ongoing reforms in the capital market and they can acclimatize themselves with the changing capital market environment.
Essay # 5.
Occupation Wise Classification of Investors:
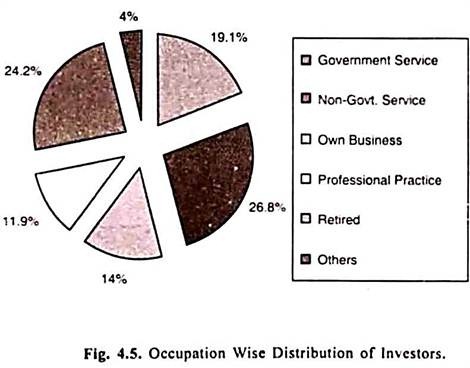
The distribution of investors according to their occupations in given in Table 4.8.
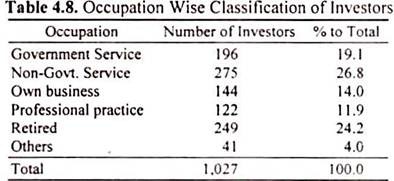
A cursory view of the Table 4.8 and Figure 4.5 reveals that little more than one fourth (26.8%) of the investors comprises of non-government service investors and a little less than one fourth (24.2%) of the investors comprises of retired investors. Nearly 12% of the investors were practicing professionals, one fifth was in Government service and 14% of the investors had their own business.
Occupation and Sex Wise Classification of Investors:
The distribution of investors belonging to different occupations according to sex, as contained in Table 4.9 offers interesting insight.
Evident among these are as follows:
Irrespective of the sex, the investors are distributed among different occupations such that the highest proportion (26.8%) is in non-government services, while the lowest (4.0%) are engaged in other than the listed occupations.
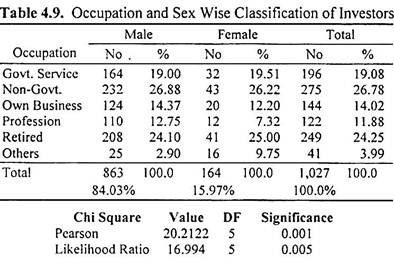
While the distribution of male investors follows the overall occupation proportions, that of female investors deviate in that the professional group is under represented and other occupations are over represented. They are in similar percentage with that of male investors in non-government service. The Chi-square value of 20.2122 is significant at 0.001 level indicates that the differences among the different occupation groups based on sex is highly significant.
ADVERTISEMENTS:
Essay # 6.
City Wise Distribution of Investors:
ADVERTISEMENTS:
The investors forming the backbone of this analysis belong to eleven different cities in different States of our country except that Chennai and Coimbatore representing the Tamil Nadu State.
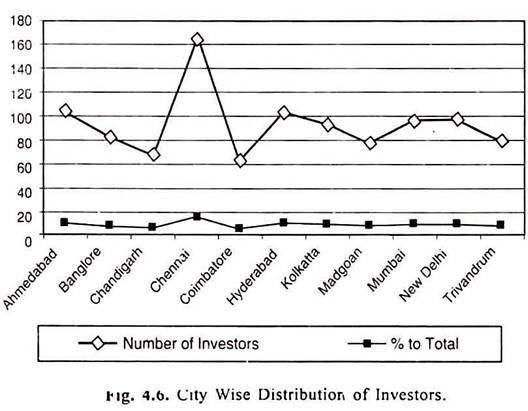
These cities were selected based on the information provided by Distribution of Beneficial Accounts at National Securities and Depositories Limited as on 31st August, 2004. The respective States of these eleven cities had nearly 82% of the beneficial accounts as on that date. Table 4.10 brings out the city wise distribution of investors.
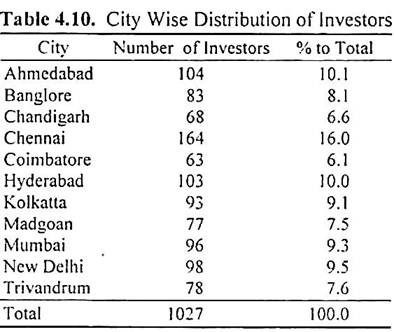
The above table reveals the city wise distribution of investors. Figure 4.6 presents the city wise distribution graphically. Nearly one sixth of the investors are from Chennai. Investors from Hyderabad and Ahmedabad constituted 10% each and Mumbai, Kolkata and New Delhi together constituted nearly 28%.
The rest 35% of investors were from other cities such as Trivandrum, Bangalore, Chandigarh, Coimbatore and Madgaon.
ADVERTISEMENTS:
City Wise Age Based Classification of Investors:
The age wise composition of the investors revealed 36-50 years group dominated with nearly two fifths of the investors. Is that groups’ dominance prevails in all the cities or is it just an overall result? Table 4.11 provides the answer.
An analysis of Table 4.11 brings out the age-wise composition of investor groups. New Delhi had the maximum percentage (46%) of its investors in the up to 35 years, Hyderabad had the maximum (64.1%) of its investors in 36-50 years, Trivandrum had the maximum (36%) of its investors in 51-60 years and Kolkata had the maximum (36%) of its investors in the above 60 years of age groups. Trivandrum has the least 20 percent and Hyderabad has the maximum 60 percent of their investors in 36-50 years age group.
The Chi square value of 192.050 is significant at 0.000 level indicating that there exists highly significant differences among the cities with respect to the age composition of its investors.
City Wise Sex Based Classification of Investors:
After knowing about the city wise distribution of investors and their age composition, an attempt has been made to bring out their sexual composition. Table 4.12 provides the details.
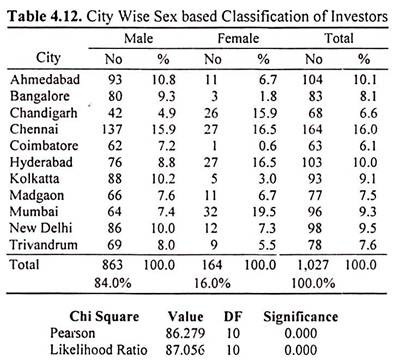
Table 4.12 shows the city wise, sex based classification of investors. On an overall basis males constitute 84 percent and females constitute 16 percent of the investors. Of the male investors, Chennai contributed the highest nearly 16 percent, followed by Ahmedabad (10.8%) and Kolkata (10.2%).
Nearly one fifth of the female investors were from Mumbai followed by Hyderabad (16.5%) and Chennai (16.5%). Bangalore had the least representation in female group with just three investors constituting 1.8 percent.
City Wise Income Based Classification of Investors:
The city wise classification of investors was further classified on the basis of the income groups. The result is given in Table 4.13.
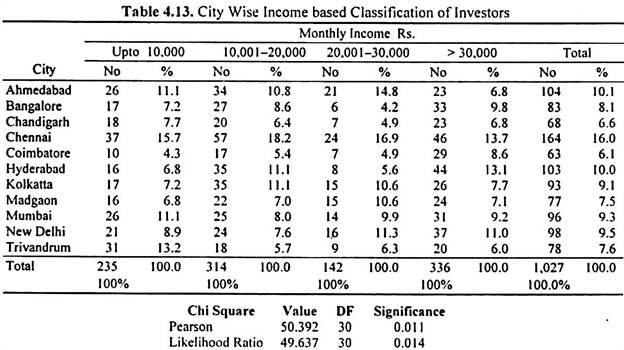
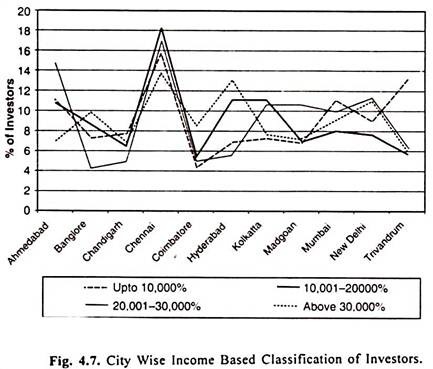
Table 4.13 and Fig. 4.7 give the city wise, income based classification of investors. On an overall basis Chennai lead the investor classification in all four income groups. Ahmedabad and Mumbai with a representation of 11 percent each followed Chennai in the up to Rs. 10,000 income group.
Hyderabad and Kolkata with a representation of 11 percent each followed in Rs. 10,001 to Rs. 220,0000 and Ahmedabad with 14.8 percent followed in the Rs. 20,001 to Rs. 30,000 and Hyderabad with 13.1 percent followed in the above Rs.30,000 groups. The Chi square test reveals that the differences among the different cities on the basis of income groups of investors are significant.
City Wise Occupation Based Classification of Investors:
The city wise classification of investors was further classified on the basis of their occupation. Table 4.14 present the resultant analysis.
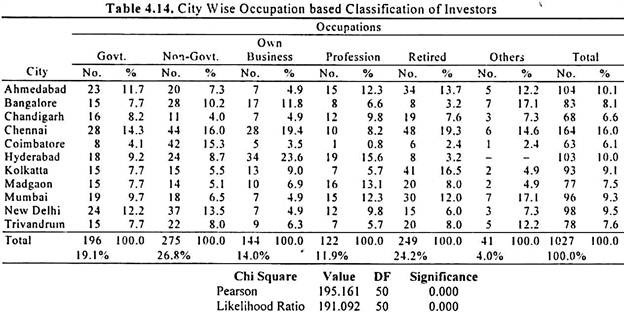
Chennai dominated in three occupational groups, viz., Government service (14.3%), Non-Government Service (16%) and Retired Investor (19.3%). New Delhi with 12.2%, Coimbatore with 15.3% and Kolkata with 16.5% occupied the second position in those occupation categories respectively.
Hyderabad took the lead in own business and professional practice groups. Chennai in own business and Madgaon in professional practice occupied the second positions. The investors representing other occupations were in small percentage (4.0%) on an overall basis.
Bangalore, Mumbai and Chennai accounted for one half of this other occupational group investors. Thus the various occupational group investors were from all the eleven cities covered by this analysis. The chi square test reveals that there exist significant differences among the various cities on the basis of the occupation of the investors.
Conclusion:
On an overall basis the demographic characteristics of the investors can be summed up as follows – Nearly 6 out of 7 respondents are men and nearly two thirds are up to 50 years of age. Further two thirds of the investors are graduates. More than one fourth of the investors were salaried in Non-Government service and nearly one third have a monthly income of more than Rs.30,000. Further, the investors from the four metros constitute 44 percent of the investors.