There are following two methods to obtain break-even point: 1. Mathematical Method 2. Graphical Method.
1. Mathematical Method:
Let cost be the common variable in two situations 1 and 2, then cost equations will be;
C1 = f1(x)… a function of (x) …(1)
C2 = f2(x)… another function of (x) …(2)
C1 – may be as total cost, annual cost, cost per item or cost per day etc. for situation 1.
C2 – same as C1 but application to situation 2.
x – variable effecting C1 and C2.
To solve for the value of x, let
C1 = C2
i.e, f1(x) = f2(x) … (3)
Equation 3. can be solved for obtaining the value of x. The value of x making the cost equal in both the situations is called “Break Even Value”. Below this value of x one situation will be economical while above it another situation will be economical.
Example 1:
A 25H.P. unit is required to drive a pump to remove water from a tunnel. The number of hours for which the power unit will run per year is dependent on weather conditions. The power unit is to be used for 4 years.
For the supply of power following two plans are under consideration:
Plan I:
This plan requires the construction of power line and purchase of electric motor at a total cost of Rs.16,000. The salvage value of which is Rs.4000 after 4 years of working. Cost of electricity per hour of operation is Rs.6.80. Equipment being automatic, no attendant is needed. Maintenance is estimated to Rs.2400 per annum.
Plan II:
This plan needs a gasoline engine, which costs Rs.11,000. The engine will be condemned at the end of 4 years. The cost of fuel and oil per hour of operation is estimated as Rs.8.40. Hourly wages of operator is Rs.2.00. Maintenance is estimated at Rs.3 per hour of operation.
Solve by “Break-even point” theory, which of the plan will be economical?
Solution:
Plan I. Let, N = No. of operation per year
Then, total annual cost:
Plant II. Similarly, total annual cost:
There is one value of N for which the cost of Plans I and II will be equal. Hence N may be determined by equating equation (1) and (2).
For given conditions, annual costs of the two alternatives are calculated to be equal for 401 hours of usage per annum. If usage comes to be less than 401 hours per annum, selection of plan II is economical. For more than 401 hours, the selection for automatic equipment, i.e., plan I will be more economical.
2. Graphical Method:
Although the break-even point may be calculated mathematically, but it is usually represented graphically because it enables manager to see more clearly the break-even point and the possibilities for profits and losses. By using these charts one can predict probable profits at various levels of output.
A break-even chart given in Fig. 69.1 is used to determine break-even point and amount of profit or loss under varying conditions of output and costs. Sales or expenditure in rupees is represented on vertical axis, while output (either in quantity or in percentage capacity) is represented on horizontal axis.
Line A represents the “fixed cost”, line B represents total cost or total expenses, while line C represents sales revenue and indicates income at various levels of output. The point where lines B and C intersect each other, is “Break Even Point”.
The space between lines B and C to the right of the “Break Even Point” represents potential profit, whereas to the left of the “Break Even Point” potential loss. The amount of loss or profit can be measured on vertical scale.
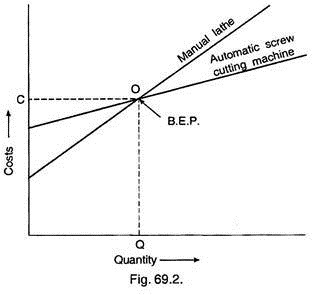
This method can be applied to various management problems. For example, suppose a manager wants to replace an old lathe machine being used for manufacturing screws by automatic screw machine. Then he must first know whether it will be profitable or not, for which he must adopt break-even point theory and construct the chart as explained in Fig. 69.2.
The figure shows that for a production less than Q, it must not be changed whereas for production more than Q, automatic machine or new machine will be economical or in other words below Q manual lathe is cheaper; beyond Q, automatic machine is cheaper. This break-even point is also known as “cut even point”.


