Planning Phase:
Forecasting:
1. Forecasting means estimation of type, quantity and quality of future work e.g., sales etc.
2. The survival of a manufacturing enterprise depends on its ability to assess, with reasonable accuracy, the market trends several years ahead.
3. Forecasters will be able to make use of sales trends, but these must be considered in the light of expected introduction of new materials, fashion changes, policies of competitors, unseasonable weather, threat of war and the general economic situation expected in the country and foreign markets. These circumstances and others necessitate changes in sales forecast from time to time during the forecast period.
4. Forecast represents a commitment on the part of the sales department and each of its divisions of expected sales. It becomes a goal against which the effectiveness of the sales department will be measured.
ADVERTISEMENTS:
5. Forecasting plays a crucial role in the development of plans for the future.
6. Sales budget (estimate) forms the basis for manufacturing budget. It is the sales forecast which enables to determine production quantities, labour, equipment and raw material requirement.
7. A sales forecast should be;
a. Accurate,
ADVERTISEMENTS:
b. Simple and easy to understand, and
c. Economical.
Purpose (or Need) of Sales Forecasting:
Sales forecasting is essential because:
ADVERTISEMENTS:
(i) It determines the volume of production and the production rate.
(ii) It forms basis for production budget [step (6) above], labour budget, material budget, etc.
(iii) It suggests the need for plant expansion.
(iv) It emphasizes the need for product research development.
ADVERTISEMENTS:
(v) It suggests the need for changes in production methods.
(vi) It helps establishing pricing policies.
(vii) It helps deciding the extent of advertising, product distribution, etc.
Sales forecasting, Basic elements of:
ADVERTISEMENTS:
Forecasting means predicting future events by the best possible means.
ii. In any sales forecasting analysis, there are four basic elements of economic data that should be used:
1. Trends.
2. Cycles.
ADVERTISEMENTS:
3. Seasonal variations.
4. Irregular variations.
Trends are the long term, long range movements of a series of economic data. They have little relationship to the month-to-month changes that take place, and they manifest their direction. Cycles are of shorter duration and they are usually featured by alternate periods of expansion and contraction.
Seasonal variations occur within a certain period of year and recur at about the same time and to approximately the same extent from year to year. Irregular variations are the result of unforeseen or non-recurring events that have an economic influence. A strike in a key industry might cause an irregular variation.
ADVERTISEMENTS:
Technological Forecasting:
Since the pace of technological change is so great, and since new products and processes may be keys to a company’s future plans, an increasing number of companies are emphasizing regular and complete technological forecasts affecting their industry. Technical forecasting may be defined as-forecasting the future technology that may affect the operations of an enterprise.
Those companies which have gone far in developing planning premises from their technological forecasts have tended to be high-technology enterprises. What has been done in these instances is to encourage members of their technical staffs to be alert to future developments; to arrange frequent contacts of suppliers customers with development staffs; to think in terms of the impact of current scientific developments on the future state of technology; and to develop orderly forecasts of how these developments affect the company’s products, processes or markets.
One of the attempts to make technological forecasting more accurate and meaningful is the use of Delphi technique. Another method used to forecast the state of technology is opportunity-oriented. It looks at the future and raises the question of whether a certain product may be made obsolete by a new development – and, if so, what development-or whether there is any technological breakthrough that might be expected which would solve a problem seen to exist in the development of a certain product.
For example, the opportunity-oriented forecast might look at the possible development of an atomic power plant for an automobile and ask whether certain known limitation will probably be solved and when. Or one might forecast when economic desalination of sea-water will occur. Another approach has been referred to as the goal-oriented forecast.
In this case, a decision is made to reach a certain goal, the technological needs for accomplishing it are identified, and analysis is made as to when, and perhaps how, these might be accomplished. Thus, after a decision was made to put a man on the Moon by 1970, the technological requirements of so doing were identified, and time and resource estimates were made as to how to achieve the target.
Tool Control:
ADVERTISEMENTS:
Concept:
Tool control implies:
(1) Determining tool requirements,
(2) Procuring necessary tools, and
(3) Controlling/maintaining tools once they have been procured.
A tool or process planner must calculate tool requirements prior to the time of production to ensure that proper tools will be available when needed. Lost time resulting from incomplete tool planning can be expensive as well as causing work to delay. In order to facilitate tool control and to limit the investment in tool inventory, it is important to standardize wherever possible all the tools within an organisation.
ADVERTISEMENTS:
Need for:
Tool control is very important to ensure:
(1) Against loss through theft or negligence and production delays through misplacement or non-availability of tools.
(2) That the investment in tool inventories is minimized consistent with proper tool availability.
Procedure of:
Two methods are commonly used to control the issue and receipt of tools to and from the workers:
ADVERTISEMENTS:
(1) The Brass Ring System:
Brass rings with worker’s identification number marked on them are issued to every worker. When he draws a tool from the crib, he gives one of his rings to the attendant and the ring is hung on a peg at the tool bin. When the worker returns the tool, the ring is returned to him.
This method is very simple and can be used where the workers are not much educated. However it invites dishonesty because of the ease with which counterfeit rings can be made. The method also does not provide any means of determining tool usage.
(2) The McCaskey System:
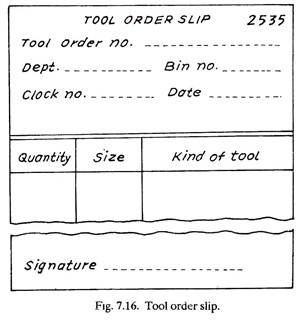
a. This system is based upon 3-part carbon backed form, (Fig. 7.16). The worker fills it out and presents it to the tool crib attendant when he wishes to withdraw a tool. One copy of the form is maintained under a clip with the worker’s name or his clock number and a second copy under a clip of the tool number. The third copy is given to the worker for identification of the tool.
b. The copy filed under tool number provides ready reference that, particular tool is not available when a later request is made for it.
ADVERTISEMENTS:
c. Periodic checks of the slips under the worker’s clip will indicate if tools are being hoarded or held for an excessively long time.
d. When the tool is returned along with the third copy of the form which the worker had kept for his information (identification of tool), the copy under the worker’s clip is removed and given to the worker.
The copy under the tool number clip is removed and placed behind the tool inventory card at the back of each clip. Every month, the slips behind the card are counted to indicate tool usage and the individual slip thrown away.
e. This system is widely used in manufacturing establishments because of its excellent control features.
Loading:
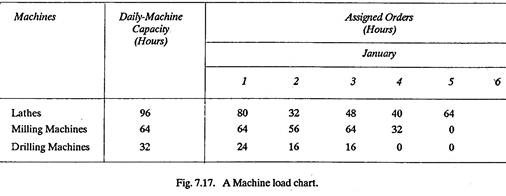
Loading means assignment of work to manpower, machinery etc., without specifying when the work is to be done. Loading results in a tabulated list or chart showing the planned utilization of the machines or work stations in the plant (refer Fig. 7.17). The objective of the loading function is to maintain an up-to-date picture of the available capacity in the plant. Loading can be defined as the study of the relationship between load and capacity at the places where work is done.
ADVERTISEMENTS:
The information provided by loading is used:
(1) To ensure the efficient utilisation of the plant and labour in a factory,
(2) To help in the setting of reliable delivery promises,
(3) And to assist in the forward planning of the purchase of new plant.
Load 1 (v) To assign work to the capacity available at particular work centres. 2(n). The total of the standard times of all the work assigned to a given work center plus allowances for machine idle time, ancillary time and down time; and for substandard performance. Capacity can be defined as the time available for work at work centres expressed in machine hours or in man-hours.
Aims of loading:
(1) To check the feasibility of production programmes.
(2) To assist in the efficient planning of new work.
(3) To assist in balancing the plant to the existing load.
(4) To assist in the fixing of reliable delivery promises.
A load chart (Fig. 7.17) shows the productive capacity that has been sold and at the same time the available productive capacity. Load chart may be prepared for each machine or a group of machines available in the factory. Load charts, as such, are not too common because loading function is usually combined with scheduling and only one set of charts is maintained: The schedule charts.
Scheduling and Control of Production:
Once the planning (work) to meet sales is complete and a set of decisions have been formulated using Graphical or Linear programming methods, the next step is the implementation of the decisions through detailed plans and schedules. Schedules are made for the use of facilities like equipment and manpower.
Scheduling and Control of production focus attention on the following:
(a) Knowing the total overall production targets -how to determine the amount of each product to be manufactured if there are products of different types and sizes?
(b) How to decide about and deploy work force (different types of workers and kinds of skills) and equipment to achieve the target production rate?
(c) How to determine individual work assignments?
(d) What should be the information system to feed back quickly and accurately the actual output duly compared with the scheduled one?
Scheduling and Control of production have one stage in between them, which is known as dispatching. In general, first of all the order is scheduled, then it is dispatched for necessary operation (on the raw material) and lastly the progress of the order is tracked, to be certain that the schedule is being met. This (last) phase of tracking the progress of an order and making corrections (if necessary) is known as control of production.
Routing:
Routing lays down the flow of work in the plant. It determines what work is to be done and where and how it will be done. Taking from raw material to the finished product, routing decides the path and sequence of operations to be performed on the job from one machine to another. The purpose is to establish the optimum sequence of operations. Routing is related to considerations of layout, temporary storage of in-process inventory and material handling.
Routing in continuous industries does not present any problem because of the product type of layout, where the equipment is laid as per the sequence of operations required to be performed on the components (from raw material to the finished products).
In open job shops, since, every time the job is new, though operation sheets (sometimes) may serve the purpose, but the route sheets will have to be revised and this involves a greater amount of work and expertise.
Routing Procedure:
Various procedural steps are as follows:
(a) The finished product is analysed from the manufacturing standpoint in order to decide how many components can be made in the plant and how many others will be purchased (Make/Buy decision) from outside through vendors, by subcontracting, etc. Make/buy decision depends upon the work load in the plant, availability of equipment and personnel to manufacture all components, and the economy associated with making all components within the plant itself.
(b) A parts list and a bill of materials is prepared showing name of the part, quantity, material specifications, amount of materials required, etc. The necessary materials, thus, can be procured.
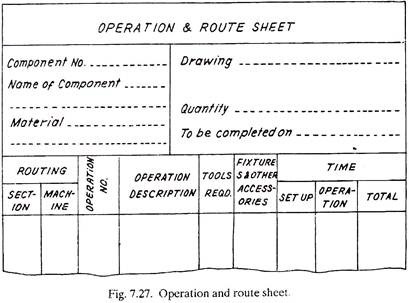
(c) From production standards-machine capacities, machine characteristics and the operations which must be performed at each stage of manufacture are established and listed in proper sequence on an operation and route sheet, (See fig. 7.27). The place where these operations will be performed is also decided.
Actually, operation sheet and route sheet are separate. An operation sheet shows everything about the operations, i.e., operation description, their sequence, type of machinery, tools, set up and operation times, whereas a route sheet besides listing the sequence of operations and relation between operation and machine, also details the section (department) and the machines to whom the work will flow. First two columns of Fig. 7.27 are mainly those of route sheet which show the manufacturing route for given component.
The difference between an operation sheet and a route sheet is that an operation sheet remains same for the components if the order is repeated but the route sheet may have to be revised if certain machines are already committed to other orders (jobs) on hand. Except this small difference, both the sheets contain practically the same information and thus are generally combined into one sheet known as ‘operation and route sheet’.
(d) The next step is to determine the lot size or the number of components to be manufactured in one lot or batch. In the case of an order from a particular customer, it is generally equal to a number within 10% of the order quantity. In other cases the principle of economic batch quantity can be applied to determine the batch size.
(e) Standard scrap factors (single or cumulative) and the places (i.e., after a particular operation or assembly) where scrap is very likely to occur are identified. The actual scrap in each batch can be recorded on the control chart. Causes for points out of control limits are explored and corrected. The variables like workers, machinery and schedules may also be adjusted to minimize scrap.
(f) The cost of the component is analysed and estimated through the information obtained in steps (a) to (e) above. The cost consists of material and labour charges, and other specific and general indirect expenses.
Scheduling:
In brief, scheduling means -when and in what sequence the work will be done. It involves deciding as to when the work will start and in a certain duration of time how much work will be finished. Scheduling deals with orders and machines, i.e., it determines which order will be taken up on which machine and in which department by which operator. While doing so, the aim is to schedule as large amount of work as the plant facilities can conveniently handle by maintaining a free flow of material along the production line.
Scheduling may be called the time phase of Loading. Loading means the assignment of task or work to a facility whereas scheduling includes in addition, the specification of time and sequence in which the order/work will be taken up.
A production schedule is similar to a railway time table and shows which machine is doing what and when. A production schedule is a statement of target Cates for all orders or operations in hand and reveals their starting and finishing dates. Scheduling finalises the planning phase of Production Planning and Control System.
Factors Affecting Scheduling:
The following factors affect production scheduling and are considered before establishing the scheduling plan:
(a) External Factors:
1. Customer’s demand,
2. Customer’s delivery dates, and
3. Stock of goods already lying with the dealers and retailers.
(b) Internal Factors:
1. Stock of finished goods with the firm,
2. Time interval to process finished goods from raw material. In other words-how much time will be required to manufacture each component, subassembly and then assembly (i.e., the final product),
3. Availability of equipment and machinery; their total capacity and specifications,
4. Availability of materials; their quantity and specifications,
5. Availability of manpower (number, type and kind of skills),
6. Additional manufacturing facilities if required, and
7. Feasibility of economic production runs.
Scheduling Procedure and Techniques:
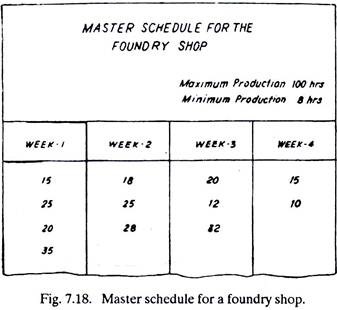
Scheduling normally starts with the Master Schedule. Figure 7.18 shows the master schedule for a foundry shop.
A master schedule resembles central office which possesses information about all the orders in hand. Master schedule, in Fig. 7.18, is a weekly breakdown of the production requirements. The total capacity in any week is of 100 hours of work in the foundry shop.
As the orders are received, depending upon their delivery dates (or priorities, if any) they are marked on the master schedule. When the shop capacity is full for the present week the newly acquired orders are carried over to the next week and so on. A master schedule is thus updated continuously, it depicts a running total of the production requirements and shows the work ahead-yet to be completed. Master schedule is actually the basis for all subsequent scheduling techniques.
A Master Schedule possesses the following advantages, disadvantages and applications:
Advantages:
1. It is simple and easy to understand,
2. It can be kept running (i.e., current),
3. It involves less cost to make it and maintain,
4. It can be maintained by non-technical staff, and
5. A certain percentage of total weekly capacity can be allocated for rush orders.
Disadvantages:
1. It provides only overall picture, and
2. It does not give detailed information.
Applications:
It finds applications:
1. In big firms, for the purpose of loading the entire plant,
2. In Research and Development organisations, and
3. For the overall planning in foundries, computer centres, repair shops, etc.
After framing the overall picture of production requirements through a Master Schedule chart, the detailed schedules are thought of and made for each component and subassemblies so that all parts are available at the time of assembly. There are a number of visual aids and techniques, both in the form of conventional charts and commercially available boards, which aid in detailed scheduling.
The technique to be employed for scheduling purposes depends upon the type of production (intermittent or continuous), type and frequency of tasks, demand patterns, etc. A useful scheduling device normally portrays planned production, actual performance and their comparison. Actually, the Gantt Chart (refer Fig.-7.20) forms the basis of commonly used scheduling techniques.
Some of the techniques (besides master schedule) employed for Loading and Scheduling purposes are:
(a) Perpetual schedule
(b) Order schedule;
(c) Loading by schedule period;
(d) Commercial devices.
(a) Perpetual Scheduling:
Like master scheduling, it is also simple and easy to understand, is kept current, involves less costs and can be maintained by clerical staff. But, the information which it provides is very gross and at the same time it is not clear from the chart-when the work will take place.
Making of perpetual schedule involves two steps:
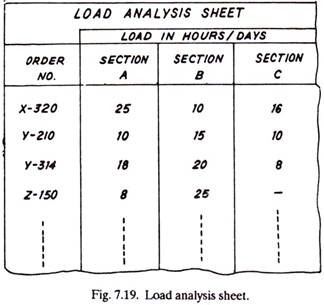
(i) Preparation of Load Analysis sheet from the orders in hand. Figure 7.19 shows a load analysis sheet.
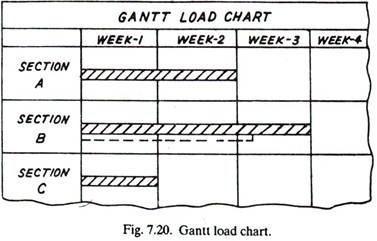
(ii) The total load against each section is added up and knowing the weekly capacity of a section (department), the number of weeks load against each department is calculated and plotted on a Gantt load chart as shown in Fig. 7.20.
The shaded bars show the actual work load against each section.
Additional information, if any (regarding the work load), can be indicated by dotted line.
(b) Order Scheduling:
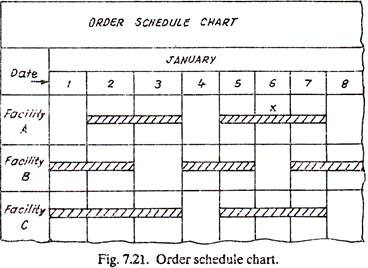
It is a most elaborate technique. Fig. 7.21 shows an order schedule chart. Time is marked horizontally and the vertical axis shows the particular facility (say a machine). The information required to generate an order schedule is, regarding the number of parts to be manufactured, name of the machines, their set-up times, total production time and the date of completion of the order.
The scheduling is started by placing the last operation at the date of completion and then working backwards, For example, if orders takes 3 days to complete and it is to be delivered to the customer on 7th of January, the work will be started on 5th of January.
Order schedule chart has the following advantages and limitations:
Advantages:
(1) It is very detailed.
(2) The earliest possible completion dates can be met.
Limitations:
(1) It is very costly.
(2) It requires accurate (production) time standards and good communication system.
(3) It is difficult to maintain effectively if there are many active orders.
(c) Loading by Schedule Period:
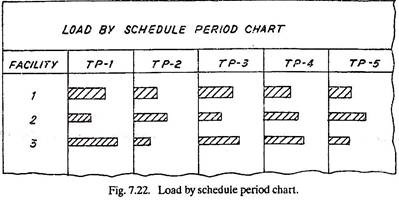
The task is broken into different operations which will be required to turn raw material into finished product. A Gantt type of chart (See Fig. 7.22) is employed for scheduling purposes. The rows, mark different facilities and each column denotes a time period (TP). There are as many time periods as the number of operations. The first operation is carried out in the time period-1, second operation in time period-2 and so on.
It is however not specified that, within the time period, when the operation will start and finish; but the operation is very much supposed to be completed during that particular time period. The shop supervisor does the detailed scheduling within the framework of the specified time period.
The shaded bars show the work ahead of each facility.
This type of scheduling involves a longer in-process (total) time because only one operation is to be performed in one time period. However, this makes it more flexible as an operation can be taken up at the most convenient time within the specified time period.
(c) Some of the Commercial Devices for Loading and Scheduling are:
(a) Produc-Trol Board,
(b) Sched-U-Graph,
(c) Board master,
(d) Magnetic boards, and
(e) Roll charts, etc.
(a) Produc-Trol Board.
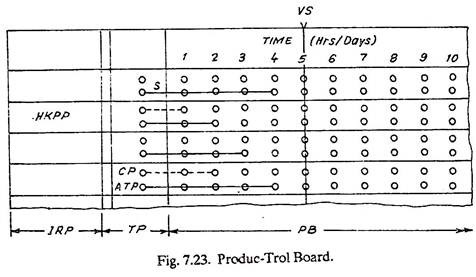
Fig. 7.23 show a Produc-Trol board.
IRP: Index record panel.
TP: Tape pegs.
S: Strings.
PB: Peg board having two rows of holes for each pocket.
HKPP: Heavy craft paper pockets. Each machine is assigned a pocket. A card bearing information pertaining to the machine is inserted in the pocket.
ATP: It is a tape peg showing actual work load for each machine.
CP: It is a coloured peg (shown dotted) that gives special information; for example last week’s load.
VS: Vertical string showing today’s date and the work load position.
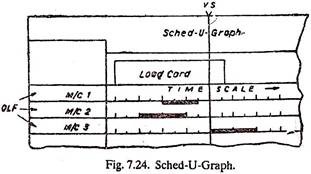
(b) Sched-U-Graph. It is shown in Fig. 7.24.:
OLF:
Overlapping flap. Every flap is projecting about 12 mm below (out) the previous one, and has bottom (12 mm) portion transparent. A card is made for each operation (to be done) on a machine. The card has written on it everything about a job.
The bottom (12 mm) of the card is coloured and the card is cut to a length depending upon the time the job will take on a particular machine. The black strips in Fig. 7.24 correspond to the coloured bottoms of the cards and indicate which machine will be busy during which period. The progress made against each order can also be shown by strips of other colours.
Manufacturing Schedule:
A master schedule is too general to permit adequate day-to-day planning by line supervision, and is usually unnecessary in a small organisation.
Weekly departmental manufacturing schedules supplement the master schedule and must be made to reflect immediate factors, some of which are:
(1) Tool downtime due to broken and worn tools,
(2) Equipment downtime for repair and maintenance,
(3) Shortages and defects in materials,
(4) Absenteeism and
(5) Cancellations and rush orders.
The weekly schedule should take advantage of the most economical setup sequence in a process where more than one part is produced on the same line. It is important to arrange the order of work on the weekly schedule, to minimize setup time. Sometimes much of the same tooling can be used for certain operations on parts A and C.
Part B, requiring a different setup on the same machine, should then follow part C rather than precede it. The operating supervisor can help greatly in working out these combinations. Successive master schedules are corrected from the variations reflected in the manufacturing schedules. Weekly manpower requirements are based on the manufacturing schedules and excessive fluctuations must be avoided.
Scheduling and the Computer:
Since Scheduling is the main process carried out in production control, it is worth to consider the relationship between the computer and scheduling. The computer is an extremely versatile tool which can be programmed to undertake almost any data processing task. In many types of industry, much of the data required for scheduling is relatively fixed in relation to time.
In this category can be included the data contained in parts lists, route cards and plant lists. Many of the data processing needs of production control use this type of data. Examples are, explosion to find parts requirements, implosion to find the requirement of common materials and loading to calculate forward loads on machines and direct workers.
For these types of data processing, the computer is ideal. Continuous data (such as store receipts, store issues, products dispatched etc.) is used by production control in the compilation of stock records, shortage lists and operations statistics. Computer, again, can do the actual data processing much more accurately and quickly than is possible manually.
Action Phase:
Dispatching:
Dispatch function executes planning function. It is concerned with getting the work started. Dispatching ensures that the plans are properly implemented. It is the physical handing over of a manufacturing order to the operating facility (a worker) through the release of orders and instructions in accordance with a previously developed plan of activity (time and sequence) established by the scheduling section of the production planning and control department.
Dispatcher transmits orders to the various shops. Dispatch function determines-by whom the job shall be done and it co-ordinates production. It is the key point of a production communication system. It creates a direct link between production and sales.
A dispatcher is familiar with the productive capacity of each equipment. He always keeps an eye over the progress of orders which move at different speeds on different routes.
Dispatch Procedure. The product is broken into different components and components into operations.
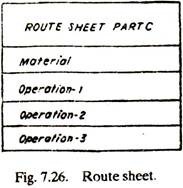
A route sheet for the part (component) C having three operations on it is shown in Fig. 7.26.
The various steps of dispatch procedure for each operation are listed below, in sequence:
(a) Store Issue Order:
Authorise stores (department) to deliver required raw material.
(b) TooI Order:
Authorise tool store to release the necessary tools. The tools can be collected by the tool room attendant.
(c) Job Order:
Instruct the worker to proceed with the operation.
(d) Time Ticket:
It records the beginning and ending time of the operations and forms the basis for worker’s pay.
(e) Inspection Order:
Notify the inspectors to carry out necessary inspections and report the quality of the component.
(f) Move Order:
Authorise the movement of materials and components from one facility (machine) to another for further operations.
In addition, there are certain other dispatch aspects which have to be taken care of:
1. All production information should be available before hand.
2. Various order cards, and specification drawings should be ready.
3. Equipments should be ready for use.
4. Progress of various orders should be properly recorded on the Gantt charts or display boards.
5. All production records should be properly maintained.
Centralized and Decentralized Dispatching:
Dispatch function may be centralized or decentralized. In a Centralized dispatch system, a central dispatching department, orders directly to the work station. It maintains a full record of the characteristics and capacity of each equipment and work load against each machine. The orders are given to the shop supervisor, who runs his machines accordingly. In most of the cases, the supervisor can also give suggestions as regards loading of men and machines under him.
A centralized system has the following advantages:
1. A greater degree of overall control can be achieved.
2. Effective co-ordination between different facilities is possible.
3. It has greater flexibility.
4. Because of urgency of orders, changes in schedules can be affected rapidly without upsetting the whole system.
5. Progress of orders can be readily assessed at any time because all the information is available at a central place.
6. There is effective and better utilization of manpower and machinery.
In a Decentralised dispatching system the shop supervisor performs the dispatch functions. He decides the sequence of handling different orders. He dispatches the orders and materials to each equipment and worker, and is required to complete the work within the prescribed duration. In case he suspects delay, with due reasons of the same, he informs the production control department.
A decentralised dispatching system has the following advantages:
1. Much of the red tape is minimized.
2. Shop supervisor knows best about his shop, therefore, the work can be accomplished by the most appropriate worker and the machine.
3. Elaborate reports and duplication of postings can be avoided.
4. Communication gap is reduced.
5. It is easy to solve day-to-day problems.
6. It keeps the natural urge of a section to be self-sufficient.
The advantages of a centralized system, more or less give an idea about the disadvantages of the decentralized system and vice versa.
Level of Dispatch Office:
Dispatching can be introduced at Plant Manager’s level, Shop Superintendent’s level, at the level of Shop Supervisor or at a Specialist’s level.
Dispatching, at the level of Plant Manager though keeps him informed about all the plant activities and seeks his guidance, yet it may not work very well; because, firstly he (Plant Manager) does not have time to go through each and every detail carefully and secondly it takes a long time for the information to pass down the line to the workers.
Dispatching at Shop Superintendent’s level, again, though keeps him better informed, but does not function well because his basic nature of duties (to look whether the operating facility is performing the scheduled work at an acceptable level of performance or not) do not leave much spare time with him to take care of the overall dispatch function in detail.
Dispatching when introduced at Shop Supervisor’s level, seems to be the best.
This system possesses the following Advantages:
1. Higher levels are not disturbed.
2. Shop supervisor knows best about his shop and thus dispatching can be more effective.
3. The schedule is passed on to the workers in no time.
The Disadvantage in this case is that clerical work for the supervisor increases.
Introducing dispatching at the level of a Specialist (a dispatcher not from within the line organization) has the following advantages and disadvantages.
Advantages:
(1) Shop supervisor is relieved of the clerical work.
(2) The system provides extra manpower.
(3) The system provides special guidance and advice.
(4) Dispatching is done more efficiently.
(5) Effective co-ordination can be attained.
Disadvantage:
The traditionally acceptable practice, that a supervisor assigns the job to the workers under him and supervises them, is lost.
Control of Production (Production Control):
Scheduling completes the planning phase of Production Planning and control. The next is ‘Dispatching’, the action phase.
After dispatching is the control phase or control of production which consists of two parts:
(a) Progress reporting, and
(b) Corrective action.
Production control phase or progress control means the same thing.
The concept of control and control of production is as follows:
A control system involves four stages namely:
(i) Observation,
(ii) Analysis,
(iii) Corrective action, and
(iv) Post-operation evaluation.
A production control system considers these elements in its different functions.
The control of production is necessary to be sure that the production schedules are being met and the job will be delivered as per the pre-decided (scheduled) plans. Production control involves an information feedback mechanism and a system of corrective action. Production control follows up the scheduled plans, compares the actual output with the planned one, and points out deviation, if any, so that the same can be corrected through the adjustments of men, materials and machines.
In brief, a production control group:
(a) Receives work progress reports;
(b) Compares them with the scheduled plans;
(c) Removes causes of delays in production;
(d) Modifies the schedules or plant capacities; and
(e) Expedites the work.
Progress Control:
Once the actual production has started, it becomes essential to keep an eye at the progress of the work so that, if required, timely corrective action can be taken. Progress control means – trying to achieve the standards set, i.e., a certain level of efficiency or a certain volume of production in a specified duration. The system of progress control should be such that it furnishes timely, adequate and accurate information about the progress made, delays and under- or over-loading.
Steps Involved in Progress Control:
(a) Setting up a system to watch and record the progress of the operating facility (production section).
(b) Making a report of the work progress or work accomplishment.
(c) Transmission of report to:
1. Control group for necessary control action, and
2. Accounting group for recording material and labour expenditures.
(d) Interpretation of the information contained in the progress report by the control group.
(e) Taking corrective action, if necessary.
The above-mentioned five steps have been briefly discussed as under:
(a) System to Record the Work Accomplishment Progress charts are normally employed for this purpose. They compare the work progress against a prescribed target, and point out the failure to achieve the same; thus progress charts draw attention for an action or investigation.
The chart construction may have the following four forms:
1. The Bar chart,
2. The Curve chart,
3. The Gantt chart, and
4. Mechanical chart.
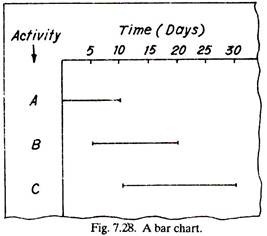
1. The Bar Chart (Fig. 7.28) consists of a number of bars. Each bar has its length proportional to the activity duration. A bar chart is generally used to point out and analyze interrelated data which otherwise is difficult to read.
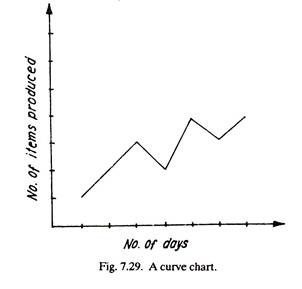
2. A Curve Chart is a graph between two variables (like, number of days and number of items produced) marked along x and y axis. As the days pass, the number of items being produced are marked over the graph. When all such points are joined they indicate the production trend (See Fig. 7.29).
Both the bar and curve charts show the past data. They are not readily adaptable to current or future action.
3. The Gantt Chart was developed by Henry L. Gantt. It is frequently used to keep track of multiple machine schedules. Gantt chart is actually a modified bar chart, wherein load is marked against a time scale with one horizontal bar or line allocated to each machine.
A Gantt chart displays the following:
(1) Plans for future,
(2) Progress on present operations,
(3) Past achievements till date,
(4) Relationship among several variables,
(5) It focuses attention on situations threatening delays,
(6) It tells whether a plan has fallen short and if the delivery dates can be met, and
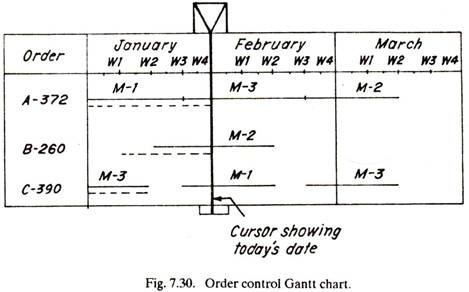
(7) A cursor attached to the Gantt chart (See Fig. 7.30) can be moved across the chart to know the work progress till any particular day.
Two basic types of Gantt chart are used extensively for production control.
(i) Order Control Chart:
Time (in weeks/days) is marked along the horizontal axis and orders in hand are listed along the vertical axis (See Fig. 7.30). The amount of work planned or scheduled is shown by the firm line and the machine on which the order will be processed is marked on the line. The actual progress of various orders is shown dotted.
Cursor placed at today’s date indicates that order A-372 is going as per schedule. Work on order B-260, started one week before the schedule (starting) date and it is about 70% complete which otherwise would have been only 50% as per the plan. Thus order B-260 is ahead of the schedule. Order C-300 which started on the scheduled date, due to some reasons, has got delayed by one week.
(ii) Machine Load Chart:
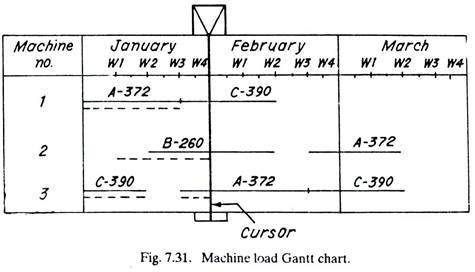
Time is marked along the horizontal axis and various machines are listed along the vertical axis (See Fig. 7.31). The amount of work planned and the actual progress made have been shown by firm and dotted lines respectively. Orders by their numbers have been marked on the horizontal firm lines.
Cursor set at today’s date shows that machine-3 is working as per schedule. Machine- 2 started work on order 5-260 before the scheduled date and the progress is very good. Machine-1 which completed the order, A-372 in time, for some reasons could not take up the order C-390.
From the above Gantt charts the progress of various orders and machine loading can be seen at a glance. Order C-390 has fallen behind the schedule and needs expediting (control action). Maching-1 is loaded up to the middle of February, however machine-2 is available for the third week of February, whereas Machine-3 can be booked only after the middle of March.
4. Mechanical Charts:
They include wall charts, visible index files and other scheduling devices like Produc-Trol board, Board master, Sched-U-Graph, etc. which are commercially available. These equipments have added signaling devices like pegs, strings, clips, etc., to focus the attention on the, situations needing corrective action.
(b) Making a Report of Work Accomplishment:
1. The progress report should contain the following information in order to evaluate actual performance against the anticipated plan and to take corrective action, if any:
(i) Job Identification. It includes order number and operation number.
(ii) Time of report, and
(iii) Work completed.
2. A progress report should contain absolute minimum of information.
3. Progress Reporting Time:
Progress can be reported:
(i) At fixed intervals of time, i.e., weekly, monthly, or yearly depending upon the project duration;
(ii) After the work has been completed, or after each stage of the work is completed; it depends upon the size of the work;
(iii) By using the principle of ‘Management by Exception’; according to which, one reports only those things and at that time when they (things) require an action by the planning group. It is assumed that unreported events are going as per the schedule.
(c) Transmission of Report:
The progress report may be transmitted by employing any one of the following systems:
(i) Written system (pre-written papers),
(ii) Oral system (Telephone, radio, etc.), and
(iii) Electronic system (Telautograph, teletype equipment, etc.).
(i) Written System:
Advantages:
(1) It provides a record for future reference,
(2) The chances of misinterpreting the report are minimized, and
(3) A good amount of necessary information can be supplied.
Disadvantages:
(1) There are chances of papers being misplaced in transit;
(2) Generally, it takes more time for the report to reach the other end ;
(3) File keeping is necessary; and
(4) There is a tendency to send large amount of information.
(ii) Oral System:
Advantages:
(1) Progress can be reported in no time.
(2) Doubts, if any, can be clarified instantly, and
(3) File work is very much minimized.
Disadvantages:
1. There is no detailed record for future reference,
2. There are more chances of misinterpreting the report, and in addition
3. Only brief information can be sent.
(iii) Electronic System:
Advantages:
(1) It possesses all the advantages of the written system, and
(2) Progress can be reported much faster.
Disadvantages:
(1) Equipments required are costly, and
(2) Trained operators are needed.
Based upon the above systems the commonly used techniques for sending progress reports are:
(i) Pre-Written or Pre Typed Papers:
These are sent through messengers from one department to another.
(ii) Pre-Written Papers using Pneumatic Tube Equipment:
Papers are put inside a capsule, which is then placed inside a tube, running from one department to another. The capsule is shot by air to its destination.
(iii) Teletype Equipment:
It has a key board similar to a typewriter. Pressing different keys gives rise to electric signals which are transmitted to receiving stations where the message is recorded.
(iv) Telautograph Equipment:
There is a sending unit and a receiving unit. The sending unit has a stylus which is used to write the report. A pen in the receiving unit records the exact movements of the stylus (of the sending unit) and thus besides the written matter sketches and graphs can also be communicated.
(v) Telephone and Intercommunication Equipment.
(vi) Radio and Loudspeaker:
They are especially useful for outdoor applications to control the movements of materials handling equipments and earth moving machinery.
(vii) Closed Circuit T. V.:
It is employed for keeping an eye over the processes emitting harmful radiations.
(e) Corrective Action:
Factors creating the need for corrective action are,
(A) External Factors:
These factors are beyond the control of the organisation; for example:
(i) Change in the priority of orders due to the arrival of some new orders or due to the cancellation of a few previous orders;
(ii) Delay in receiving equipments, tools, or raw material. This may be due to strike or theft at the vendor’s end or due to the reasons that the raw material which arrived earlier was substandard and hence, was returned for replacement;
(iii) Unexpected rush orders.
(B) Internal Factors:
These factors results from within the organisation; for example:
(i) Labour turnover or mass absenteeism,
(ii) Lack of necessary instructions and materials,
(iii) Late staring of the work, tea breaks, etc.
Methods to take Corrective Action:
(1) Schedule Flexibility:
It means keeping the schedule flexible to accommodate unexpected events. Planning is done only for a percentage of the total working time (say for seven hours out of eight hours shift) and the remaining time is kept free to take care of the unexpected jobs. The percentage of time kept free for rush order, etc., is decided from the past experience.
(2) Capacity Modification:
The following three methods can be employed for modifying the capacity of an organisation:
(a) Changing the number of working hours, either by employing more workers or by using over-time with the same number of workers.
(b) Changing the amount of work within the plant by appropriate Make/Buy decisions or by subcontracting the work to others.
(3) Schedule Modification. If the situation is otherwise non-manageable even afer adoping he above- mentioned measures, the previously established plan can be modified to suit the new set of conditions.
(c) Follow Up or Expediting:
The manufacturing activity of a factory is said to be in control when the actual performance is as per the planned performance. Follow up or expediting regulates the progress of materials and the components through the production process.
Follow up serves as a catalytic agent to fuse the various separate and unrelated production activities into the unified whole that means progress. Follow up is concerned with the reporting of production date and the investigating of any deviation from the predetermined production (or time) schedules. Follow up ensures that the promise (i.e. of delivery dates) is backed up by performance.
The work within the organisation can be expedited by the following two principles:
(i) The Exception Principle:
In exception principle, the scheduling group (on the basis of progress reports), explores the jobs behind the schedule. The expediting group takes up such jobs, procures necessary materials, tools, etc., i.e., (expediting group) solves all problems related to these jobs and intimates the scheduling group to reschedule them.
(ii) The Fathering Principle:
According to fathering principle each expeditor is made responsible for a job or a group of jobs for which he arranges the tools, materials, equipment, etc. Such a system works very well for controlling large projects.
(a) Forecasting:
Estimation of type, quantity and quality of future work.
(b) Order writing:
Giving authority to one or more persons to undertake a particular job.
(c) Product design:
Collection of information regarding specifications, bill of materials, drawings, etc.
(d) Process planning and routing:
Finding the most economical process of doing a work and (then) deciding how and where the work will be done.
(e) Material control:
It involves determining the requirements and control of materials.
(f) Tool control:
It involves determining the requirements and control of tools used.
(g) Loading:
Assignment of work to manpower, machinery, etc.
(h) Scheduling:
It is the time phase of loading and determines when and in what sequence the work will be carried out. It fixes the starting as well as the finishing time for the job.
(i) Dispatching:
It is the transition from planning to action phase. In this phase the worker is ordered to start the actual work.
(j) Progress reporting:
(i) Data regarding the job progress is collected.
(ii) It is interpreted by comparison with the preset level of performance.
(k) Corrective action:
(1) Expediting means taking action if the progress reporting (j) indicates a deviation of the plan from the originally set targets.
(2) Replanning:
Replanning of the whole affair becomes essential, in case expediting fails to bring the deviated plan to its actual (right) path.
Continuous and Intermittent Production:
Continuous production involves a continuous or almost continuous physical flow of material. It makes use of special purpose machines, and produces standardized items in large quantities. Chemical processing, cigarette manufacturing, and cement manufacturing are some of the industries engaged in continuous production.
Continuous production system can be divided into two categories:
(A) Mass and flow line production,
(B) Continuous or process production.
An intermittent production system is typified by the intermittent or interrupted flow of material through the plant. It makes use of general purpose machines and produces components different in nature and in small quantities. Machine shops, repair and maintenance shops, welding shops, etc., are some of the examples of intermittent production.
Intermittent production can be classified as:
(C) Batch production, and
(D) Job production.
(A) Characteristics of Mass and Flow Production:
Mass production means the production of items on large-scale, employing very specialized machines and processes. Items like metal screws and plastic products are made in mass production and their cycle of manufacture involves one or more operations on the raw material on one machine. Items like air- conditioners, T. V. sets and motor cycles come under flow production and are manufactured in continuous stages from process to process. In this type of production there is a continuous and steady flow of materials.
Various characteristics of mass and flow production are:
(1) There is scope for considerable division of labour.
(2) Machinery is laid as per the sequence of production.
(3) Material handling is reduced to minimum.
(4) Very little time is spent on the resetting of machines.
(5) The flow of work is balanced.
(6) Work cycles are short and of repetitive nature.
(7) Time study can be applied, to advantage, to different operations.
(8) Work-in-progress is small as compared to intermittent production.
(9) Procedures (methods), tools and material handling need proper attention.
(10) Plant layout and facilities are designed to suit production requirements.
(11) Flow production is preferred where there is a continuous and regular product demand.
(12) It offers lowest production cost per unit.
(B) Characteristics of Continuous or Process Production:
Continuous or process production is useful where the product consumes fast (electricity, petrol, chemicals, etc.), and has continuous demand.
Various characteristics of continuous or process production are:
(1) All products undergo the same process. Raw material enters at one point and leaves as finished product at another.
(2) Material handling is automatic.
(3) Plant layout is as per the requirements of production.
(4) Both types of workers, i.e., semi-skilled and skilled are employed.
(5) Outputs and inputs are, respectively, measured and regulated, using sophisticated controls.
(6) Machinery employed is one built to the needs.
(7) Good plant maintenance and effective quality control are the essential requirements.
(C) Characteristics of Batch Production:
(1) It is a very common type of production.
(2) Articles are manufactured in batches as per the specific order procured.
(3) Drugs, clothes, paints, parts manufactured on turret lathes, forging machines and sheet metal presses are a few examples of batch production.
(4) Division of labour is possible.
(5) Flow of material is intermittent.
(6) Plant layout is of the process type.
(7) Automation of processes and mechanisation of material handling may be resorted to.
(8) Proper maintenance of equipment and machinery is essential.
(9) Process and product planning is done for each batch.
(10) Expediting and corrective action are very necessary.
(11) A good production control system must be developed.
(D) Characteristics of Job Order Production:
(1) Flow of material and parts from one location to another is intermittent or discontinuous.
(2) Mechanisation and division of labour is not economical.
(3) Each job order is different from the previous as regards its type, specifications, quality and quantity.
(4) Product design takes a lot of time.
(5) Prior planning becomes difficult.
(6) Schedule is prepared for each component of the product, giving the starting and finishing time.
(7) General purpose machinery and a flexible layout are preferred.
(8) Skilled workers and factory made special attachments or accessories do the needful.
(9) High degree of control is essential.
(10) Products like a special purpose equipment, an uncommon material handling device, a special heat treatment furnace, a large turbo-generator, a special electronic equipment, etc., are job order production items.
(11) The number of items to be manufactured is very small, it may be even one item.
Job Shop, Open Job Shop, Closed Job Shop:
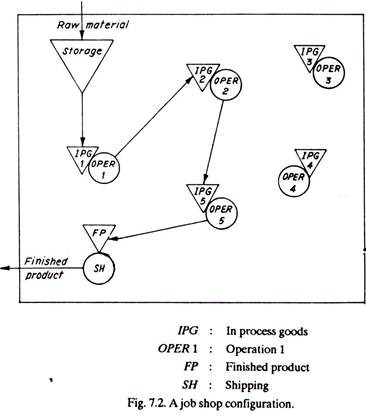
A job shop involves intermittent production. Figure 7.2 shows a job shop configuration. A job shop consists of a number of machine centres, each with a fundamentally different activity.
A few characteristics of job shop are:
(a) A job shop can produce a variety of jobs in small batches.
(b) It utilizes general purpose equipment which can be outfitted with special tools, fixtures and dies to do a number of different operations; and thus different jobs can be made with the same basic machinery.
(c) In a job shop, the material in-process follows different processing patterns in batches through the shop facilities.
(d) Unlike flow shop, in a job shop, the work does not flow in serial fashion, i.e., it is not a serially utilized facility. In flow shop, work would have moved from operation 1,2,3,4,5,FP, with no IPG. On the other hand in job shop, the job moves through different routes depending upon the work to be done.
(e) A job shop makes to order. Normally jobs shops are not open to orders from just any source. They, on the other hand, operate within a field. Examples are, sheet metal fabricating plants, aerospace industry, automobile service centers, etc.
(f) A job shop requires highly skilled workers.
(g) Job shops normally employ overtimes.
Closed Job Shop:
A closed job shop is one which is closed to job orders from outside the organization. The machine shop of a big concern making automobile parts is an example of a closed job shop. It produces inventoriable items of standard design, which have demand in the market. The same items ar6 produced repetitively in cycles.
Open Job Shop:
It produces to order and a similar order may never be repeated. An open job shop makes products as per the requirements of the customers. There may be even one (time large) product/ project. The difference between open job shop and a large project is of the scale and complexity of the product.
One-Time Large Projects:
One-time large projects have the following characteristics:
(a) In one-time large projects, normally one large product is manufactured at a time.
(b) One-time large project differs from job shop in the sense that there is a vast difference between the two as regards the size and scope of the products to be manufactured.
(c) In job shop, the job moves from one facility to another, whereas in one-time large projects, the product being very bulky, the materials and other major components remain at a fixed place whereas workers, tools, portable equipment and other attachments are brought to that place.
(d) A job shop has a process layout whereas one-time large projects prefer static product layout.
(e) In large projects, normally all the activities are planned at one time, using network analysis techniques.
(f) Updating the network is the most important factor which controls the project performance.
(g) One-time large projects are controlled from the progress reports on different activities. The schedules of activities are periodically recomputed.
(h) Examples of one-time large projects are, fabrication of ships, space vehicles, erection of bridges, repair of big aircrafts, etc.
Planning to Meet Seasonal Sales or Demands:
Many products are affected by the pattern of seasonality. Quite some times, this seasonal pattern is fairly predictable unless otherwise influenced by other conditions. Take the example of refrigerators, they are sold during summer. Their sale starts from February and goes up to the months of August or September.
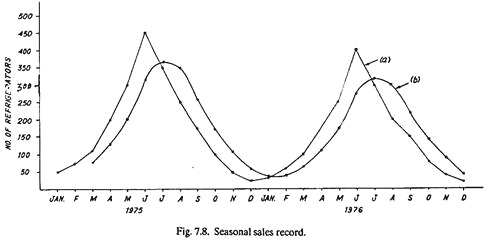
Conditions influencing the sales pattern (every year) are, rise in prices, number of competitors, when exactly the summer starts – is it delayed or starts earlier and how severe it is etc. An arbitrary sales record of refrigerators is given in Fig. 7.8. The figure shows that the number of refrigerators sold in the month of June 1976 were less than the number sold in 1975. Moreover, there is a wide fluctuation in the sales from month to month.
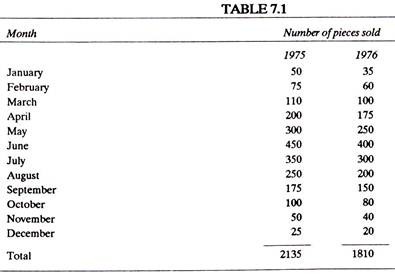
For making the forecast of seasonal sales, the past historic data is analyzed to explore a pattern of sales fluctuation which may serve as a good guide for future. Figure 7.8 has been plotted using the past data given in the Table 7.1.
The month to month variation in demand presents a big problem before the management. An error in forecasting can bring a loss to the factory. If the products forecast and made are less than the actual demand, the concern loses the profit because of the lost sale; and if products forecast and manufactured are more than the actual demand, again it is a loss, because a big capital gets tied up and expenses on upkeep and care of the finished goods are additional.
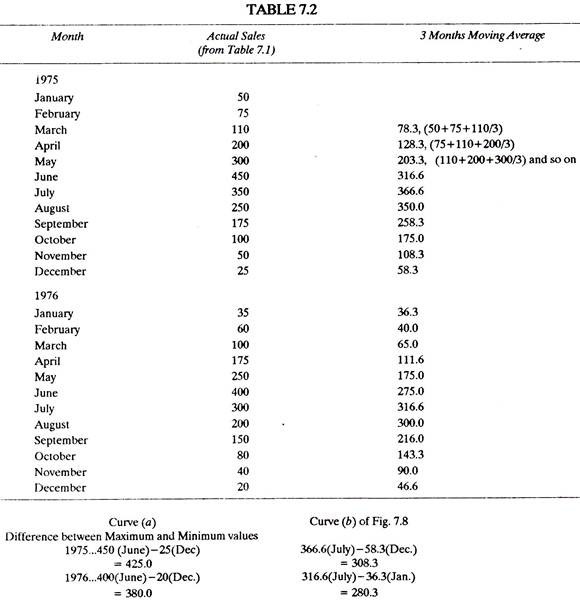
The individual monthly figures of the Table 7.1 (1975-76) (or Fig. 7.8) show a wide variation in the number of pieces sold and as such no useful idea of the sale forecast for the various periods of 1977 can be formulated. The seasonal sales record (Fig. 7.8) becomes better evident when the concept of moving averages is applied to it and the curve (a) is replotted as (b) in the same figure.
Curve plotted with moving averages indicates reduced sales fluctuations; the curve is smoothened and shows seasonal regularity. In other words, when an average demand is estimated by some moving averages (three months, five months or a year) the effects of sales fluctuations are smoothened.
An important decision which the management has to take, in time, is that of adjusting itself with the fluctuations in sales and one method of adjusting response to changes is by the use of averaged figures. The period (3 months, 5 months, etc.) of moving averages and the weighting given to each month control the speed of response of management.
The period, i.e., number of months in moving average can be any suitable number, the more the number of months in the moving average, the smoother is the curve. Normally a three months moving average proves much more stable-every month receives one-third weightage.
Since the sale of May 1975 can give a better picture about the sale of June 1975 as compared to that predicted by March 1975, sometimes (instead, giving equal weighting to all the months of a moving average) more weighting is given to immediately previous month.
The three months moving average for equal weighting of all months is calculated as follows:
The average sale for the month of March is equal to sum of the sales during January, February and March divided by three, For example, 3 months moving averages for March = (50+75+110)/3 = 78.3 (Refer Table 7.2).
In this manner, Table 7.1 is adjusted as Table 7.2:
The difference between maximum and minimum values clearly shows a reduction in sales fluctuation with three months moving average. A five months moving average will still smoothen the (actual) sales curve.
Through the method of moving averages smoothens the peaks and valleys of the seasonal sale, it involves lot of work, of additions and divisions (i.e., calculations). This system becomes still more complex if unequal weightages are imparted to different months. Since the recent data gives a better picture of forecast as compared to comparatively older data, for this reason, more emphasis (weighting) is to be laid on the recent data. Another system using Exponentially Weighted Moving Averages tracks seasonal effects (in addition to average demand and trend effects) but discounts extreme sales fluctuations – considering them as random effects.
The exponentially smoothing system is advantageous over the (normal) moving average method because it involves one only constant, is simple and requires less calculations as compared to unequal weighted moving averages. Like other forecasting techniques this method also relies upon past data to calculate future demands. This system involves a single weighting factor ‘α’ (known as the smoothing constant) which can be easily adjusted to new conditions (risks, etc.).
The new smoothed average forecast
= α (Actual demand) + (1-α) (old average forecast)
Normally the value of lies between 0.01 and 0.30. A small value of has stronger smoothing effect whereas a large value of reacts fast to real fast to real changes in actual sales or demand. This quick reaction is sometimes risky as it may over-response to random fluctuations. Large value of not always produces better forecasts. A suitable value of can be fixed by experienced judgment or by carrying out certain studies.
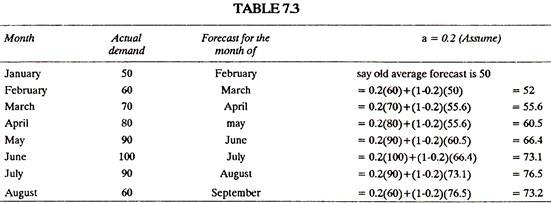
The method of calculating exponentially weighted moving averages is given below:
As an example, the forecast for the month of march = α (Actual demand for the month of February) + (1 —α)(old forecast of the month of February). (Refer Table 7.3).
It can be seen that exponentially smoothing considers times the actual demand of the previous month and (1-α) times the old average forecast demand of the previous month which in turn was calculated after considering the data of still previous months. In other words, a times importance is attached to the demand of immediately previous month. Therefore, larger the value of, the more the new forecast will be affected by the immediately previous month’s demand.
By trying different values of α, a value of the same can be ascertained which in past served very well the interests of the organization and may do so in future if other things do not change to any major extent.
Strategies Used to Absorb Fluctuations in Demand:
Even when smoothened, the seasonal sales curves do not become completely rectified; fluctuation still remains of course to a smaller extent. Therefore, to plan production to meet seasonal sales, one or the other following measures are taken by the management.
In other words, the fluctuations (increase or decrease) in demands can be met by utilizing the following strategies:
(a) If, casually the demand increases, the extra work can be given as subcontracts to other firms.
(b) Inventory levels may be adjusted to absorb seasonal fluctuations in demand. The inventory can be dropped to a lower level of (of operations) as the season peak passes away and vice-versa. However, an inventory level higher or lower than the economic (or deal) quantity level, involves higher costs.
(c) During off peak periods, an industry can shift to different (other) jobs as per their demands. This, of course, requires general or multipurpose equipment and all-round workers.
(d) Work force can be increased or decreased to meet the product demand. Keeping more than necessary workers means extra cost and changing work force every time, brings a bad name to the firm.
(e) Fluctuations in demand can also be met by varying working hours, i.e., by overtime (more working hours or increased number of shifts) or under time (a few idle hours for all the workers or a portion of work force being completely idle).
(f) Increasing or decreasing the prices of the products during high and low demand periods does also help to some extent. Lowering of prices during low demand periods may attract more customers and vice- versa. The prices may be reduced by decreasing inventory investment especially if the products are manufactured in small batches. Though it involves increased set-up time and costs, it does not matter much because, even otherwise the workers are not having sufficient work.
(g) Backorders. Backorders mean the orders which were placed by customers sometimes earlier and which could not be furnished till date. Such orders can be taken up at off peak hours (times) to absorb fluctuations in demand.
Economic Batch Quantity:
If the number of components to be produced is very large, they cannot be manufactured in one batch. Under such conditions it is required to find out-how many pieces (or components) should be produced in one batch so that it is most economical; and this batch size is known as Economic Batch Quantity.
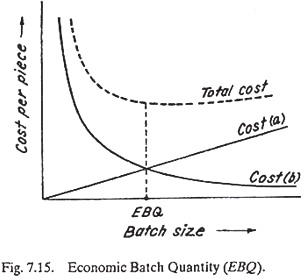
There are two types of costs (Fig. 7.15):
(a) Which increase with the batch size, such as:
(i) Working capital investment in materials and labour,
(ii) Cost of handling and storing materials,
(iii) Insurance and tax charges, and
(iv) Interest on capital investment, etc.
(b) Which decrease with the batch size, such as:
(i) Cost (per unit) of setting up machines,
(ii) Cost of preparing paper work that enters and controls the production of the order, e.g., cost of preparing process sheets, issuing shop order, etc.
The above-mentioned costs, i.e., (a) and (b) are plotted and adding (a) and (b) cost curves graphically (refer Fig. 7.15).
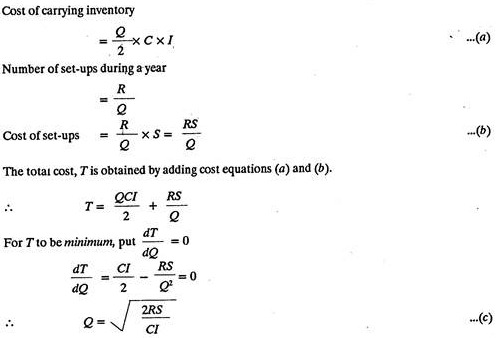
iv. Mathematically, EBQ can be determined as follows:
Assume:
Q is economic batch quantity. R is annual requirements.
S is preparation and set-up cost, each time a new batch is started.
C is constant cost per piece (material, direct labour and overheads).
and I is inventory carrying charge rate per year (it is usually between 0.1 and 0.25). Therefore,
Average inventory = Q/2
Value of average inventory = Q/2 x C
Example 1:
Find the economic batch quantity using the data given below:
Set-up cost = Rs. 20 per set-up
Annual requirements or yearly consumption of parts
= 1000
Inventory carrying cost
= 10% of value/year
Cost per part = Rs. 2
Solution. Given S = Rs. 20.
r = 1000
C = Rs. 2
1= 10% = 0.1
Using above derived equation (c)
1. Therefore the number of batches to be made for manufacturing the parts are 1000/447 = 2.24
2. Nearest, 2 batches can be made and therefore the modified EQB = 1000/2 = 500
.
Flow Control of Material, Component Parts and Subassemblies to Match Those of Finished (Final) Product:
The function of Flow (Production) Control is to match up the rates of flow of parts, subassemblies and final assemblies. Each part should be ready before the time of sub-assembling and each subassembly should be made available at the time and place of assembly in order to make the final product. Flow control achieves this by keeping the parts and subassemblies flowing to the assembly line.
Flow control can be perfected through the following:
(a) Operation Time:
It amounts the time required to manufacture each part, to make one subassembly and to execute one assembly. This information can be had from the operation sheet.
(b) Line Balancing:
The assembly line should be balanced. Each work station should have the same operating time and the various operations should be sequenced properly. There should be perfect balance between the output rates of the parts and the subassemblies. However, it is not always possible that the parts reach in a steady stream immediately before subassembly.
This may be because of the limitations as regards materials, men and equipments or it may be economical to manufacture and supply parts in batches. The flow control section has to cope with such situations and thus carry big inventories and arrange facilities for storage.
(c) Routing and Scheduling:
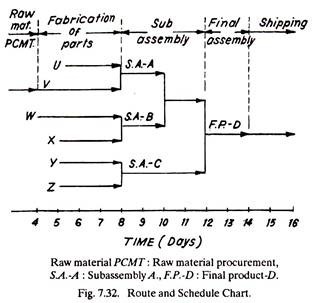
A combination route and schedule chart showing the fabrication of parts subassemblies and final assembly (See Fig. 7.32) in proper sequence, upon a time scale proves to be very advantageous, especially, when there is smooth flow of work. The chart shows that the fabrication of parts v and W starts on the 4th day and the work on parts U, X, Y, and Z is taken up on the fifth day.
All the components should be ready to make subassembly at the beginning of the 8th day and subassemblies should be made available for the assembly of final product on the 12th day. The assembly is over at the end of 13th day and the final product can be shipped on the 14th day.
Knowing the delivery date and the time required to fabricate each part, subassembly and assembly, the chart can be worked out from right to left. Thus obtained date for starting the fabrication of parts and then modified in the light of existing shop loading conditions known from Produc-Trol board or Sched- U-Graph, is used to arrive at the actual date to start the manufacture of each part.
(d) Control of Parts, Subassemblies and Assembly:
A supervisory function coupled with an appropriate information feedback system keeps a check whether the small parts arriving in lots and big parts coming continuously are available at the right time, in proper quantities, types and sizes for making subassemblies as per the scheduled plans.
The difference between the control of parts, subassemblies and assemblies is that, parts may be in thousands, sub-assemblies in hundreds and assemblies in tens. It is always convenient to make an assembly out of subassemblies than from individual parts. The subassemblies are made continuously at a rate which matches the final assembly line requirements.
Control of a subassembly line is easier as compared to that of an assembly because the former involves lesser number of parts. Normally a few parts and subassemblies are always made extra and are kept in stock to take care of rejects, repair services, etc. This has to be considered while scheduling. Lastly, the control of final assembly needs-checking that each final product gets the proper combination of subassemblies which in turn have that of individual parts.
Line of Balance (LOB):
LOB is a manual planning and scheduling technique similar in nature to MRP (material resource planning). This method was developed by the U.S. Navy during World War II. It is most appropriate for assembly operations involving a number of distinct components. In essence, it employs the principle of management-by-exception through a comparison of progress of individual components with the time schedule for completed assemblies.
Regular progress checks reveal the future effect of any current delays and indicate the degree of urgency for corrective action. It complements Gantt technique in determining production status. While the Gantt chart/technique primarily relates information on the effective and efficient utilization of resources (e.g., machine loading, man loading), LOB is more product-oriented. LOB is not directly concerned with the resources expended but is utilized in determining production progress in terms of per cent of task completion.
Major bottlenecks in the production process are emphasized. LOB technique can be regarded as a slightly more sophisticated form of the Gantt chart, the objective being to study the progress of jobs at regular intervals, to compare progress on each operation with the progress necessary to satisfy the eventual delivery requirements, and to identify those operations in which progress is unsatisfactory.
LOB technique is an example of management-by-exception since it deals only with the important or crucial (exceptional) operations in a job, establishes a schedule (or plan) for them and attracts attention to those which do not conform to this schedule. It is particularly useful where large batches of fairly complex items, requiring many operations, are to be completed/delivered over a period of time.
LOB Technique:
LOB technique consists of five main stages, all utilizing graphic aids:
(1) A graphical representation of the delivery objective.
(2) A chart of the production program showing the sequence and duration of all activities required to produce a product.
(3) A progress chart of the current status of component completion.
(4) A Line-of-Balance drawn to show the relationship of component progress to the output needed to meet the delivery schedule.
(5) Analysis of progress
(1) Objective Chart:
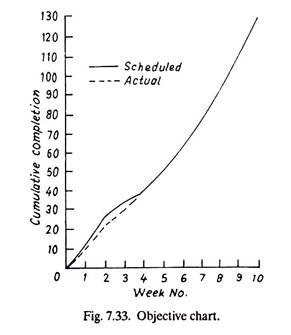
The objective chart (Fig. 7.33) shows the expected schedule of products (i.e. scheduled deliveries) and the actual completion rate (i.e., actual deliveries made by a date).
A dip in the actual deliveries line below the scheduled deliveries line is an obvious cause for alarm.
(2) Program Plan:
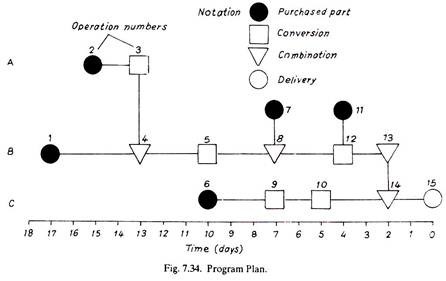
A chart of the operations required to complete one unit of the finished product is called the program plan (Fig. 7.34).
Each major row of activities is associated with one component of the final assembly. The final completion date is zero and the time scale runs from right to left. This plan shows that items B and C must be combined (operation 14) two days before completion. Item C, prior to this combination, undergoes two conversion operations, the second must be finished five days before final completion, and the first, two days before that.
Purchase of the material for item C must be completed by ten days before final combination. The item with longest lead time, 17 days is B. The completed chart serves as a reference to the amount of lead time by which each event must precede final completion.
Events must be completed by their respective lead times to maintain anticipated output. Objective chart and Program plan are prerequisites for use of the LOB technique. They need to be constructed only once for any job, unlike the following documents i.e. (3) & (4) which must be constructed each time the schedule and progress is examined.
(3) Progress Chart:
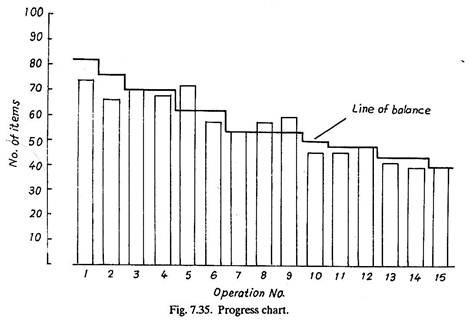
Progress chart shows the number of items which have been finished at each of the critical or important operations at a given date. Suppose, for example, the review date is week No. 4 (Fig. 7.33), by which, according to objective chart, 40 items should have been completed i.e. 40 items should have passed operation 15 (Fig. 7.35) of the program plan. The number of items that have completed this and each of the other operations can be obtained simply by checking inventory levels.
The results can then be depicted by means of a histogram. Fig. 7.34 shows the program progress chart at week No. 4.
(4) Line-of-Balance:
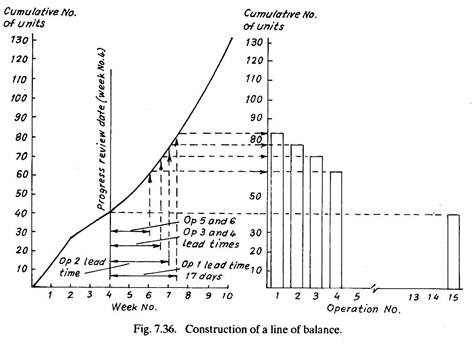
Since the object of the exercise is to compare actual progress with scheduled progress, the information given in progress chart (Fig. 7.35) must be compared to required progress. This is done by constructing a line on the progress chart which shows the requisite number of items which should have been finished at each operation at the time of review. This line- the Line-of-Balance-can be constructed analytically or graphically, the latter method being perhaps the more convenient.
The L.O.B. shows the total number of items which should have been finished at each operation. Clearly, since a cumulative completion of 40 items is required for week No. 4, a total of 40 items must have completed operation 15 by this date. Operation 14 has a lead time of two days, consequently at week No. 4 sufficient items must have completed operation 15 to ensure that completion requirements two days later are satisfied.
From the objective chart the delivery for week No. 4 plus two days is 44 units (assuming five working days per week). The longest lead time-operation 1 –is 17 days consequently at week No. 4 sufficient items to satisfy the delivery requirements for week No. 4 plus 17 days i.e. 82 units should have finished. The graphic procedure shown in Fig. 7.36 is a convenient way of performing these calculations.
(5) Analysis of Progress:
In comparing required progress with actual progress it is again convenient to work backwards, beginning with the last operation (15). From Fig. 7.35 (progress chart) it is clear that the requisite number of completed items have been delivered to the customer (operation 15 = 40), a fact which is reflected by the actual performance line on the objective chart. If shortage occurs, we must obviously attempt to ascertain the reasons. If operations other than those considered as critical are the cause of shortages, then those operations must be included in subsequent versions of the progress and line-of-balance chart.
Advantages:
The L.O.B. is a simple and useful planning and control technique, its main advantages being:
(1) Like network analysis (PERT, CPM etc.), it formalises and enforces a planning discipline which in itself is useful.
(2) It is a simple but powerful procedure, which relies on several assumptions.
Applications/Uses:
In many larger manufacturing firms, LOB is no longer used, particularly since the development of MRPII, which links shop floor control into an integrated system for material planning and control. However, LOB has some advantages in that it is more customer-oriented than MRP. Many small firms and nonmanufacturing organizations still find it a useful technique. LOB technique has also been computerized. Several computer programs have been written and use of these, particularly where many operations are involved and progress reviews are frequent, simplifies the application of lines of balance.
