
The following points highlight the four main types of charts used for presenting production order and method study in an organization. The types are:- 1. Process Charts 2. Schematic Process Chart 3. Charts for Man and Machine 4. Some Special Charts.
Type # 1. Process Charts:
Process chart represents diagrammatically the sequence/order of various operations evolved in a production process from start to finish. Process charts are not drawn to any scale, and use various symbols to represent some movements or activities. The symbols are joined by lines to represent the sequence of activities.
These are based on the concept that there is always some order in which the various operations should occur between the input stages to finished product of a production process. There is some definite linkage between different operations during the course of activities. These charts are of great value in analysing production process and the various methods to perform the operations.
Symbols used in Drawing Process Charts:
A number of symbols are used to denote various operations of a process. These symbols are drawn in a vertical column according to their sequence and in other column their description is given. In some cases more columns can be used in process charts to describe some specific characteristics of the process viz. type of machine required, distance to be moved, time required to complete the work etc.

The common symbols used in process chart are:
Description of situation represented by it.
It represents broad category of operation executed during the course of product production process. An operation occurs when an object is intentionally changed in any of its physical or chemical characteristics by assembling and disassembling from another object. Sometimes-small alphabets or numerals are written inside that circle to denote some specific operation.
An Inspection occurs when an object is examined for identification or is verified for quality or quantity in any of its characteristics to make a check on the inherent human machine weakness.
Movement of men, material or documents from one place to another.
![]()
A Storage occurs when an object is kept or protected against unauthorized removal. Distinction can be made for temporary or permanent storage by writing TS or PS inside the triangle.
A delay occurs to an object when conditions do not permit or require immediate performance of the next planned step.

Shows that operation and inspection are to be carried on simultaneously.
The process chart can be:
(i) Outline process charts showing main operations, inspection and the entering point of material in a process
(ii) Flow process charts showing the sequence of operations, movement, inspection, delays and storage and
(iii) Two handed charts to present the motion of hands in assembly or clerical operations.
(i) Outline Process Charts:
These charts are used only to describe the order of various operations, the activity of inspection and movement, if any, involved in a production process. The numbering of operations starts from the right to a point where another item joins the first item and the numbering is then shifted to the next item on the left, till whole process is numbered.
Operations and inspections are numbered separately according to their hierarchy in the sequence. A summary of the total number of operations as well as the total inspections involved in the process is also given in some place on the chart.
Let some process requires combination of two units namely A and B to produce another unit H. In the combination process, unit A requires four operations and one inspection whereas unit B requires five operations and only two inspections. There is only one operation and inspection required to combine these to get H. Operation flow chart in fig. 7.2 A and B can represent the sequence of operations and inspection.


(ii) Flow Process Chart:
This chart is an improvement over outline process chart in the sense that there is more detailed description of the different operations and inspection require in the production process. These charts also include the information about delay, transportation and storage activities in a production process.
Flow process charts can be for:
(a) Material,
(b) Men and
(c) Men and machines
(a) Material Flow Charts:
These charts deal with the material involved in the process. Points where material enters and the locations where transportation, inspection, delays and storage operations performed on the material are shown in this chart.
(b) Man Flow Process Chart:
This chart depicts the activities of a man in performing his tasks. Storage activity does not appear in this chart.
(c) Men and Machine Charts:
These charts can be used to study the joint operations and activities of man and machine. A specimen of this chart is drawn in Fig.7.3. Recording the observation in a tabular form can easily make the flow process chart. The chart is generally drawn on pre-printed sheets.

(iii) Two-Handed Charts:
Fig 7.4 shows a general two-handed process chart for some hypothetical activity of two hands. These charts generally represent the movements of an operator’s hands during the production process on some specified tasks. Here transportation, delay and operation symbols are commonly used. The chart can help in studying the function of both the hands in doing some task and explore the possibility of improvement if any.

Process charts can be of immense value in planning the layout of a plant and the production operations. It is a mean to represent the basic character of a process symbolically, showing the linkage between various activities. The process charts of existing system can also help in making future improvements in the process.
Type # 2. Schematic Process Chart:
When a product can be produced by alternative methods of production with the same inputs, then one wants to compare the different methods in terms of performance and other characteristics to select the most appropriate method of production.
In such cases the features of each method are depicted on a graph paper containing the details about machine/equipment, labor, land, material and other factors of production involved in the process.
The charts drawn to depict these informations are known as Schematic process charts. The preparation of these charts can be facilitated, if the information related to each factor of production involved in a production process is recorded in a tubular form and the various factors of production for every method of production are listed in the same order. This chart enables step-by- step comparison of the production processes.
Type # 3. Charts for Man and Machine:
Man and Machine in a production process perform many operations simultaneously. To evaluate and analyse then degree of performance in various operations, activity charts are of great importance.
These charts provide valuable information regarding equipment utilization and present the voluminous and haphazardly placed data in to a concise and understandable form. The busy and idle periods both for man and machines can be easily located with the help of these charts. The charts provide a basis for work measurement and operational analysis.
The information about busy and idle periods of man and machine can be used for rescheduling so as to make more efficient use of resources. In technical terms, an activity chart is a graphic representation of the joint/combined activities of man and machine in a system. These describe the situations where both are working independently or together, and the situation when either one or both of them are idle.
Any activity where a man can work without using machine or a machine can run without interference of man is known as independent activity. Loading, unloading and cleaning activities are combined activities of man and machines.
Symbols Used in Activity Charts:
Blank rectangle or space is used to show that one of the two i.e. man or machine is idle.
Dark colored rectangular space shows position/’ period of Independent activity for man/machine is busy.
Stripped space shows when both man and machine are working together i.e. combined activity.
The following examples illustrate the procedure for drawing activities charts and drawing inferences from them:
Example 1:
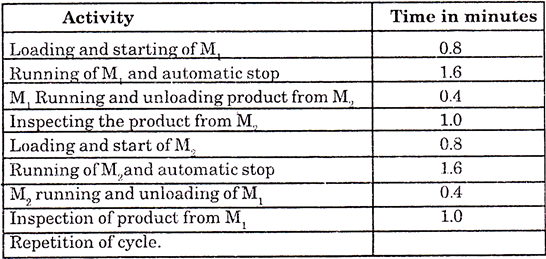
The following estimates of operation time spent on different processes used in manufacturing of a component have been obtained:
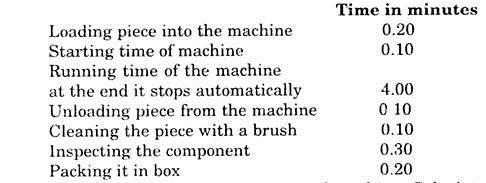
Draw the activity chart of man and machine. Calculate the period of work cycle and find the percentage of machine utilization and operator time utilization.
Solution:
For drawing activity chart, we should first of all find the operations when either man or machine or both of them are busy. This can be done in the Tubular from (7.2)
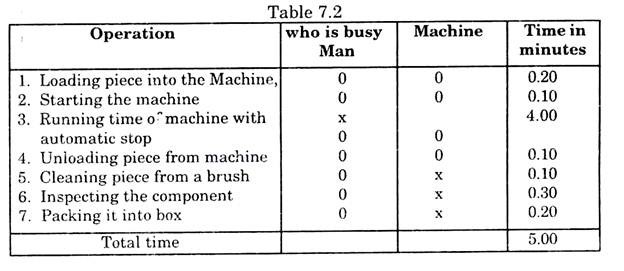
The total cycle time is 5.00 minutes
Percentage of operator utilization
= Time for which operator is busy/Time of the cycle × 100
= 1.00/5.00 × 100 = 20%

Percentage of machine utilization
= Time for which machine is busy/time of the cycle × 100
= 4.40 /5.50 × 100
= 88.00%
The study of activity chart reveals the situation where there can be scope of improvement in man and machine utilization.
This is illustrated by the following example.
Example 2:
The activities of time utilization both for man and machine are given. Investigate the scope of rearranging the activities to have a better utilization of man and machine time.


Solution:
The activities where either man or machine or both are busy arc identified. It is evident at serial number 1, 2, 3, 4, 5, 6, 7, 8 and 9 are the ones where “both man and machine are busy together. At. No. 4 only machine is busy, whereas at No. 10 and 11 only man is busy.
The total time of the cycle is 23.20 minutes. Out of this time machine is busy for 22.60 minutes and the man is busy for 10.80 minutes.
Hence the
Utilization time of man = 10.80/23.20 x 100 = 2.40%
Machine time utilization = 22.69/2.60 x 100 = 97.42%
We can see, that the activities 10 to 11 can be done, when machine is running in another cycle. In that case the idle time for man will be reduced by 0.60 minutes and that for machine will be reduce by 0.60 minutes also. The total duration of the cycle will then become 22.60 minutes, and the man will now be busy for 10.80 minute and machine is busy during the whole cycle.
Hence
machine utilization time = 22.60/22.60 x100 = 100%
and man utilization time = 10.80/22.60 x 100 = 47.79%
Thus the new sequence reduces the idle time both for man and machines. The activity chart can be drawn on the same lines as for Example 1.
Example 3:
In a system, there are two machines and one operator. The details of the activities of man and machines for a particular operation and time required are given below. Draw an activity chart and find the capacity utilization in terms of time.
Solution:
Busy and idle time of the operator and the machine can be located with the help of the tabular form (7.3).

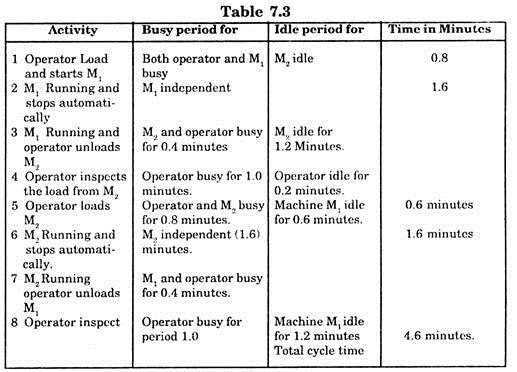
So operator’s utilization time = 4.4 /4.6 × 100 = 95.65%
Machine M1 utilization time = 2.8/4.6 × 100 = 61.30%
Machine M2 utilization time = 2.6/4.6 × 100 = 56%
These charts are also of value is studying maintenance jobs where work-loads are varied and uneven and where several products and machines are to be attended by one operator.
Type # 4. Some Special Charts:
In specific situations and cases some specific charts are used fortune and motion study of operations.
These are:
(i) Relationship charts,
(ii) String diagrams,
(iii) SIMO charts and
(iv) Memeo Motion photography.
(i) Relationship Charts:
These charts are particularly useful in designing the layout of different sections/departments in the organization. The relationship between different sections depends on the nature and order of operations inherent in a production process.
The layout should ensure smooth flow of operations with minimum possible movement of material from one section to other. This is done by listing all the appropriate relationship between various sections does their importance in the production process should be evaluated.
(ii) String Diagrams:
These diagrams show the movement of men and materials during the production process. The position of equipment’s, materials and machine is marked on a scaled layout of the working space. Fixing or drawing threads of different colors around pins can show the movement of materials and operators. The diagram provides the nature and magnitude of movements from one position to other required in the production process.
(iii) Simultaneous Motion Charts (SIMO):
These charts can be used to provide the details of the motion and time of short cycle operations. Here by doing step by step analysis of the whole production process, the short movements are recorded on a time scale e.g. Movement of arm and fingers of both hands during some particular operation. This chart is more exhaustive and detailed than process charts or two-handed charts.
(iv) Memeo Motion Photography:
Here a series of photos are taken at very small intervals (say one second) of time about the movements during various operations of a production process. Time picture provides accurate information about the various activities and become the basis of thorough and detailed time and motion study of the phenomenon.