
Some of the most commonly used forecasting techniques are as follows:- 1. Multiple Regression Analysis 2. Non-Linear Regression 3. Trend Analysis 4. Decomposition Analysis 5. Moving Average Analysis 6. Weighted Moving Averages 7. Adaptive Filtering 8. Exponential Smoothing 9. Modeling and Simulation 10. Probabilistic Models 11. Forecasting Error 12. Historical Analogy 13. Field Survey 14. Opinion Poll 15. Business Barometers 16. Time Series Analysis 17. Extrapolation 18. Input-Output Analysis 19. Econometric Models 20. Panel Consensus Method 21. Delphi Method and a Few Others.
Forecasting Techniques: Regression Analysis, Time Series Analysis, Survey Method, Delphi Method and Probabilistic Models
Forecasting Techniques – Top 11 Techniques
There are many techniques that can be used for the purpose of forecasting. However, different techniques are applied in different situations depending upon the problem situation, context, degree of sophistication required, available time frame for forecasting, etc.
The brief details of these techniques are given below:
1. Multiple Regression Analysis:
It is used when two or more independent variables help in explaining the behaviour of the dependent variable. It is presumed that either a linear or a non-linear relationship exists between independent and the dependent variables. This technique is commonly used for forecasting for a medium- term period.
ADVERTISEMENTS:
It is also used to identify and assess which independent variables need to be included and which variables to be excluded, depending upon their statistical significance in explaining the behaviour of the dependent variable. Variables, which are strongly linked to explain dependent variables are retained as against those which have a relatively weak relationship with the dependent variable.
2. Non-Linear Regression:
While calculating multiple regression under non-linear regression, it is assumed that associated variables have a non-linear relationship amongst them such as exponential, binomial, logarithmic, etc. This technique is commonly used when time is the independent variable.
3. Trend Analysis:
In case of trend analysis involving linear and non-linear regression, time is assumed to be the explanatory variable. This technique is basically used when a particular behaviour and/or pattern is established over time. This technique enables the plotting of aggregated response data on the dependent variable over time.
It is especially valuable and useful for conducting a long running survey and helps in measurement of differences in responses over time. The effect on dependent variable with respect to the time factor can be measured on daily, weekly, monthly, quarterly, half yearly, and yearly basis depending upon the problem under consideration.
ADVERTISEMENTS:
Trend analysis helps in identifying early warning signals of potential problems and issues pertaining to managerial decisions in the area of production planning and control, customer service quality management, etc. This technique also helps in gauging the response rates over time.
4. Decomposition Analysis:
It is a technique used for identifying several patterns that appear simultaneously in a time-series analysis. This is also used to decompose a series of data into definite multiple patterns.
5. Moving Average Analysis:
A moving average is a smoothing technique to arrive at forecast. This method can be used in two different ways, namely simple moving averages (SMA) or weighted moving averages (WMA). These are used to forecast future values based on past values of a variable. This method is relatively easy to update the forecasts for the future.
Thus, simple moving average for a time period is the arithmetic mean of the values in that time period and those close to it. The moving average is one of the most simple, useful, objective, and analytical tools used for forecasting stock prices.
ADVERTISEMENTS:
Some patterns and indicators that may emerge from simple or weighted moving average technique can be at times somewhat subjective and, therefore, may result in the analyst questioning whether a pattern is truly emerging or not.
6. Weighted Moving Averages:
This forecasting technique is used when repeated forecasts are required with a need for giving different weights to the values of an independent variable. This method takes care of the trend adjustment by assigning different weights to time periods. As against this, SMAs give equal weightage to all the days in the average that need not be so in reality.
For example, if a 15-day moving average is used to forecast stock prices for future, then the obvious question that arises is the logic and rationale for assuming the equal weight to the 15-day old stock price being equally relevant when compared to the weight given to a day’s stock prices.
It is important to note that by assigning higher weight factors to more recent data under given time frame say days, fortnight, etc. and smaller weight factors for earlier data in time, the trend will be more responsive to recent changes.
7. Adaptive Filtering:
ADVERTISEMENTS:
It is a special type of moving average technique that involves learning from past errors. This technique for forecasting can respond to changes in the relative importance of trend, seasonal, and random factors.
8. Exponential Smoothing:
It is another form of moving average for time-series forecasting. This technique is simple and an efficient method to forecast evolving seasonal patterns and provides inbuilt flexibility in making adjustments for past errors. It is particularly useful in case of situations where many forecasts need to be prepared.
It uses various forms, depending upon the presence of trend or cyclical variations in the behaviour of the dependent variable. In this method of forecasting we select only one weight, that too for the most recent observation. The weights for other data values are computed automatically and tend to decrease as the data points get older.
The major advantage of this technique is that it minimizes data storage requirements, as all past data is not required to be saved for arriving at a forecast for the next period. Above all, it is simple in concept and a powerful method because of its weighing process.
ADVERTISEMENTS:
However, the major disadvantage of this method is that it does not account for the dynamic changes at work that happen on a daily basis, thus making it necessary to constantly update forecasts arrived at by this method to take care of new developments.
9. Modeling and Simulation:
A model is a representation of reality involving real objects and situations that can be presented in various forms. Mathematical models describe a problem by a system of symbols and mathematical relationships. These are an important part of the objective and quantitative approach to decision-making.
These enable testing of impact of changes in various factors considered while developing a mathematical model. A mathematical model depicting a reality normally has controllable inputs, also known as decision variables, and uncontrollable inputs mainly arising from environmental factors. The inputs to the model that are controlled or determined by the decision-maker are referred to as controllable inputs.
Uncontrollable inputs can either be definitely known or may be subject to variation and involve uncertainty. Deterministic models are the ones in which all uncontrollable inputs to the model can be known precisely. On the other hand, stochastic or probabilistic models are the ones in which uncontrollable inputs are uncertain and are subject to variation.
ADVERTISEMENTS:
For example, if a company’s liability payments and asset cash inflows are uncertain, a stochastic model is needed to understand the behaviour. The characteristic of stochastic model is that the value of output cannot be found with certainty.
Simulation is a useful technique for evaluating alternative forecasting methods. This can be done retrospectively using past data. Simulation refers to replicating a real world situation by incorporating a mathematical model that does not affect operations.
Steps involved in the process of simulation are—defining the problem situation, identifying important variables, developing the simulation model, specifying values of variables to be tested, running the simulation model, examining results/outcomes, and selecting the best course of action.
It is a tool that is widely being used by managers because of its flexibility. The availability of software has made development of simulation models relatively easy. It allows the study of the interactive effect of individual components, and above all, helps in analysing complex real world situations that cannot be solved by conventional quantitative techniques.
ADVERTISEMENTS:
However, it is important to know that simulation models take a long time to be developed and they do not generate optimal solutions such as those generated by other quantitative analysis techniques.
Monte Carlo method of simulation- In case a system under consideration involves chance or uncertain elements, the Monte Carlo method of simulation, which relies on experimenting on probabilistic elements through random sampling, is used.
The four steps involved in Monte Carlo simulation are:
i. Set a probability distribution for important variables
ii. Build cumulative probability distribution for each variable
iii. Establish an interval for random numbers for each variable
ADVERTISEMENTS:
iv. Generate random numbers, and actually simulate series of trials
Certainty Models- Forecasting models that give only the most likely outcome are known as certainty models. Having arrived at forecasts, one can use advanced spreadsheets to do ‘what if analysis. The implications and effects of changes in the independent variables are used for the purpose of forecasting and their implications on the forecasts of dependent variables have become very easy with spreadsheet/excel applications.
10. Probabilistic Models:
These models involve uncertainty and use Monte Carlo simulation techniques to deal with the same. This enables to arrive at a range of possible outcomes for each set of events.
11. Forecasting Error:
All forecasting models involve an implicit or explicit error structure. The objective of forecasting is to minimize this error. The forecast error is defined as the difference between actual or true value and the forecast value or predicted value, as per the prediction model used. One of the measures of accuracy of prediction is arrived at by mean absolute deviation (MAD).
It is computed by taking a sum of absolute values of individual forecast errors to be divided by number of errors. Other measures of accuracy of forecast are mean squared error (MSE) and mean absolute percent error (MAPE). Mean squared error is defined as average of squared errors. Mean absolute percent error is the average of the absolute values of the errors expressed as percentage of the actual values.
The accuracy of forecasts largely depends on the quality, reliability, and efficiency of data used for the forecasting purpose. The quality of data mainly depends on minimization of errors that may occur at the time of compiling and transmission of data. Therefore, it is important that data should be edited to take care of common and obvious mistakes.
ADVERTISEMENTS:
While using any method for forecasting, one must use a performance measure to assess the quality of the method used. Mean absolute deviation and variance are the most useful measures to assess the dependability of the method used. However, it may be mentioned that standard error and not MAD is of more help in making inferences. For arriving at error analysis, variance is preferred indicator, as variances of independent, that is, uncorrelated errors are additive while MAD is not additive.
Thus, realizing that ‘time is money’ in business activities, the application of dynamic decision methodologies in a wide range of managerial decisions is becoming more and more important. Improving the effectiveness and efficiency of decision-making requires the use of various forecasting methods.
The use of an appropriate forecasting method depends upon various factors such as the format of the forecast required, time frame for which the forecast is required, availability of reliable and dependable data, accuracy of the forecast required, cost of development and operation of method used for the forecast, operational ease, and above all, management comprehension, cooperation, and commitment in use and importance of forecasting methods.
Greater sophistication needs to be incorporated in the methodology of forecasting to take care of emerging complexities in the business environment. As such, the quality of decision-making greatly depends on the accuracy of forecasts, as they would be a decisive factor for the success of the organization.
Forecasting Techniques – Qualitative Techniques and Quantitative Techniques
There are various techniques of forecasting. However, none of these techniques are universally applicable. Effectiveness of any forecasting technique depends on the situational variables. Many a time forecasters have to implement a number of existing techniques simultaneously, and, thereby they evolve a new technique for effective forecasting.
Forecasting techniques can broadly be classified as:
ADVERTISEMENTS:
1. Qualitative techniques.
2. Quantitative techniques.
1. Qualitative Techniques:
Qualitative techniques of forecasting emphasize on the use of subjective judgment, past experience and knowledge, etc., of the forecaster for the purpose of making the forecasts.
i. Delphi Technique:
This technique of forecasting is based on at first forming a panel of experts who are physically separated from each other. Questionnaires seeking qualitative and quantitative information pertaining to the issue being forecast are distributed to them and are to be independently answered by them.
Thereafter, a facilitator makes a summary of the results, and, presents it to those experts whose views have sharp deviation from the opinion of majority of the experts. After, further analysis experts are asked to modify their observations. This process is repeated again and again, until a general consensus is arrived.
ADVERTISEMENTS:
The advantage of Delphi technique lies in the fact that it encourages the panel of experts to continually reassess their forecasts and thereby help them to make precise forecasts. However, it is an expensive method of forecasting and experts may be unwilling to reconsider their forecasts in the subsequent rounds owing to ego problems.
ii. Nominal Group Technique:
In this technique of forecasting a meeting is organised to make a forecast. Every participant gets an opportunity to express their opinion in front of others in the meeting. After a detailed discussion the facilitator asks every member to rank their priority opinions on a 1 to 10 scale.
Finally, attempts are made to reach a common consensus. This technique encourages active participation of all members before taking a final call, but, this makes the process time consuming.
iii. Jury of Executive Opinion Method:
In this technique of forecasting experts from different functional areas of an organisation give their forecasts on the basis of whatever information is available to them. Thereafter, these experts modify the forecasts related to their functional area of operation on the basis of forecasts made by other experts. Hence, in the absence of historical data this technique can evolve precise forecasts through group effort, and, by combining the thinking efforts of the different experts. However, it cannot be ignored that some powerful experts may tend to orient the forecast of all in their direction.
ADVERTISEMENTS:
iv. Historical Analogy Method:
This method is used to predict the probability of occurrence of events which have historical similarity. In this technique, analysis and interpretation of historical data is done on the assumption that future trends will follow past trends. This technique may however fail to make correct forecasts for dynamic industries, unless, amendments are incorporated fox the expected changes in the forthcoming years.
v. Deductive Method:
This technique of forecasting is used to make forecasts for industries which are less dynamic and which do not tend to repeat business trends. In this technique, only present data and information is analysed for making the forecast. Historical data have no contribution in forecasting in this case.
vi. Survey Method:
Under this technique of forecasting field surveys are conducted to gather information about likes, dislikes, attitudes, preferences, etc. of the consumers. Then forecasts are made after an in-depth analysis of the qualitative and quantitative data gathered.
2. Quantitative Techniques:
Quantitative techniques of forecasting are those which make use of mathematical and statistical tools. Application of such techniques of forecasting requires the help of experts who have adequate skills and knowledge in this area.
i. Time Series Analysis:
This technique of forecasting at first arranges the past and present data relating to the variable being forecast in chronological order. Then they are decomposed into four components, namely, trend, seasonal variations, cyclical variations and random variations.
Thereafter, a trend line is fitted by application of the method of least squares, after making adjustments on account of seasonal and cyclical variations. This forecasting technique involves less cost and gives more or less precise forecasts, particularly in the long term.
ii. Regression Analysis:
Regression analysis is a statistical technique used to predict value of some unknown variables on the basis of value of some known variables. This is possible after framing a regression equation which depicts the relationship between two or more variables.
iii. Input-Output Models:
This method of forecasting is based on Leontief’s input-output model of the economy. Given the relationship between inputs and output, using this technique, value of output can be predicted when value of input is given and vice versa. This technique is widely used for sector-wise forecasting and for forecasting business events.
iv. Econometric Models:
Under this technique of forecasting predictive models are developed with the knowledge of Economics, Science and Statistics. These models are in the form of simultaneous equations which defines the relationship between the different variables.
Econometric models are needed since a business organisation is under the influence of multiple variables which are difficult to be handled by simple simultaneous equations. This technique is expensive and time consuming. Hence, small firms cannot take advantage of these models.
Forecasting Techniques – Qualitative and Quantitative Techniques (With Examples, Calculation and Formulas)
There are a number of forecasting techniques available but it is responsibility of manager to select that one which is suitable for application to the problem. He should understand the context in which the forecast is to be developed.
The techniques may be classified into two broad categories:
A. Qualitative Technique:
It is also called non-statistical technique. This technique employ only human judgment to predict future. All the information which relate to the situation being estimated are brought together in a logical, unbiased and systematic way.
The following qualitative forecasting techniques are as under:
1. Jury of Executive Opinion:
This method in based on opinion rather than on facts. It involves soliciting the opinions of a group of managers on expected future and combining them to estimate forecasts. The group of managers may be presented openly in a group discussion to arrive at a consensus forecast.
The advantages of this technique are:
(a) It is an expeditious method for developing a demand forecast.
(b) It permits consideration of a variety of factors like, economic, competitive environment, technological and consumer preferences.
(c) It has immense appeal to managers who tend to prefer their judgments to mechanistic forecasting procedures.
Apart from the advantages, this technique also suffers from the following limitations:
(a) The reliability of this method is questionable.
(b) The biases underlying subjective estimates cannot be unearthed easily.
2. Delphi Technique:
This method is used for eliciting the opinions of a group of experts with the help of a mail survey.
The following steps are involved in this method are:
(a) A group of experts is sent a questionnaire by mail and asked to express their views.
(b) The responses received from the experts are summarized without disclosing the identity of the experts, and sent back to the experts along with a questionnaire meant to probe further the reasons for extreme views expressed in the first round.
(c) The process may be continued from one or more rounds till a reasonable agreement emerges in the views of the experts.
The following advantages of this technique are as follows:
(a) It is intelligible to users.
(b) It has a fancy name.
(c) It seems to be more accurate than traditional face to face group meetings.
3. Visionary Forecast:
This method uses personal insights, judgment and when possible facts about different scenarios of the future. The subjective element may enter into the forecast and to the extent it is inaccurate.
B. Quantitative Techniques:
This techniques involve the use of various statistical tools for predicting future events. It is also called statistical forecasting techniques.
The various quantitative techniques of forecasting are as follows:
1. Trend Analysis:
This analysis refers to the chronologically arranged data related with any measurement of time, that is, day, week, month and year etc., and with the passage of time of study of the fluctuations. The main purpose of analysis is to estimate the future events on the basis of knowledge of past events happening and evaluation. The analyst prepares himself for the unforeseen threats and contingencies of future.
The following are some of the methods used in trend analysis to forecast the future based on the past data:
(i) Moving Average Method:
In this method the forecast for the next year is arrived at by taking the average of the actual data for a few immediately preceding years. If the data of preceding three years are considered for arriving, at the forecast for the fourth year, it is called a three year moving average for example –
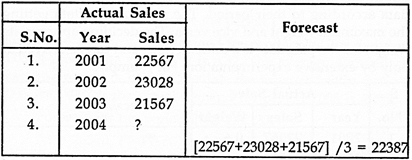
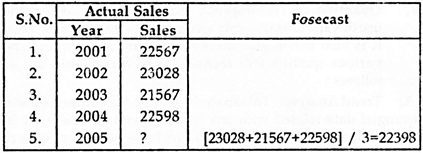
The forecast for the year is 22387 and if the actual sale achieved in the year 2004 is say, 22598, then the three year moving average for the year 2005 is arrived at the taking the average of the actual sales during the immediately three preceding years –
This method is used when the past data do not exhibit a steady increase or decrease in trend over time, but show fluctuations. If the actual data of previous year show fluctuations in a uniform period, this uniform period is taken as the period of moving average.
If the sales data of previous years indicate a steady growth for a continuous three years, followed by a drop in the fourth year, a four year moving average can be assumed for forecasting.
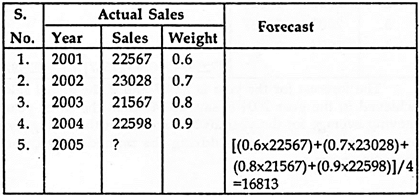
ii. Weighted Moving Average Method:
In the moving average method, only the simple arithmetic average of a few previous years data are taken as the forecast for the next year but in this method, the weightage will be allotted to tine past data according to their period.
The more recent data getting the maximum weight and vice versa. The deciding appropriate weight for the past data is a difficult issue and can be arrived at only by extensive experimentation.
For example –
iii. Exponential Smoothing Method:
The specialty of exponential smoothing method is that the forecasts are modified in the light of observed errors. This method takes into account the decreasing influence of the past time periods as we move further into the past data.
The forecasts for the next time period is calculated by using the following formula:
![]()
Where F (t+1) = forecast for the time period (t+1).
X = smoothing factor which lies between 0 to 1.
At = Actual value for the time period ‘t’,
Ft = For cast for the time period ‘t’
The value of smoothing factor ‘x’ is determined with the help of the observations made during warm up period. The value of x that shows the minimum mean squared error (MSE) is given by the following relationship –
![]()
Where MSE = Mean Squared error.
At = Actual value for the period i.
Fi – Forecasted value for the period i
For Example – The actual demand for product ‘A’ for the year 2005 is 20500. The value of x is 0.32. The average demand of warming period is 19980. Calculate the forecast for the period 2006 and 2007 if the actual demand for period 2006 is 20200.
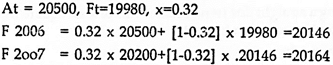
The actual and forecast demand for the period of last year is required for the calculation of forecast of next year (Table-1).
The value of x = 0.32
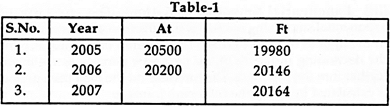
For the calculation of forecast of year 2008 the actual demand for the year 2007 is necessary.
iv. Curve Fitting or Least Square Method:
This method is considered to be the best method for calculating trend values. The trend line which is obtained by this method is called Tine of best fit’. This line can be straight or parabolic curve. If y = a+bx is the relation for the best fitting line, the value of a and b can be determined (Fig.-1).
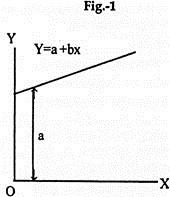
For fitting a straight line trend on the basis of least square method the following equation is used
y = a + bx
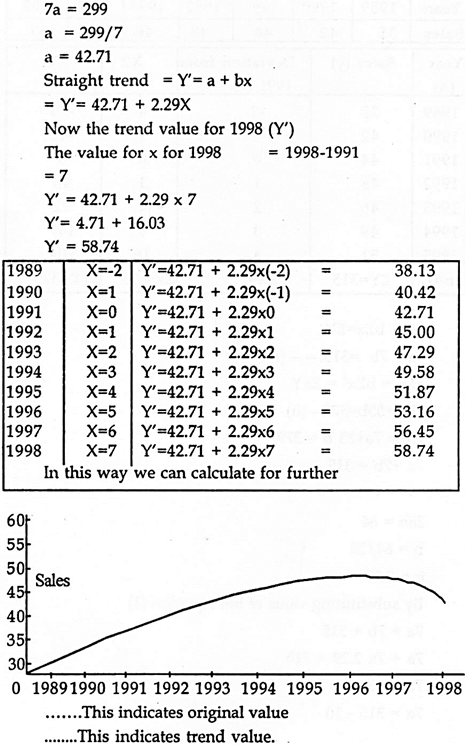
Where, y = Long term trend, a, b =constant values, x=independent variable a represents the value of y variable when x = 0, and b represents the slope of the line or amount of change in y which is associated with the change of one unit in x variable. For example, fit a straight line trend from the following data and find out the trend value and sales for 1998.
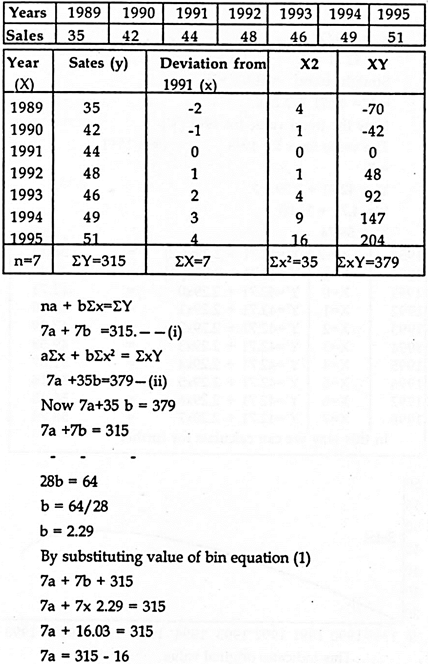
For irregular time period, if the sum of deviation is equal to zero then the value of ‘a’ and ‘b’ can be calculated by direct method, that is –
2. Regression Method:
A regression method is an equation relating dependent variable to many independent variables. For example, anticipate sales (dependent variable) may be expressed as a function of independent variables like disposable income of consumers, price relative to the price of completive products level of advertising etc., and the relationship can be –
Y = a1 + (b1 X1) + (b2 X2) + (b3 X3) + ———— (bn.Xn)
Where Y’ represents sales
a, b1, b2——— bn are constants
X1, X2, X3……… Xn are independent variables which affect the dependent variable Y. If the number of independent variable are more multiple regression analysis can be undertaken with the help of computers.
3. Econometric Method:
It is a mathematical representation of economic relationship derived from economic theory. The primary objective of his method is to forecast the future behaviour of the economic variables incorporated in the model.
Forecasting Techniques – Historical Analogy, Field Survey, Opinion Poll, Business Barometers and a Few Others
There are various techniques (or methods) of forecasting ranging from simple intuitive method to the use of highly complex models. However, no technique can be suggested as universally applicable. In fact, most of the forecasts are made by combining various techniques.
A brief discussion of major forecasting techniques is presented below:
1. Historical Analogy:
Under historical analogy method, forecast in regard to a particular phenomenon is based on some analogous conditions. This method is based on the stages of economic growth as suggested by Rostow. These stages are traditional society, preconditions for take-off, take-off, drive to maturity, and age of high mass consumption. Since this is true for all the economies, the situation of a country can be forecast by making comparison with the advanced countries at a particular stage through which the country is presently passing.
Similarly, it has been observed that if anything is invented in some part of the world, this is adopted in other countries after a gap of certain time. Thus, based on analogy, a general forecast can be made about the nature of events in the economic system of the country.
2. Field Survey:
Field survey is a method of collection of information about an aspect from the people concerned, for example, collection of information about the likely expenditures of consumers on various items. Such information may throw useful light on the attitudes of the consumers in regard to various items of expenditure and consumption. On the basis of such surveys, demand for various products can be projected. Survey method is suitable for forecasting demand both of existing and new products.
3. Opinion Poll:
Opinion poll is conducted to assess the opinion of the knowledgeable persons and experts in the field whose views carry a lot of weight. For example, opinion polls are very popular to predict the outcome of elections in many countries. Similarly, an opinion poll of the sales representatives, wholesalers or marketing experts may be helpful in formulating demand projections or the opinion poll of technical experts may be helpful in estimating the life span of a technology.
4. Business Barometers:
In physical science, a barometer is used to measure the atmospheric pressure. In the same way, business barometers in the form of index numbers are used to measure the state of economy between two or more periods. These index numbers are the device to study the trends, seasonal fluctuations, cyclical movements, and irregular fluctuations.
These index numbers, when used in conjunction with one another or combined with one or more, provide indications about the direction in which the economy is heading. For example, a rise in the rate of investment now may herald an upswing in the economy and may reflect higher employment and income after some time. Higher income leads to higher expenditure, consequently higher product demand.
5. Time Series Analysis:
Time series analysis involves decomposition of historical series into its various components, viz., trends, seasonal variations, cyclical variations, and random variations. Time series analysis uses index numbers but it is different from barometric technique. In barometric technique, the future is predicted from the indicating series which serve as barometers of economic change. In time series analysis, the future is taken as some sort of an extension of the past.
When the various components of a time series are separated, the variation of a particular phenomenon, say price, can be known over the period of time and projection can be made about future. A trend can be known over the period of time which may be true for future also. However, time series analysis should be used as a basis for forecasting when data are available for a long period of time and tendencies disclosed by the trend and seasonal factors are fairly clear and stable.
6. Extrapolation:
Extrapolation is also based on time series because it relies on the behaviours of a series in the past and projects the same trend in future. This method does not isolate the effects of various factors influencing the phenomenon under study but takes into account the totality of their effects and assumes that the effect of these factors is of a constant and stable pattern and would continue as such in future. Since the projection of future is based on past, it is essential that the growth curve of a series is chosen after a very careful study of its past behaviour.
7. Regression Analysis:
Regression analysis is meant to disclose the relative movements of two or more interrelated series. It is used to estimate the changes in one variable as a result of specified changes in other variable or a set of variables. In business, a situation is caused by operation of a number of factors simultaneously.
Regression analysis helps in isolating the effects of such factors to a great extent. For example, if we know that there is a positive relationship between advertising expenditure and volume of sales or between sales and profit, it is possible to have estimate of the sales on the basis of advertising or of profit on the basis of projected sales, provided other things remain the same.
8. Input-Output Analysis:
Under this method, a forecast of output is based on given input if relationship between input and output is known. Similarly, input requirement can be forecast on the basis of final output with a given input-output relationship. It is because of this mechanism that the technique is known as input-output analysis or end-use technique. The very basis of this technique is that the various sectors of economy are interrelated and such interrelationships are well established. Such relationships are known as coefficients in mathematical terms.
For example, coal requirement of the country can be predicted on the basis of its usage rate in various sectors, say industry, transport, household, etc. and on the basis of how the various sectors behave in future. This technique yields sector-wise forecasts and is extensively used in forecasting business events as the data required for its application are easily obtained.
9. Econometric Models:
The word econometric is made up of two words ‘econo’ and ‘metric’ thereby referring to the science of economic measurement. In econometric method, mathematical models are used to express relationship among variables. These models take the form of a set of simultaneous equations.
The constants in these equations are arrived at by a study of time series and since the variables affecting a business phenomenon are many, a large number of equations may have to be formed to arrive at a particular econometric model. These equations are not easy to formulate but the advent of computers has made the formation of these equations relatively easy.
Forecasting Techniques – Time Series Analysis, Regression Analysis, Econometric Models, Extrapolation and etc.
There is nothing new about business forecasting as forecasting is being done by the businessmen for centuries. They have been using their past experience and intuition to predict the future events. Even today this method is still popular in the business world. But in recent years, new techniques of forecasting have come into existence because the old technique is always likely to lead to absurd conclusions.
Attempts are being made to make forecasting as scientific as possible. Each of the techniques has its special use. Care must be taken to select the right technique for every occasion. The choice of a method of forecasting depends on the following factors – (a) the relevance and availability of historical data, (b) the context of the forecast, (c) the desired degree of accuracy, (d) the time period to be covered, (e) the cost benefit of the forecast, and (f) the time available for making the analysis.
Various techniques of forecasting may be classified into two major categories – (i) Quantitative and (ii) Qualitative. Quantitative techniques apply various statistical tools to data for predicting future events. They include Time Series Analysis, Regression Analysis, Econometric Models and Extrapolation.
Qualitative techniques employ mainly human judgement to predict future events such as historical perspective (business barometers), Panel Consensus, Delphi Method, Morphological Research Method and Relevance Tree Method. These methods are used where quantitative data is not readily available. For instance, quantitative methods cannot be used to forecast technological environment.
A brief discussion of various quantitative and qualitative methods of forecasting is given below:
1. Time Series Analysis:
Time series analysis assists to identify and explain:
(i) Any regular or systematic variation in the series of data which is due to some seasons; and
(ii) Cyclical trends that repeat every two or three years or more.
With the help of time series analysis, a trend line can be fitted (by using the method of least squares) which is the best indicator of the trend. Time series analysis provides an initial approximation forecast that takes into account the empirical regularities which may expected to persist. After the seasonal effects have been identified and measured, the original data may be adjusted for these influences, yielding a new historical time series consisting of the trend and seasonally adjusted data.
The new time series may be used in the analysis and interpretation of cyclical and residual influences. This method has certain limitations also. Since the future does not always reflect the past, the time series analysis may give misleading of several years are available.
2. Regression Analysis:
Regression analysis is the means by which we can select from among the many possible relationships between different variables which are relevant to forecasting. If two variables are functionally related, then the knowledge of one will make possible an estimate of the other.
For instance, if it is known that advertising expenditure and sales are correlated, then we can find out the probable increase or decrease in sales with the given increase and decrease in the advertising expenditure. Regression analysis also helps in forecasting where there are one dependent variable and several independent variables. The help of computer programmes may be sought to estimate the regression equations that are very complex and time consuming.
3. Econometric Models:
Econometrics refers to the application of mathematical economic theory and statistical procedures to economic data in order to verify economic theorems and to establish quantitative results. Econometric models take the form of a set of simultaneous equations. The number of equations may be very large in some cases. So, the help of electronic data processing equipment may be sought to solve these equations.
It is also significant to point out that the development of an econometric model requires sufficient data so that the correct relationships can be established. The econometric models reveal in quantitative terms the way in which various aspects of a problem are interrelated. These models are very complex in practice as they combine the knowledge of economics, mathematics and statistics. That is why, they are not popular with the small business houses.
4. Extrapolation:
This technique is used frequently for sales forecasts and other estimates when other forecasting methods may not be justified. It is the simplest method of forecasting. In many forecasting situations, it can be expected more reasonably that the variable will follow its already established path. Extrapolation assumes the relative consistence in pattern of past movements in some time series.
If this assumption is taken, the problem is to determine accurately the appropriate trend curve and the values of its parameters. Numerous trend curves are suitable for business forecasting. They include arithmetic trend, semi-log trend, modified exponential trend, logistic curve, etc. Selection of an appropriate curve depends on empirical and theoretical considerations relevant to the forecasting problem.
5. Historical Perspective (Business Barometers):
Historical perspective technique uses business barometers to make business forecasts. The term ‘barometer’ is used to indicate the economic situations. The assumption behind the use of business barometers, i.e., various indices, is that past patterns tend to repeat themselves in the future and that the future can be predicted with the help of certain happenings of the present.
The various barometers which can be used in forecasting include gross national product, wholesale prices, consumer prices, industrial production, volume of money supply, stock exchange quotations, etc. Some of these index numbers may also be combined into a general index of business activity. The general index refers to general condition of commerce and industry.
However, this composite index may show quite contrary tendencies from those of some of its components. So, proper care must be taken while using the index numbers for business forecasting. If the business barometer being used is reliable, it will reduce the chances of wrong forecasting.
6. Panel Consensus Method:
Under this method, data is presented openly to a group of experts related to a particular problem area is prepared with great care and the experts are brought together to have a face-to-face discussion and arrive at a consensus forecast. Such a forecast is expected to prove better as compared to a forecast made by one expert. Several can determine a better forecast than one working alone.
7. Delphi Method:
This method enjoys respectability due to its scientific approach to the problem of forecasting. It is used for a systematic probing of the minds of the people who possess the necessary expertise in the pertinent or related areas. Under this method, a panel of experts related to a particular problem area is prepared.
Instead of bringing these experts together to have face-to-face discussion, they are kept apart and their identity is kept secret from one another. This is done to prevent experts from being influenced by others and to eliminate the possibility of the emergence of a band-wagon mentality.
The opinions of the experts are solicited by eliciting their response to a carefully prepared questionnaire. The answers collected are studied carefully to separate the answers to questions on which a general consensus has emerged. The experts who have differed with majority opinion are fed back the results of the first round of survey and are requested to communicate the reasons for their divergence.
Similarly, in the case of such questions on which wide difference of opinion has surfaced, the same process is employed to narrow down the differences. The process of successive feedbacks and seeking of opinions continues until the experts re-evaluate their estimates and a better convergence of opinion emerges or at least the scatter of opinions gets narrowed. The final results are taken as the forecasts. It should be noted that the Delphi method would not give only one answer in all the cases.
8. Morphological Research Method:
“The morphological research method concerns itself with the development and the practical application of basic methods which will allow us to discover and analyse the structural or morphological interrelations among objects, phenomena and concepts and explore the results gained for the construction of a sound world.” This method is used to find out, at least theoretically, all possible technological alternatives which can derived from the various permutations and combinations of the variables of the parameters relevant to the solution of a problem.
9. Relevance Tree Method:
In its normative application, the purpose of the relevance tree method is to help the businessman in determining objectives and predicting ways to attain them. According to this method, the feasibility of the future objective is judged first of all, and then by working backwards, attempt is made to find the technological innovations needed to achieve the objective. In its exploratory application, the relevance tree method is similar to the decision tree method of decisions making. It is used to develop alternatives and to determine the most describe course of action.