
A ratio is an arithmetical tool that measures the relationship between two figures that are interdependent and interrelated with each other. Ratio is expressed by dividing one figure by another related figure.
Ratio analysis is one of the powerful tools of financial analysis. It indicates a quantitative relationship between the figures and group of figures which are used for evaluation and decision-making.
Ratio analysis is the computation of ratios between two financial values/figures. These figures are extracted from the financial statements i.e. the profit and loss account and the balance sheet which are prepared at the end of an accounting term, normally one year.
In business different analysis is required for judging strengths and weaknesses in different areas with the help of ratios. For this purpose, different financial statements are prepared like Fund Flow Statement, Cash Flow Statement, Balance Sheet, Profit and Loss A/c., etc.
ADVERTISEMENTS:
Ratio analysis is made on the basis of different financial information expressed in financial statements. On the basis of ratio analysis, different valuable decisions are taken by the management.
Contents
- Introduction to Ratio Analysis
- Meaning of Ratio
- Meaning of Accounting Ratio and Ratio Analysis
- Objectives of Ratio Analysis
- Types of Ratios
- Classification of Ratios
- Nature of Ratios
- Points to be Kept in Mind While Using Ratio Analysis
- Significance of Ratio as Tool of Financial Analysis
- Steps Involved in Ratio Analysis
- How to Use the Ratios?
- Current, Fixed and Intangible Assets
- Current and Contingent Liabilities
- Formats of P & L Account and Balance Sheet
- Utility and Users of Financial Ratio Analysis
- Du Pont Control Chart
- Advantages of Ratio Analysis
- Merits of Ratio Analysis
- Limitations of Ratio Analysis
- Disadvantages of Ratio Analysis
- Demerits of Ratio Analysis
Ratio Analysis: Meaning, Formulas, What is Ratio Analysis, Financial Ratio, Objectives, Types, Classification, Nature, Significance, Steps, Advantages, Merits, Limitations, Disadvantages and More…
Ratio Analysis – Introduction
Financial analysis is helpful in measurement of financial condition and financial performance of business undertakings. Ratio analysis is one of the important tools or techniques for financial analysis. Ratio analysis reveals the financial strength of business undertaking to meet its liabilities. The composition of capital structure of business can be revealed by ratio analysis.
A ratio is an arithmetical tool that measures the relationship between two figures that are interdependent and interrelated with each other. Ratio is expressed by dividing one figure by another related figure.
ADVERTISEMENTS:
Ratio analysis is one of the powerful tools of financial analysis. It indicates a quantitative relationship between the figures and group of figures which are used for evaluation and decision-making.
Ratio analysis is the computation of ratios between two financial values/figures. These figures are extracted from the financial statements i.e. the profit and loss account and the balance sheet which are prepared at the end of an accounting term, normally one year.
Ratio Analysis – Meaning of Ratio
Ratio is a simple mathematical expression of the relationship between two related items in quantitative form. It may be a number expressed in terms of another number.
The relationship between two figures may be expressed as-
ADVERTISEMENTS:
(a) quotient or
(b) a rate or
(c) a percentage i.e. say (i) 2:1 or (ii) 2 times or (iii) 200%.
In assessing the financial stability of a firm, a management should, apart from profitability, be interested in relative figures rather than in absolute figures. Infact, an analysis of financial statements ratios is imperative.
ADVERTISEMENTS:
There is a growing body of evidence that ratios can be directly helpful as a basis for making predictions. A ratio is a mathematical relationship between two quantities. It is of major importance for financial analysis. It engages qualitative measurement and precisely how adequate is one key item in relation to another.
To evaluate the financial condition and the purposes of a firm, the financial analyst needs certain yardsticks. Such yardstick frequently used is a ratio or an index relating two pieces of financial data to each other.
Not only are those who manage a company but also its shareholders and creditors interested in knowing about the financial position and the earning capacity of that concern.
There are two main ways to analyses a ratio, namely:
ADVERTISEMENTS:
(i) In a trend analysis, the behaviour of the ratios across the time studied.
(ii) In a comparative analysis, the performance of a firm at a single point of time relative either to other firms in the industry or some other generally accepted industry standard is studied.
Ratio Analysis – Meaning of Accounting Ratio and Ratio Analysis
Accounting Ratio
Accounting ratio is the quantitative and qualitative relationship between any two accounting figures expressed in different ways such as – times, months, days, percentage, proportion, etc.
According to J. Batty, accounting ratio, “is used to describe significant relationships which exist between figures shown on a Balance Sheet, in a Profit and Loss Account, in a Budgetary Control System or in any other part of the accounting organisation”.
Ratio Analysis
ADVERTISEMENTS:
In business different analysis is required for judging strengths and weaknesses in different areas with the help of ratios. For this purpose, different financial statements are prepared like Fund Flow Statement, Cash Flow Statement, Balance Sheet, Profit and Loss A/c., etc.
Ratio analysis is made on the basis of different financial information expressed in financial statements. On the basis of ratio analysis, different valuable decisions are taken by the management.
Top 6 Objectives of Ratio Analysis
The objectives of ratio analysis are stated below:
(a) To examine and measure the actual financial performance of business with the standard financial performance.
ADVERTISEMENTS:
(b) To take precautionary steps in case of poor financial performance of business.
(c) To find out the return on capital employed.
(d) To measure the ratio of equity capital to debt capital of business.
(e) To know the imbalance in equity capital to debt capital of business to protect the shareholders interest.
(f) To see the extent of utilisation of long-term loans.
Ratio Analysis – 4 Main Types of Ratios: Structural, Working Capital, Profitability and Miscellaneous Ratios (With Formulas and Calculations)
Types of Ratios are as follows:
1. Structural Ratios:
ADVERTISEMENTS:
Structural Ratios indicate the relationships amongst the variables that are part of the long-term financial structure.
(i) Debt-Equity Ratio:
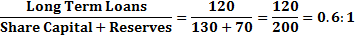
The term ‘Equity’ in the title of this ratio is the sum of the Share Capital and Reserve and Surplus. Thus, the denominator represents the amount due to the shareholders, and is also known as net worth.
The ratio represents the proportion of ‘loan funds’, to ‘own funds’ in the capital structure of the company. This has a bearing on several aspects like the ability to invite and absorb further loans, ability to raise further share capital, control of the operations etc.
As a thumb-rule, Debt-Equity Ratio of less than 1.00 is taken as “acceptable” but this is not based on any scientific analysis. In fact, the acceptable level of ratio will vary from one industry to another.
(ii) Capital Gearing:
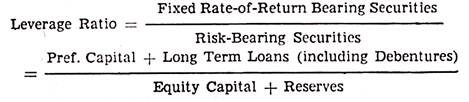
This ratio differs slightly from the Debt-Equity Ratio. It throws further light on the risk factor in financing when earnings are expected to fluctuate. The numerator denotes the cost of capital which is of a ‘fixed’ nature and must be paid’ up irrespective of the quantum of profits.
ADVERTISEMENTS:
(Dividend on Preference Share Capital may not be paid if profits are inadequate, and this is an exception to the ‘fixed’ nature of capital cost. However, if these are Cumulative Preference Shares, the dividend not paid in any year goes on accumulating). The denominator denotes the risk-bearing component of the capital structure.
(iii) Net Worth to Net Fixed Assets:
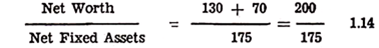
Net Worth is 1.14 times the Net Fixed Assets. This means that a part of the Shareholders’ Funds has gone into the financing of the working capital as well, over and above fully financing the fixed assets (at their book value today). As a thumb- rule, the ratio of more than 1.00 is ‘acceptable’.
This again, is not based on any scientific analysis. The lenders of yesteryears expected that the shareholders had financed the fixed assets fully while the lenders would contribute to the financing only a part of the current assets. This attitude is reflected in the ‘thumb-rule’ figure of 1.00.
2. Working Capital Ratios:
These ratios help ascertain the effectiveness of the working capital management. “To gain an insight, they also use the variables other than those covered by the term ‘working capital’. One measure of liquidity is the current ratio. Another test of liquidity is acid test or quick ratio.
ADVERTISEMENTS:
It helps show the firm’s ability for repaying current liabilities quickly. Liquidity ratios measure the firm’s ability to meet its maturing obligations. Current ratio should be 2:1 and acid test or quick ratio should be 1:1 under normal conditions.
(i) Current Ratio:
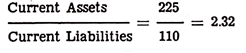
This ratio indicates the solvency of the firm in the short-run. Just as a long-term financing institution uses the Debt-Equity Ratio as a broad guide, the trade creditor would use this ratio to estimate the firm’s ability to repay its credit. The ‘acceptable’ level of this ratio is 2:1.
(ii) Liquid Ratio or Acid Test Ratio Current:
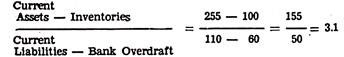
This ratio denotes a very short term liquidity and is therefore called ‘liquid ratio’. It tacitly assumes that inventories may not be realised immediately, and that the bank overdraft may turn sticky. Hence, it excludes these two variables. Some authors do not advocate the exclusion of the bank overdraft. In that case acid test ratio is 1.4:1. The ‘acceptable’ level is 1:1.
(iii) Inventory Turnover Ratio:
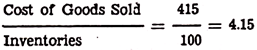
This ratio indicates the number of times the inventories are ‘turned over’ during a year. The higher this ratio, the greater is the efficiency of inventory management. However, in its zeal to show a high ratio, inventories cannot be allowed to drop down below the ‘danger level’ or the sale may be lost.
ADVERTISEMENTS:
This ratio is also expressed in another form:
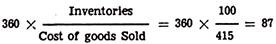
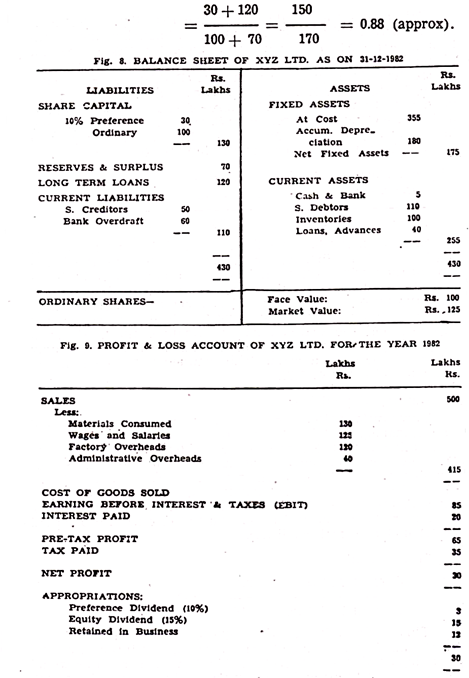
In this form, the resultant figure denotes that on 31-12-1982, the company had inventories worth 87 days’ sales. (This assumes 360 days a year).
(iv) Debtors’ Turnover Ratio:
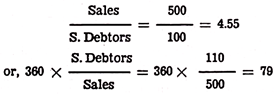
This indicates, like the inventory turnover ratio, that the company has been extending 79 days credit to its customers.
(v) Working Capital Turnover Ratio:
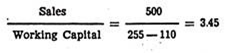
This shows that the entire working capital (current assets minus current liabilities) is turned over 3.45 times in a year.
3. Profitability Ratios:
ADVERTISEMENTS:
(i) Profit to Sales:
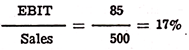
This denotes the percentage of profit earned on every rupee of sale. The reason for taking EBIT (Earning Before Interest and Taxes) is to eliminate the impact of capital structure on profits. If there is a high proportion of debt, interest charges would be higher and vice versa. Hence, we take EBIT which denotes the operating results.
(ii) Return on Investment (R.O.I.):
It is the widely used control device measuring the financial success of a firm. It is described below separately.
4. Miscellaneous Ratios:
(i) Fixed Assets Turnover Ratio:
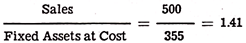
A high ratio indicates that the company has been able to make good use of its fixed assets. Fixed Assets are generally taken at cost since the net value depends on the depreciation policies of the management.
(ii) Earning per Share:
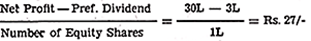
This ratio compares the profit that is due to the Equity Shareholders, or to the Equity Share Capital, worked out on per share basis. Earning per share is compared with the dividend per share (15 per cent in this case). If earning is sufficiently higher than the dividend, it shows a healthy financial position.
Earning-Price Ratio:
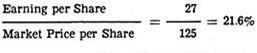
This ratio is used by prospective investors in making their investment decisions. This can be calculated only for those shares that are listed on the stock exchanges, and for which an official quotation is available.
Ratio Analysis – Classification of Ratios: Liquidity, Leverage, Activity, Coverage, Profitability and Investability Ratios (With Formulas)
Ratios as tools of measuring liquidity, profitability, efficiency and financial position of a company can be classified into five basic categories:
1. Liquidity,
2. Leverage,
3. Activity,
4. Coverage,
5. Profitability and
6. Investability.
1. Liquidity Ratios:
Liquidity ratios provide tests to measure the ability of the firm to cover its short-term obligations out of its short-term resources. Interpretation of liquidity ratios provides considerable insight into the present cash solvency of the firm and its ability to remain solvent in times of adversities.
Two commonly used liquidity ratios are:
a. Current Ratio, and
b. Quick or Acid Test Ratio.
a. Current Ratio:
Current ratio expresses relationship between current assets (cash, marketable securities, accounts receivables and inventory) and current liabilities, (accounts payable, short-term notes payable, current maturities of long-term debt, accrued income taxes and other accrued expenses especially wages).
It is computed by dividing current assets by current liabilities. A higher current ratio explains that the company will be able to pay its debts maturing within a year.
On the other hand, a low current ratio points to the possibility that the company may not be able to pay its short-term debts.
However, from the management point of view higher current ratio is indicative of poor planning since an excessive amount of funds lie idle. On the contrary, a low ratio would mean inadequacy of working capital which may deter smooth functioning of the enterprise.
A current ratio of 2:1 was long considered as minimum in a sound business. This rule of thumb has, however, succumbed to the rule of reason. An excess of current assets over current liabilities does not necessarily mean that debts can be paid promptly.
If current assets contain a high proportion of uncollectible accounts receivable or unsaleable inventories, there will be a slowdown in the inflows of cash.
Therefore, it would be pertinent to take note of, while computing the current ratio, the nature and proportion of various types of current assets, the nature of current liabilities, the nature of cash flows and the future expectations.
b. Acid Test Ratio or Quick Ratio:
It is a measure of judging the immediate ability of a company to pay off its current obligations. It is obtained by dividing quick current assets by current liabilities. Quick current assets would comprise those assets which can be liquidated immediately and at minimum loss in order to meet pressing financial obligations.
Thus, quick current assets consist of cash, marketable securities and accounts receivable. Inventories are excluded from quick assets because they are slower to convert into cash and generally exhibit more uncertainty as to the conversion price.
A quick ratio of 1:1 is usually considered adequate. But again while using this ratio as a measure of immediate ability to pay off its short-term obligations liquidity of receivable must be kept in mind, for receivables, which are not collectible, are not adequate to support the liquidity of the concern. Therefore, factors such as the size, age and location of the accounts receivable must be analysed before reaching any final decision.
2. Leverage Ratios:
Leverage ratios are generally designed to measure the contribution of the company’s owners vis-a-vis the funds provided by its creditors.
These ratios are computed to solicit information along the following lines –
(i) The company’s ability to weather times of stress and to cover all its obligations including short-term and long-term obligations,
(ii) The margin of safety afforded to the creditors,
(iii) The extent of control of the stockholders over the enterprise, and
(iv) The potential earnings from the use of loan funds.
In line with the above, we shall examine the following leverage ratios:
a. Debt to total assets or debt ratio,
b. Debt-equity ratio,
c. Long-term Debt to Total capitalisation.
a. Debt to Total Assets Ratio:
This ratio exhibits the proportion of total assets created through debt including short-term and long-term liabilities. This ratio is computed by dividing total assets into total debt. This ratio is of considerable significance to the creditors inasmuch as it highlights the long-run solvency of the company.
The lower the ratio, the greater is the cushion against creditors’ losses in the event of liquidation. Creditors prefer the moderate ratio. However, owners would always like to have high leverage because in that they obtain the benefit of higher leverage earnings and maintain their control.
b. Debt-Equity Ratio:
This ratio relates all the creditors’ claims on assets to the owner’s claims. It is computed by dividing the total debt both current and long-term of the business by its tangible net worth consisting of common stock and reserves and surplus.
If the ratio is greater it would mean creditors have more invested in the business than the owners. This means creditors would suffer more in times of distress than the owners. This is why creditors prefer a low debt-equity ratio.
c. Long-Term Debt to Total Capitalisation:
This ratio reflects the relationship between long-term borrowed capital and owners’ capital contribution. This ratio is found by dividing long-term debt into total capitalisation (all long-term debt + net worth).
One rough rule of thumb is that the maximum percentage of long-term debt should not exceed 33½ per cent of capitalisation in manufacturing concerns and 50 per cent for rail-roads and public utilities.
3. Activity Ratios:
Activity ratios reflect how efficiently the company is managing its resources. These ratios express the relationship between the level of sales and the investment in various assets, viz., inventories, receivables, fixed assets, etc.
The important activity ratios are:
a. Inventory turnover,
b. Average collection period,
c. Fixed assets turnover, and
d. Total assets turnover.
a. Inventory Turnover:
Inventory turnover is computed by dividing the cost of goods sold by the average inventory for the period. This ratio gives the number of times the inventory is replaced during a given period, usually a year.
Presumably higher the turnover better is the performance of the company, for it has managed to operate with a relatively small average locking up of funds. A low sales to inventory ratio may indicate a slow-moving inventory, suffering possibly from obsolescence of a none-too-aggressive sales force.
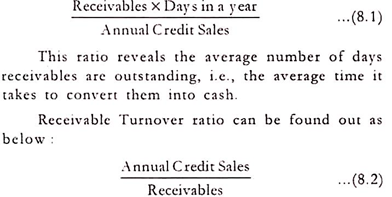
b. Average Collection Period and Receivable Turnover:
So as to determine liquidity of receivables two basic ratios are computed, average collection period and receivable turnover.
Average Collection Period can be calculated as –
Another method that can be employed to measure liquidity of receivables is ‘Aging of Accounts’. According to this method, receivables are categorized at a point of time in terms of the proportions billed in previous months.
The following example will explain this method:
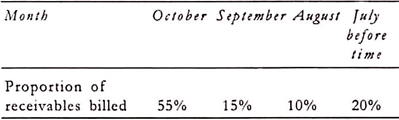
If the credit terms are 3/10, net 30, the above aging schedule tells us that 55% of the receivables at October 31, are current, 15 percent are upto one month past due, 10% are 1 to 2 months past due and so on.
On the basis of these ratios, effectiveness of credit and collection policies of the company and that of collection machinery can be assessed. A longer period of collection indicates the leniency of credit policy and/or the slackness of the collection machinery. In a shorter collection period unduly restrictive credit policy and/or aggressive collection efforts is reflected.
This ratio must be compared with the selling terms of the business enterprise. If the selling terms of the company were 2/10 net 30, collection period of 30 days would appear to be acceptable. If, however, the period were 90 days, it would indicate that there were three months’ receivable on hand.
c. Total Assets Turnover:
This ratio expresses the relationship between the amount invested in the assets and the results accruing in terms of sales. This is calculated by dividing the net sales by total assets.
Total assets turnover indicates the efficiency with which assets of the company have been utilised. A higher ratio would mean better utilisation and vice versa. However, care should be exercised in drawing conclusions.
Sometimes the purchase of assets may not result in higher sales but may, however, cause reduction in cost and thereby result in an increase in profits. In such cases, even if the ratio declines, the situation is considered favourable.
d. Fixed Asset Turnover:
This ratio is calculated by dividing sales into fixed assets. It is used to highlight the extent or utilisation of the company’s plant and equipment. A low ratio is indicative of the poor utilisation of the existing plant capacity. This factor should be kept in mind while the production department requests for funds for new capital investments.
4. Coverage Ratios:
Coverage ratios provide insight into a firm’s ability to service its financial charges. Two types of coverage ratios which are extensively employed by bond rating services such as Moody’s Investors Services and Standard and Poor’s are interest coverage ratio and cash flow coverage ratio.
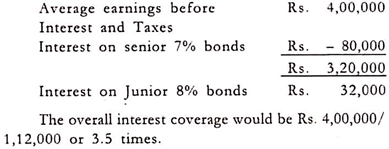
a. Interest Coverage Ratio:
This ratio is employed to indicate times interest case has been earned and how much safety margin is available to the shareholders. It is computed by dividing profits before interest and taxes (PBIT) by interest cost. A high ratio is a sign of low burden of borrowings of the business and lower utilisation of borrowing capacity.
Let us explain this ratio with the help of following financial data of a firm:
b. Cash Flow Coverage Ratio
This ratio is calculated by relating earnings before interest, taxes, depreciation and amortization (EBITDA) to interest and for interest plus principal payments.
It may algebraically be expressed as –
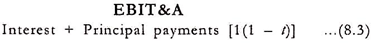
where the income tax rate and principal payments are annual. Since principal payments are made after taxes as it is logical to gross them up so that they correspond to interest payments, which are made before taxes.
While evaluating the financial risk of a firm, debt ratios may not always provide the correct picture about the ability of the firm. As such, it is pertinent to analyse additionally the cash flow ability of the firm to service debt.
5. Profitability Ratios:
Profitability ratios are, as matter of fact, best indicators of overall efficiency of the business concern because they compare return of value over and above the values put into a business with sale or service carried on by the enterprise with the help of assets employed.
Thus, profitability ratios are of two type’s viz.:
a. Profitability as related to sales and
b. Profitability as related to investments.
a. Profitability as Related to Sales:
Under this group of profitability ratios are included:
(i) Gross profit to sales,
(ii) Operating profit to sales and
(iii) Net profit to sales.
(i) Gross Profit to Sales
This ratio establishes a relationship between gross profit and sales to measure the relative operating efficiency of the corporation and to reflect its pricing policies. It is computed by dividing sales into sales minus the cost of goods sold.
Sometimes it is calculated by taking the cost of goods sold instead of sales. It indicates the position of trading results.
(ii) Operating Profit to Sales
This ratio expresses the relationship between operating profit and sales. It is worked out by dividing operating profit by net sales. With the help of this ratio one can judge the managerial efficiency which may not be reflected in net profit ratio.
For example, a corporation may have a large amount of non-operating income in the form of dividend and interest which represents a major proportion of the company’s net profit.
The net profit ratio may, in such cases, show high efficiency even though the efficiency is extremely low as non-operating income has no relation with the operating efficiency of the management.
(iii) Net Profit to Sales
Net profit to sales, also called net profit margin, is calculated by dividing net incomes (after tax) by net sales. This ratio provides considerable insight into the overall efficiency of the business. A higher ratio is an indication of the higher overall efficiency of the business, and better utilisation of total resources.
A low ratio on the contrary would mean poor financial planning and low efficiency. The difference between operating profit ratio and net profit ratio exhibits the significance of secondary operations in the business.
b. Profitability as Related to Investment:
This category of profitability ratio includes:
(i) Return on total capital employed and
(ii) Return on net worth.
(i) Return on Capital Employed
This ratio is computed by dividing net profit figure by total capital employed in the business. Net profit in this case means net profit before taxes but less interest on short-term borrowing.
Capital employed figure is found out by subtracting current liabilities from total investments. This ratio is the only dependable measure of overall performance of a firm. A higher ratio is an index of better utilisation of funds.
(ii) Return on Net Worth
This ratio is obtained by dividing profits before tax by net worth. This measures the productivity of shareholders’ funds. A higher ratio indicates the better utilisation of owners’ funds and higher productivity.
6. Investability Ratios:
Investors contemplating investing in shares of a company would be keen to know the investment potentiality of the company before taking a final decision. Analysis of investability ratios helps the investors to know the investability of the company.
They include ratios like:
a. Earnings per Share (EPS),
b. Price-Earnings Ratio (P/E),
c. Payout Ratio,
d. Dividend Yield and
e. DuPont Return on Investment.
a. Earnings per Share (EPS):
This ratio is computed by dividing earnings available to the common stockholders by the total number of common shares outstanding.
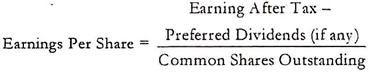
The figure reveals the amount of the period’s earnings after taxes which accrues to each share of common stock. This ratio is an important index because it indicates whether the wealth of each shareholder on a per share basis has changed over the period. A year-to-year comparison of earnings per share can be very informative to investors.
Suppose an investor is considering the purchase of stock of either company A or B. Each stock is being sold at Rs.50 per share.
The earnings trend for the two companies is given as below:
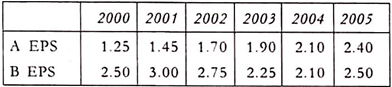
Both the companies had same earnings per share in the last year. But earnings trend differed widely. While company A had initially low earnings per share but steadily progressed and had doubled EPS during five years.
As against this, EPS in the case of company B remained, by and large, the same and recorded a wide amplitude of fluctuations over the five-year period. An analysis of the earnings trend shows a brighter future for company A than company B.
Thus, EPS provides an insight into the investment potentiality of an organisation. However, care must be exercised while using this ratio. If a company makes extraordinary gains or losses appearing as part of net income, earnings per share so computed will fail to portray the correct picture about the profitability and managerial efficiency of the organisation.
It would, therefore, be meaningful to compute two EPS — one showing the earnings per share resulting from normal operations and the other the earnings per share impact of extraordinary events.
This will help the analyst to eliminate the distorting influence of the abnormal events from the basic earnings per share figure and assess the trend of normal earnings per share over a period of time.
b. Price Earnings Ratio (P/E):
This ratio expresses the relationship between the market price of a share of stock and the stock’s current earnings per share. This ratio is calculated by dividing the market price of the stock by earnings per share.
Symbolically
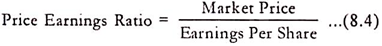
The price earnings ratio is always greater than zero and hence is sometimes called the price earnings multiple.
This ratio can be used to measure capitalisation rate. The reciprocal of P/E ratio is EPS/MP and gives capitalisation rate. If, for example, the stock has EPS of Rs.5 and sells for Rs.50 the capitalisation rate would be 10 per cent. A 10 per cent capitalisation rate means the company earns 10 per cent on the value of the common stock.
Present as well as prospective investors can determine future market value of stock of the company with the help of EPS. If the stock is sold today for Rs.50 a share with Rs.5 EPS what will it be worth in 5 years when EPS is Rs.10? If the price earnings ratio stays approximately at 10 per cent, the stock will be worth (10/1) (Rs.10) or Rs.100. If EPS only goes to Rs.4, it will be worth (10/1) (Rs.4) = Rs.40.
The P/E ratio is used as a going concern method of valuing stock. As long as the company is a viable business entity, its real value is reflected in its profits. A low P/E multiple of a stock is indicative of undervaluation of the stock and vice-versa.
c. Payout Ratio:
This ratio gauges the portion of current earnings being paid out in dividends. Investors desirous of capital gains would like this ratio to be small while those who seek dividends prefer it to be large. The payout ratio is calculated by relating dividend per share to earnings per share for common stock –
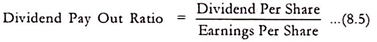
It is generally observed that new and growing companies have low payout ratio because the bulk of their earnings is ploughed back into the business. In contrast, mature and stable concerns tend to have relatively high payout ratio.
d. Dividend Yield:
This is the ratio of dividends per share to the market price per share. This is expressed as –
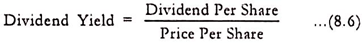
This ratio gives the current return to the investor as a percentage of his investment. The dividend yield serves as useful guideline to potential investors who are keen to buy the company’s stock and who desire to receive regular dividend as a source of income. Dividend yield of a company varies depending upon its profitability, dividend policy and need for funds to support the operations.
e. Return on Investment (DuPont Approach):
Return on investment is one of the most successful yet simple techniques ever conceived to aid both decision making and performance evaluation.
This technique was first developed by Du Pont Company for analysing and controlling financial performance. It brings together the activity ratios and profit margin as sales and shows how these ratios interact to determine profitability of assets.
Return on investment can be computed with the help of the following formula –
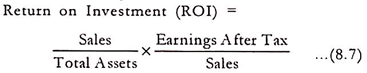
The first term of the equation expresses the total asset turnover. This measures efficiency of asset management. Other things being equal, the greater the index, the more efficiently assets are being managed.
The second term of the Du Pont analysis exhibits the return on sales ratio. It measures efficiency of expense control since the difference between sales and earnings after tax represents the expenses and taxes of the company, the smaller these expenses, the higher will be the ratio of earnings after taxes to sales. In other words, larger return on sales would mean the management success in controlling expenses.
Thus, the second term of the Du Pont analysis is an index of expense control. If the index of asset management efficiency is multiplied by the index of expense control, the result is a magnified index of the company’s financial well-being.
In order to make the analysis more meaningful the ROI of the company must be compared with industry averages and with the company’s own ROI of the past years.
Where the company’s ROI is below the industry average, the Du Pont analysis provides sufficient clues to deficiency in asset management or absence of effective expense control or both.
Further, if a comparative study of the company’s ROI of the past few years reveals a declining tendency, it focuses attention on the management efficiency of the company. This calls for prompt corrective action before the situation goes out of control.
Despite the basic simplicity of the return on investment concept, difficulties do arise in respect of its computation and use. The first such difficulty arises in respect of selection and valuation of the assets comprising the investment base. In calculating the ROI, the Du Pont uses the gross value of plant, tools, equipment and working capital and no deduction is made for depreciation.
A second mechanical problem involved in computation of ROI concerns the changing value of money. Thus, the sales today are usually inflated in rupee value when contrasted with investments in the plant and equipment of yesteryears.
This results in increasing return year by year without changes in operating efficiency presenting a distorted picture about the profitability of the organisation.
Another problem in the use of the ROI as a device of management control is the proper allocation of plant and working capital to some responsible level of management and coupled with delegation of responsibility of collection of costs and revenues to them. In the absence of such delegation, the management cannot be held responsible for accomplishing the targeted level of ROI.
The top management should bear in mind these difficulties while using the ROI concept for executive control.
Ratio Analysis – Nature of Ratios
Ratios are among the best known and most widely used tools of financial analysis. Ratio is defined formally as “the indicated quotient of two mathematical expressions.”
An operational definition of a financial ratio is the relationship between two financial values. The word relationship implies that a financial ratio is the result of comparing mathematically two values.
A company’s total asset turnover is calculated by dividing the company’s total asset value into its sales figure. This ratio is the quantified relationship between sales and total assets. The resulting figure is also an index because it tells us how many times the value of total assets was incorporated into the firm’s products.
It is worthwhile to mention that the ratio must express a relationship that has significance. Thus, there is a clear-cut direct and understandable relationship between the sales price of an item on the one hand and its cost on the other.
Consequently, the ratio of cost of goods sold to sales is a significant one. In a sharper contrast to this, there is no understandable relationship between freight costs incurred and the marketable securities held by an enterprise and hence a ratio of one to the other has no significance.
When the relationship between two figures of the Balance Sheet is established, the ratio thus calculated is called “Balance Sheet Ratio.” The ratio of current assets to current liabilities is an example of balance sheet ratio.
If relationship between the figures of profit and loss account is established, the result so found is regarded as “Income Statement Ratio.” When the relationship of figures in the profit and loss account and the balance sheet is established, e.g., the ratio of net profit to capital employed, the ratio is known as “Inter Statement Ratio.”
Ratio may be expressed in either of the three forms – (1) as a pure ratio, e.g., 2:1, (2) as a rate, e.g., inventory turnover so many times a year, (3) as a percentage, e.g., return on shareholders’ equity being 10 per cent.
Ratio Analysis – Top 4 Points to be Kept in Mind While Using Ratio Analysis
Some points to be kept in mind while using ratios analysis are:
i. Over dependence on a single ratio is not desirable as far as conclusive interpretation of the performance of a company is concerned;
ii. Effect of seasonality needs to be segregated while making comparisons. Further, ratios to be compared should relate to the same time period for all companies;
iii. To get the true financial analysis, ratios should be computed based on audited accounts data; and
iv. The definition used for arriving at the value of variables in the ratio should be identical in all respects for all the companies being compared. The implication of inflating on the business performance as also on the computed ratios should be duly taken care of while interpreting the ratios.
Ratio Analysis – Significance of Ratio as Tool of Financial Analysis
An absolute figure does not convey anything unless it is related with the other relevant figure. Magnitude of current liabilities of a company does not tell anything about the solvency position of the company.
It is only when it is related with current assets figures of the same company an idea about the solvency position of the company can be had. Ratios make a humble attempt in this direction.
Ratios are significant both in vertical and horizontal analysis. In vertical analysis, ratios help the analyst to form a judgement whether performance of the firm at a point of time is good, questionable or poor.
Likewise, use of ratios in horizontal analysis indicates whether the financial condition of the firm over a period of time is improving or deteriorating and whether cost, profitability or efficiency is showing an upward or downward trend.
Financial ratios become meaningful to judge financial condition and profitability performance of a firm only when there is comparison. In fact, analysis of ratio involves two types of comparison. First, a comparison of present ratio with the past and expected future ratios for the same firm.
When financial ratios for several preceding years are computed, the analyst can determine the composition of change and determine whether there has been an improvement or deterioration in the financial position of the firm over the period of time.
The second method of comparison involves comparing the ratios of the company with those of similar types of company or with industry averages at the same point of time. Such a comparison would provide considerable insight into the relative financial condition and performance of the company.
4 Main Steps Involved in Ratio Analysis
Depending upon the objective of the analysis, the following steps may be followed:
(i) Selection of relevant data from the financial statements.
(ii) Calculation of appropriate ratios based on the data selected for the purpose.
(iii) Comparison of ratios so calculated with those of the same firm in the past or with the ratios of some other firms in the same industry (i.e., inter-firm comparison).
(iv) Interpretation of ratios.
Ratio Analysis – How to Use the Ratios?
Various ratios which can be calculated by using the financial data, available through the books of accounts of a company. Each ratio shows a different aspect of the financial health of a company.
In most of the cases, there is nothing like a normal or an ideal ratio. What is normal or ideal for an industry may not be so for another industry or another company because their circumstances may widely differ.
Similarly, there are many pros and cons of changing ratios. For example, an increase in the debt/equity ratio, increases the returns to the shareholders but it may, at the same time, increase the solvency risk to them.
Similarly, high current ratio is an indicator of good liquidity condition but it at the same time results in increased carrying cost of current assets and thus may adversely affect profits.
In this situation, the situation arises as to what is the benchmark or the standard, against which the ratios are to be compared?
There are two norms or benchmarks against which a given ratio can be compared:
(i) Industry Norm, and
(ii) Changes over a period of time.
(i) The most common way is to compare the given ratio with the industry norm. Each industry has its own peculiarity, its own operating cycle, inventory requirement, sales pattern, credit period etc.
Hence, there is no point in comparing the ratios of one company with the ratios of another company of an entirely different industry. A plastic manufacturer’s ratios cannot be compared with a steel manufacturer. Hence, we compare the ratios of a company with the financial ratios of another company of the same industry and in the same circumstances.
We can then find out whether the specific company is doing better or worse than its peers. For example, if a company is not doing well as compared to others in the same industry, we can calculate different ratios to find where the problem lies.
Whether it is in inventory management or receivables management or anything else. In this way, correct diagnosis can be made, which will lead to right corrective action. In this way, ratio analysis identifies the scope of improvement in specific areas of operation of a company.
(ii) The second way of using the ratio analysis is to measure its performance over a period of time. The company may use several ratios of the past years and compare them with the present, to see that in which area of its operation it has improved and where it has not been able to bring about an improvement. This helps us draw a road-map for corrective action.
Thus, we find that the ratio analysis is a powerful diagnostic tool to analyse the financial health of an organisation and to pin-point the area of concern and the areas of success. This scientific approach definitely leads to better results in the financial management of an organisation.
Ratio Analysis – Current, Fixed and Intangible Assets
Current Assets:
Items classed at current assets shall be generally realizable within one year. However, generally recognised trade practices may be followed with respect to items such as instalment receivables or inventories long in process, provided an appropriate explanation of the circumstances is made, and if practicable, an estimate is given of the amount not realizable within one year.
Current assets include such items as cash, Bank, marketable securities, notes and accounts receivable from trade customers, inventories (i.e. stock), such accounts and notes receivable from director, officers, parents, and subsidiaries companies as fall due within one year as well as prepaid expenses.
Fixed Assets:
They are physical items that can be seen and touched and are also often called tangible assets. They represent future services to be used over a prolonged span of time. In general, their measure of usefulness as the time of acquisition is cost less cash discounts.
Only is the difficulty to choose a pattern of depreciation that is, the allocation of the original cost to the particular periods of products that benefit from the utilization of the assets. Depreciation is a process of allocation of the original cost of acquisition. The depreciation allocation to each year may be made on the basis of time or service.
The estimate of useful life, which is an important factor in determining the yearly allocation of depreciation, is influenced by estimates of physical wear and tear, technological change, and economic obsolescence.
Intangible Assets:
They are a fuzzy class of long lived assets that are not physical in nature. Examples are goodwill, patents, trademarks, and copyrights. Goodwill is defined as the excess of the cost of an acquired company over the sum of the market value of its identifiable net assets. Identifiable intangibles assets like patents may be acquired singly but goodwill cannot.
These assets are first capitalized as assets and then written off over their useful lives, which, because of obsolescence, are often much shorter than their legal lives. The periodic write off, called amortization, is similar to depreciation of plants and machines.
Ratio Analysis – Current and Contingent Liabilities
Current Liabilities:
Items due and payable within one year shall in general be classified as current liabilities. However, generally recognised trade practices may be followed with respect to the exclusion of items such as customers, deposits and deferred income, provided an appropriate explanation of the circumstances is made.
In other words, current liabilities are those that fall due within the coming year or within the normal operating cycle not longer than a year.
Contingent Liabilities:
Disclosure of contingent liabilities is essential in determining the prospective financial condition and current position of a company. Discovery of such items not disclosed is quite difficult.
Where such amounts are substantial, failure to give due consideration to them in any credit or investment analysis may well result in a distorted picture.
Ratio Analysis – Formats of P & L Account and Balance Sheet: Traditional Format and Modern Format or the Vertical Form (With Characteristics)
The P & L A/C and Balance Sheet are primarily prepared in two formats:
1. Traditional format or T-format
2. Modern Format Traditional Format.
1. Traditional Format:
It is the format which has traditionally evolved in the development of accounting concepts and practices. Almost all accounting textbooks follow this format.
It has the following characteristics:
(i) It has two sides – Debit and credit like an account. It is, sometimes, shown in two parts called the ‘Trading Account’ and the ‘P & L Account’. The balance sheet also has two sides called Liabilities and Assets. In case of a balance sheet, the liabilities are shown on left- hand side and assets on right-hand side.
(ii) The debit entries of the nominal accounts from the trial balance, which represent total expenditure on a particular head are written on the left hand side like, expenditure on materials, wages, power, transport, rent, interest etc. and the total of this shows the aggregate of expenditure in a given accounting period.
The credit entries of the nominal accounts from the trial balance representing revenues or total incomes on different heads, like sales, interest, dividend, rent etc. are entered on the credit side of this account.
The aggregate of this shows the aggregate revenue of the company. If aggregate revenue exceeds the aggregate expenditure, the balancing figure is written on the debit side as a net profit.
If aggregate expenditure exceeds the aggregate revenue, the balancing figure is written on the credit (right-hand) side. In this way, the totals of the two sides become equal and the account is closed. The balancing figure of either the profit or loss is then transferred to the balance sheet.
(iii) Sometimes a sub-account of the profit and loss a/c is made, called the profit and loss appropriation account on the bottom of the trading and profit & loss account and the balance of net profit is transferred to it. There we show the distribution of this profit and then the final balance is transferred to the balance sheet.
(iv) The balance sheet also has two sides – the left hand side is known as the liabilities side and the right hand side is known as the assets side. All credit entries of the trial balance, pertaining to the personal accounts are transferred to the liabilities side and all debit entries pertaining to the real and personal accounts are transferred to the assets side of the balance sheet.
(v) The entries in the balance sheet are traditionally made in order of liquidity. The most liquid item is at the top and the most illiquid at the bottom. On the liabilities side, we have first the current liabilities, bills payable, provisions followed by term loans, debentures/bonds and finally the capital account at the bottom.
On the assets side, cash in hand, cash at bank are at the top, followed by current assets like bills receivable, inventories and then investments and finally fixed assets like vehicles, machinery, land and building etc. at the bottom.
2. Modern Format or the Vertical Form:
The modern format of profit and loss account and the balance sheet is somewhat different. It is, often, called as the ‘statement form’ of p & l a/ c and the balance sheet, because it is presented as a statement and not as an account.
It is also called as the ‘vertical form’ of the p & l account and balance sheet as against the traditional format which is called as the ‘horizontal form’ of the p & l account and the balance sheet.
It has the following characteristics:
(i) The profit and loss account is often called the ‘income statement’ or ‘profit statement’.
(ii) At the top, we write the gross revenue or the income of the company, normally divided into sales and other revenue. Below this come all the expenses like the raw material, wages, other expenses, like indirect taxes, rent, depreciation etc.
The aggregate of these expenses is subtracted from the aggregate of the income to give us the operating profit or the profit before interest and taxes. From this PBIT we deduct the interest to arrive at the profit before taxes.
After deducting the direct taxes we get the profit after tax for the company. After this, the appropriation of profit after taxes is also given. The final balance, after the appropriation, is then transferred to the balance sheet.
The advantage of this format is that several measures of profit like profit before depreciation, profit before interest and taxes, profit before taxes and profit after taxes can be shown most conveniently for easy understanding of the laymen who are not well versed in accounts.
(iii) For every figure in the income statement, a corresponding figure for the previous year is also shown alongside, for the purpose of comparison of the company’s operations with its working for the previous year. There is another column along with the amounts called the ‘Note No.’ The notes given after the Profit and Loss Statement give details of each item given in the main balance sheet.
(iv) In the balance sheet, we first show the liabilities and below this is shown the assets side separately. Obviously, the totals of the liabilities side and the assets side are equal.
(v) It is more fashionable, these days, to call the liabilities as the ‘sources of funds’ and the assets side as the ‘application of funds’. In other words, the balance sheet shows, from where the money has been received and where it has been put into.
(vi) For every figure in the balance sheet, a corresponding figure for the previous year is given alongside for comparison purposes. There is also a column of ‘Note No.’ in the profit and loss account and the balance sheet. The notes given after the Balance Sheet give details of each item.
(vii)The items on the liabilities side are shown in order of illiquidity; i.e., the most illiquid item is at the top and the most liquid is at the bottom.
(viii) On the liabilities side i.esources of funds, there used to be two broadheads – shareholders’ funds or owners’ funds and the borrowed funds or the loan funds. On the assets side or the application of funds, there are normally three heads – fixed assets like land and buildings, plant and machinery, fixtures, furniture and vehicles etc.
These values are shown after depreciation. Then we have all long term investments like shares, bonds, debentures, fixed deposits etc. Finally we have net current assets, which are shown as the gross current assets less current liabilities. Other items on the liabilities side are shown as per requirements.
(ix) It is important that the aggregate of the balance sheet in the traditional format and the modern format will be the same except the current liabilities. In the traditional format, it is shown as an independent item on the liabilities side, while in the modern format, it is shown on the assets side as a deduction from the current assets.
(x) Recently, the format of Profit and Loss Account and the Balance Sheet has changed in the Schedule VI to the Companies Act 1956. (In the Companies Act 2013 this has been shown as Schedule III). With effect from the financial year 2011-12 the P & L A/C and the B/ S have to be drawn in this new format. This has been done in conformity with the decision to adopt the International Financial Reporting Standards (IFRS) which have to come into effect from April 2014.
Ratio Analysis – Utility and Users of Financial Ratio Analysis
Ratio analysis is used by different persons for different purposes. A banker who is considering extending a loan to an organization will generally be interested in the liquidity and leverage ratios. The banker is interested in the firm’s ability to cover its current liabilities and to service existing as well as future debt.
A potential equity investor would be more interested in the profitability ratio, along with a measure of the degree of financial leverage in the firm. For internal control purposes, the firm would be interested in examining one or more ratios from each category to get a balanced perspective of its performance over a recent operating period.
If the analysis of a company shows any weak areas, instead of computing only a few ratios (such as one from each category), it would be wise to do a much more extensive ratio analysis. This could pinpoint exactly the areas of weakness in the firm.
In utilizing ratio analysis to measure a firm’s relative performance over time, we must be aware that there are characteristics of a particular management or firm which can cause substantial differences in ratio results within an industry.
Management’s perceptions of the business environment will at times override a decision to utilize industry norms as a level of performance toward which the firm should strive. Management’s perceptions are colored by the level of risk it is willing to accept.
One area where a firm’s ratios can deviate from the industry norms because of its management characteristics is its debt capacity. If, for example, the industry’s debt to total asset ratio is 40 percent and the firm’s ratio is 25 percent, it may be suggested that the firm should increase its amount of debt.
However, the firm’s management may be adverse to the risk inherent in increasing the amount of debt, which would increase the amount of fixed interest payments.
Liquidity is another area where a firm’s ratio may deviate from the industry norm due to management’s perception of risk. One firm may maintain a much larger rupee amount of liquid assets than would be indicated by the industry norm.
When the current and quick ratios exceed the industry norms, this can provide the margin of liquidity protection the firm is seeking, but the result of this decision can be a decrease in profitability.
High liquidity means that funds are lying idle and not being used for investment in other profitable areas. Also, the higher the operating assets figure is compared to sales, the lower will be the return on operating assets. In essence, the firm may have too large a current asset base for the level of sales it is generating.
Besides management characteristics that can lead to wide deviations in firm’s ratios compared to the industry norms, there are characteristics of the firm that can lead to such deviations. One of the prime examples is the issue of size. Some industry sources of data average for the whole industry and do not break the analysis down by a firm’s asset size.
Small firms have much more difficulty in raising equity funds than large firms and their access to the bond and common stock markets as tools for financing may be limited or nonexistent.
As a result, small firms utilize trade credit and bank loans to a much greater degree than large firms do. This can lead to a capital structure that is heavily debt oriented, and therefore smaller firms have leverage ratios that are larger than the industry norms.
In utilizing ratio analysis, therefore, we must incorporate both management and firm characteristics that may explain any deviations in a firm’s performance as compared to the industry norm.
Ratio Analysis – Du Pont Control Chart
This is a system of Management Control utilising the “ratio inter-relationships to provide an important series of charts and indicators calling management’s attention to desirable and undesirable trends of corporate performance”.
Where there are standards of performance, this chart makes it easy to judge performance changes with such a system. It isolates the elements of the final figure to appraise the individual factors affecting performance.
Du Pont control chart showing relation of factors affecting Return on Investment is developed along two tiers. The first sequence starts with turnover and the second one with earnings as a percentage of sales. An overall perspective of the financial relationships leading to the earnings rate on investment is available to the management through this chart.
The final investment returns will change if changes take place in any important segment of this structure. The two-tier approach of this chart gives attention to separate forces contributing to profits.
Turnover sequence helps more effective use of available capital and the profit margin sequence strengthens it through a better relationship between sales and costs and this improvement can be achieved.
The Management Achievement Chart and Profit Performance Chart have been designed after making modifications in the Du Pont Chart. These charts help in analysing the management performance as well as in establishing goals and measuring performance against them.
The Management Achievement Chart has two aspects – one deals with operating management and the other financial management.
So, it reflects the performance of the entire management team. Turnover of capital, margin of safety and profit/volume ratio constitute operating management performance and, for better decision-making, all these three relationships should be examined separately before the final figure is arrived at.
The financial operations ratio and the financial leverage ratio determine the financial management achievement. The financial operations ratio is calculated by dividing net profit by operating profit and the financial leverage ratio is calculated by dividing the capital employed by net worth.
The financial policy of a company determines the range of this ratio. The financial executive can operate within this range to get the maximum return on the shareholders’ equity by having an intelligent debt-equity mix.
The product of the financial operations ratio and the financial leverage ratio provides a good index of the performance of financial management. It is for the accounting and the finance department to see that the goals agreed upon on the management performance chart are translated into action.
Top 8 Advantages of Ratio Analysis – Analytical Ability, Inter-firm Comparison, Measurement of Long-term Solvency Position, Measurement of Profitability and More…
Ratio analysis is a very important technique of analysing financial strength and weaknesses of an organisation.
The advantages of ratio analysis is given below:
Advantage # (i) Analytical Ability:
The financial ability of an organisation can be judged through ratio analysis. Solvency, profitability, liquidity, etc., can be analysed with the help of ratios. Weakness can be sorted out and remedial measures can be taken.
Advantage # (ii) Inter-firm Comparison:
With the help of ratio inter-firm comparison under the same management or with the competitors can be judged. Solvency, liquidity, profitability, efficiency, etc., can be compared within the same industry or with outsiders.
Advantage # (iii) Measurement of Long-term Solvency Position:
With the help of ratio analysis, an analyst may determine the long-term debt paying capacity of a firm. Those who are long-term investors of the firm say Creditors, Debenture holders, Bank, etc., can take the decision wisely whether to invest in the firm or not.
Advantage # (iv) Measurement of Profitability:
Ratio analysis helps to determine the earning capacity or profitability of a firm. Moreover, trends or variation in profitability over the years can also be judged with the help of ratio analysis.
Advantage # (v) Measurement of Liquidity Position:
The liquidity position of a firm can also be determined with the help of ratio analysis. Here liquidity means short-term debt repayment capacity. With the help of current ratio, liquid ratio, etc., creditors, financial institutions, etc., can take decisions regarding granting of short-term credit.
Advantage # (vi) Assist in Decision-making:
Overall efficiency of an organisation can be judged with the help of ratio analysis. Management can make valuable decisions on the basis of computed ratios.
Advantage # (vii) Managerial Efficiency Regarding Utilisation of Assets:
With the help of ratio analysis the managerial efficiency regarding utilisation of different assets can be determined.
Advantage # (viii) Assist in Controlling:
Ratio analysis is a very useful tool for controlling the financial activities of a firm. For this purpose different expense ratios are calculated for different years and help the top management aware to control the specific areas.
7 Merits of Ratio Analysis
Merits of Ratio Analysis are as follows:
1. Ratios make it more convenient to estimate other figures when one figure is known.
2. Investment decisions are based on ratio analysis.
3. They act as an index or parameter of efficiency of the firm or Organizations.
4. It is one type of tool management
5. It simplifies many complicated financial statements.
6. It highlights the weakness of the enterprise.
7. It provides more analysis information to the management for decision making and controlling purposes.
7 Major Limitations of Ratio Analysis – Only Based on Comparison, Post-mortem Examination, Uniform Accounting Principles, Problem in Fixing of Standards, Limitations of Financial Statements and More…
Though ratio analysis gives different benefits to an organisation and also to the different outside users still this is not free from limitations.
The limitations of ratio analysis are discussed below:
(i) Only Based on Comparison:
Only calculating a single ratio cannot give a meaningful analysis unless it is compared with another ratio also. For example, calculating current ratio itself cannot give any concrete findings regarding solvency of a firm unless some other ratio like quick or absolute quick ratios are analyzed together to give some conclusion.
Hence, comparison is only one of the techniques for finding some result but other tests also have influence to give some conclusions which are absent in ratio analysis.
(ii) Post-mortem Examination:
Ratio analysis is made on the basis of some past financial statements, i.e., this analysis is purely historical and has no ability to predict the future. Moreover, ratio analysis only helps the management to find out trends of a particular item but cannot prove it.
(iii) Uniform Accounting Principles:
Inter-firm comparison through ratio analysis cannot give a real picture regarding strengths and weaknesses, unless there are uniform accounting principles maintained by the other firms under the same group or by the competing firm.
For example, one firm follows the cost price of stock valuation and another firm follows cost or market price, whichever is lower. Definitely stock turnover ratio will give misleading results.
(iv) Problem in Fixing of Standards:
One of the tools of ratio analysis is to compare the actual result with the standards. But in reality fixing the standard is a very tough task for the analyst and this standard may also vary from industry-to-industry.
The standard ratio once decided for the industry is not rigid and may change over time. Hence, fixing standards for all the ratios is really a very hard task for different situations.
(v) Limitations of Financial Statements:
Financial statements are the sources of calculating ratios. But a financial statement has its many limitations. Ratios calculated on the basis of these statements give misleading results unless some adjustment is made.
(vi) Personal Influence:
Interpreters must have a sound knowledge and analytical ability for calculating ratios. Often it is seen, the interpreter applies his personal influence while determining ratios for different purposes. This may give a misleading result and be valueless for the firm.
(vii) Only Quantitative Measurement:
Ratios are calculated on the basis of two numerical figures and hence quantitative and not qualitative. Only quantitative analysis may give misleading results in different matters.
For example, a high current ratio indicates the favourable loan repayment capacity of the firm, but it may happen the ratio is high due to huge accumulation of inventory in the current asset. Hence, even if the current ratio is high that only gives quantitative proof but not qualitative.
6 Disadvantages of Ratio Analysis
The following are the chief disadvantages of ratios analysis:
(i) Ratio analysis can lead to wrong conclusions because of inconsistency in the financial records of different periods.
(ii) It is generally based on historical figures and is, therefore, a post-mortem only.
(iii) It is based on rough and ready figures and, therefore, it is not accurate.
(iv) The figures by themselves do not give a full background but they are broad indicators. It becomes, therefore, necessary to scrutinize further details in order to ascertain the cause of the several indications shown by ratio analysis.
(v) Accounting ratios may be worked out for any two figures even if they are not significantly related.
(vi) A little window-dressing may have been resorted by some organisations to boost up ratios and give the better picture of the financial position. Thus, the ratio analysis may lead to wrong conclusions.
5 Demerits of Ratio Analysis
Ratios are exceptionally useful tools. However, they should be used with extreme care and considered judgement because they suffer from certain serious drawbacks.
Some of demerits of ratio analysis are listed below:
i. Ratios can sometimes be misleading if an analyst does not know the reliability and soundness of the figures from which they are computed and the financial position of the business at other times of the year.
A business enterprise, for example, may have an acceptable current ratio of 3:1 but a larger part of the accounts receivable comprising a great portion of the current assets may be uncollectible and of no value. When these are deducted, the ratio might be 2:1.
ii. The mechanics of ratio construction are not as important as the proper interpretation of the ratios. As a matter of fact, ratios are only a preliminary step in interpretation. They call attention to certain aspects of the business which need detailed investigation before arriving at any final conclusion.
iii. Ratios can never be the substitute of raw figures. At the time of interpretation, therefore, raw figures should also be referred to.
iv. Intercompany comparison on the basis of ratio analysis is distorted because of the differing practices followed by different companies in respect of allocation of the cost of fixed assets and inventory utilisation as also of the selling and intangible costs between different time periods. Unless there is consistency in adoption of accounting methods, ratio may not prove to be of greater use.
v. Price level changes render ratio analysis difficult.