After reading this article you will learn about:- 1. Meaning of Organisation Charts 2. What Does Organisation Chart Show 3. Kinds 4. Principles 5. Merits 6. Limitations.
Meaning of Organisation Charts:
With increase in size and complexity of organisations; number of departments, sub-units and people working in the organisation is also increasing. There is increasing distance between top executives and people at lower levels and interaction amongst them also becomes increasingly complex.
Visual maps are used so that people have clear understanding of the positions, departments, sub-units and their relationships amongst different departments. This visual representation of organisation structure is known as organisation chart. It gives clear understanding to every person of his position in the organisation vis-a-vis his superiors and subordinates. It clearly defines the authority, responsibility and accountability structure in the organisation.
It is a “line diagram that depicts the broad outlines of an organisation’s structure.” According to Alferd D. Chandler, organisation charts “show in visual form the various major positions or departments in the organisation, the way the various positions are grouped into specific units, reporting relationships from lower to higher levels, and official channels for communicating information.”
ADVERTISEMENTS:
It is representation of the way a firm is organised in boxes and lines where boxes show the activities performed by a company and people who perform these activities and lines show the relationships amongst them, through official chain of command and channels of communication. The chain of command respects the principle of scalar chain and unity of command.
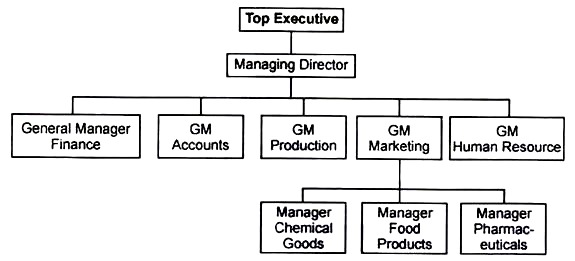
A typical organisation chart looks like this:
What Does Organisation Chart Show:
The organisation chart depicts the following areas of organisation structure:
ADVERTISEMENTS:
1. Division of work:
The workload of the organisation is divided into smaller units. Activities performed at each level are depicted through a box.
2. Chain of command:
The line of authority flowing from top to bottom in single lines shows the relationship between superiors and subordinates.
ADVERTISEMENTS:
3. People who perform the activities:
Along with what activities are performed, the boxes also sometimes show the names of people who perform those tasks.
4. The levels of management:
Though the ultimate responsibility vests with the top executives, delegation of authority down the hierarchy creates levels of management. Organisation charts clearly indicate the number of levels in the organisation structure. The sample chart shown above depicts three levels of management.
ADVERTISEMENTS:
5. The basis of division:
The basis on which organisation charts are prepared, i.e., the basis on which organisational activities are divided is also indicated in these charts.
Different bases of division for preparing organisation charts are:
(a) Division by functional areas:
ADVERTISEMENTS:
The functions performed by the organisation form the basis for preparing the organisation chart.
(b) Division by product:
ADVERTISEMENTS:
These organisation charts are made by companies that sell multiple products.
(c) Division by customers:
When organisations sell goods to different types of customers, the organisation charts appear as follows:
(d) Division by geographical area:
These organisation charts depict the structure of organisations which sell goods in different geographical areas.
(e) Matrix Organisation:
Organisation chart showing combination of functional and divisional structures is known as matrix organisation chart.
Kinds of Organisation Charts:
Organisation charts are broadly of the following types:
ADVERTISEMENTS:
1. Vertical organisation charts,
2. Horizontal organisation charts,
3. Circular organisation charts.
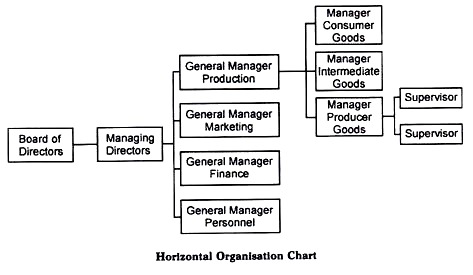
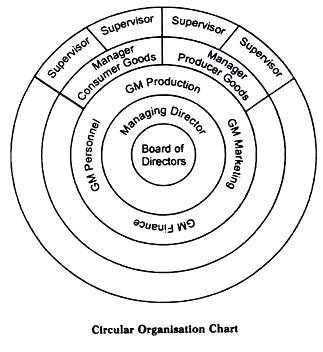
Vertical charts show the flow of authority from top to bottom; horizontal charts show this flow from left to right and circular charts show top position in the innermost circle (concentric circles) which flows towards middle and lower level managers in outward circles. The most commonly adopted organisation charts are vertical charts and they are presented the way they are shown above.
The horizontal and circular organisation charts are presented below:
Principles of Organisation Charts:
Organisation chart is based on the following principles:
1. Clear definition of jobs:
The charts are prepared keeping in view overall jobs of the organisation. Every job has a suitable position on the organisation chart.
2. Authority-responsibility:
The responsibility for each job along with commensurate authority at different levels must be clearly shown on the organisation charts.
3. End result areas:
ADVERTISEMENTS:
These charts represent the activities Gobs) performed at different managerial positions and the end-results (or the objectives) expected of each position.
4. Flexibility:
In the changing environment, these charts must be flexible to report the changing relationships.
5. Informal relationships:
Though all informal relationships cannot be exhibited on these charts, as it would make these charts complex to understand, managers should report as many informal relationships as possible.
6. Control:
ADVERTISEMENTS:
By dividing the overall task into smaller units, these charts provide a yardstick of performance against which actual performance can be measured and suitable measures of control can be adopted.
Merits of Organisation Charts:
Organisation charts have the following merits:
1. Clarity of organisation structure:
Organisation is a complex set of relationships amongst departments and individuals which cannot theoretically be understood by a layman. Organisation charts makes it easy for people within and outside the organization to understand how an organisation is structured into units and sub-units.
2. Authority-responsibility relationships:
The principle of unity of command indicates vertical flow of authority and responsibility from top to bottom and bottom to top respectively. People are aware of their relationship with superiors, subordinates and peers and know the limitations within which they have to work.
ADVERTISEMENTS:
Written definitions of authority and responsibility limit the area of discretion of every individual and define when and where he can use his creativity and initiative to carry out the assigned work. Clarity of authority and responsibility facilitates control as every person is accountable for the tasks assigned to him.
3. Location of experts:
If problem arises in any functional area of the organisation, locating the right person who can solve the problem is facilitated through organisation charts. It also helps in appraising the performance of experts and training them to do better.
4. Location of potential areas of conflict:
There is division of work so that every person is assigned task according to his skill and expertise. Due care is taken to see that no part of the work is left undistributed and there is no duplication of work assigned to two persons. In case that happens, it can be easily located on the organisation charts. These charts, thus, help to avoid overlapping of activities.
5. Scope for organizational improvement:
Conflicts in relationships amongst people in the existing structure can be pointed in these charts which helps to improve organizational relationships.
Limitations of Organisation Charts:
Organisation charts suffer from the following limitations:
1. Blue-print of formal relationships:
Organisation structure changes to adapt to the changing environment. In such a situation, organisation charts act as only a ‘blue print’ of the formal authority – responsibility relationships unless they can quickly change according to the changing environment.
2. Broad view of organisation structure:
The organisation charts depict only a broad framework of the organisational working. Division of jobs into specific activities is not shown in these charts.
3. Reporting informal relationships:
The organisation charts show only formal relationships amongst people in the organisation. Informal relationships develop simultaneously with formal relations. Informal structures are based on social interactions and norms. Formal and informal organisations are complementary to each other but all kinds of informal relationships cannot be drawn on the organisation charts.
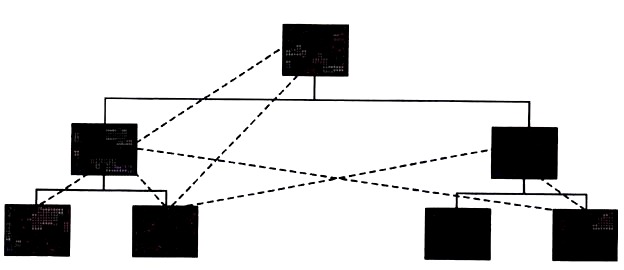
Informal relationships can be partially shown on the organisation charts as follows:
The dotted lines show informal relationships amongst organisational members.
4. Misinterpretation of charts:
Sometimes, people do not understand these charts the way they are meant to be understood. This defeats the purpose of the charts. Robert Townsend observed that “organisation charts are demoralizing because they reinforce the idea that all authority and ability rest at the top of the organisation. Proper training of organisational members can help the top executives overcome this problem.”
5. Extent of authority:
While these charts depict the nature of authority exercised by managers at different levels, they do not show the extent to which authority can be exercised. It is difficult to overcome this limitation as the extent and the degree to which authority can be exercised cannot be measured.
6. Dynamic environment:
Organisation charts show formal relationships amongst people that exist at the time these charts are prepared. Changes in reporting relationships that arise due to changing environment (internal and external) may not be fully shown in the charts as the business environment is changing very fast. These charts, thus, may not show exact relationships at all times.
