
Types of Matrix Used in Business Portfolio Analysis:- 1. BCG Growth-Share Matrix 2. GE Multifactor Portfolio Matrix 3. Hofer’s Product-Market Evolution Matrix 4. Market Life Cycle-Competitive Strength Matrix 5. Arthur D. Little Portfolio Matrix 6. Ansoff’s Product-Market Growth Matrix 7. Directional Policy Matrix. Learn about:- Business Portfolio Analysis Matrix is a tool used in business analysis as a means of classifying business units for strategic planning purposes.
Further this article will help you to learn about:-
- Business Portfolio Analysis in Strategic Management
- Examples of Business Portfolio
- What is Portfolio Analysis Explain with Examples?
- Portfolio Analysis Example
Business Portfolio Analysis Matrix: BCG Matrix, Ansoff’s Matrix and Hofer’s Matrix
The BCG matrix is a chart that had been created by Bruce Henderson for Boston Consulting Group in 1970 to help corporations to analyze their business units or product lines. In general, for large companies, there is always a problem of allocating resources amongst its business units in some logical/rational ways. To overcome such problems, Boston Consulting Group (BCG) has developed a model, which has been termed as BCG matrix.
BCG matrix is also called as ‘Growth-share matrix’, is based on two variables, viz., the rate of growth of the product-market and the market share in that market held by the firm relative to its competitors. This model aims at systematically identifying the main underlying strategic characteristics of specific business segments. This model is developed to analyze the problem of resource deployment among the business units or products of multi-business firms. BCG matrix is based on empirical research, which analyzes products and business by market share and market growth.
The Boston Consulting Group (BCG) has pursued and refined the concept of the experience curve to the point where this essentially production phenomenon has strong implications for marketing strategy. BCG matrix is considered to be an effective tool for strategy formulation. GSM matrix is said to be capable of assigning broad product-market strategies to products on the basis of the market growth rate and its market share relative to competitor’s product.
BCG matrix analysis helps the company to allocate resources and is used as an analytical tool in brand marketing, product management, strategic management and portfolio analysis. BCG matrix provides a scheme for classifying a company’s business according to their strategic needs. Specially cash or finance requirements.
By relating cash flow to market share and market growth, it could then determine those products that represent opportunities for investment, those that should generate investment funds, and those that drain funds and which should be liquidated or divested.
The underlying principle of BCG matrix is the net free cash flow of a company must be kept positive for a company’s growth to be financed through internal funds and its debt capacity. Company’s sustainable growth rate is then determined by the relative cash positions of its portfolio of business. There is a need to strike a balance between cash-generating business and cash-using business if growth is to be funded by the company.
BCG matrix is developed on the basis of two factors:
(a) Relative market share, and
(b) Business growth rate.
These two factors are used to plot all the business (products) in which the firm is involved. The vertical axis measure the annual growth rate of the market and the horizontal axis shows the relative market share of the firm. Each of these dimensions is divided into two categories of high and low, making up a matrix of four cells; and the products are graphed as Stars, Question Marks, Cash Cows and Dogs in these four cells.
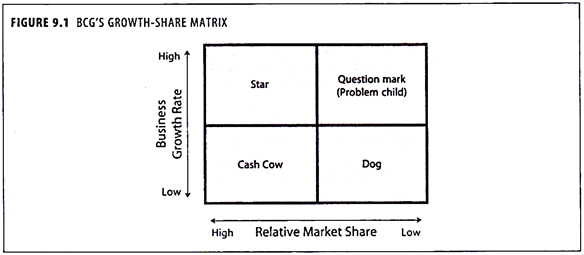
High Growth-High Market Share- Stars:
Star represents those products, which have successfully passed the introduction stage and are on the path of growth. They are self sufficient for cash requirements i.e. cash generated is almost equal to cash used. Stars are the products that are rapidly growing with large market share. They earn high profits but they require substantial investment to maintain their dominant position in a growing market.
Stars are usually profitable and would be the future cash cows. Since the stars are growing rapidly and have the advantage of already having achieved a high share of the market, they provide the firms best profit and growth opportunities. Successful resource deployment beyond cash requirements could lead to a superior market share when industry growth potential falls off.
Resources should be allocated to these units to grow faster than the competition in sales and profits. Stars are leaders in the business and generate large amounts of cash. The stars will entail huge cash outflows to maintain the market share and to ward off competition. The firm will start feeling the experience curve effect.
Overtime, all growth slows. Therefore, stars eventually become cash cows if they hold their market share. If they fail to hold market share, they become dogs. Star is a market leader (i.e. high market share) in a high growth market. Stars are market leaders typically at the peak of their product life cycle and are usually able to generate enough cash to maintain their high share of the market.
When their market growth rate slows, stars become cash cows. The star generally pursues a growth strategy to establish a strong competitive position. Stars reinvest large amounts of revenues to further refine and improve the product.
Stars hold prices down to capture a larger share of the market and to discourage the entry of competitors. Since the stars are growing rapidly and have the advantage of already having achieved a high share of the market, they provide the firms best profit and growth opportunities.
Low Growth-High Market Share- Cash Cows:
A cash cow produces a lot of cash for the company. The company does not have to finance for capacity expansion as the market’s growth rate has slowed down. Since, a cash cow is a market leader; it enjoys economies of scale and higher profit margins. When a market’s annual growth rate falls, a star becomes a cash cow if it still has the largest relative market share.
The important strategic feature of cash cows is that they are generating high cash returns, which can be used to finance the stars or for use elsewhere in the business. Cash cows have a strong market position in the industry that have matured. In comparison with the position of the star performer, cash cows can expect little serious competition because of their relatively low expected industry growth rate.
Competitors will not expect to launch any offensive competitive strategy program in the absence of significant industry potential. Cash cows are units with high market share in a slow-growing industry. Cash cows are ideal for providing the funds needed to pay dividends and debts, recover overheads and supply of funds for investment in other growth areas. Cash cows are established, successful and need less investment to maintain their market share.
The cash cows are in the declining stage of their life cycle, the surplus cash generated by them will be invested in new question marks. Cash cows are more valuable in a portfolio because they can be ‘milked’ to provide cash for other riskier and struggling businesses. The strategy employed in respect of cash cows without having long-term prospects is to harvest i.e. to increase short-term cash flow without considering the long-term effects.
High Growth-Low Market Share- Question Marks:
The question mark is also called as ‘problem child’ or ‘wildcat’. Question marks are the products/businesses whose relative market share is low but have high growth potential. The area question mark identifies those products which are at introduction stage in the market and the cash generated is less than cash used for these products.
Their competitive position is weak but they work for long-term profit and growth. These products require additional funds to improve their market share so that the question mark becomes a star. This strategy may even necessitate foregoing short-term profits. If the firm is unsuccessful in uplifting a question mark to a position star, divestment strategy can be appropriate.
If no improvement is made in market share, question marks will absorb large amount of cash and later, as the growth stops, turn into dogs. If the question mark business becomes successful, it becomes a star. A question mark denotes a new entrant into the market and growth prospects will be tremendous but will have a very low market share and its success or failure cannot be judged easily.
If question marks are left unattended, they are capable of becoming cash traps. Question marks are yet to establish their competitive viability although they usually operate in a rapidly growing market. Therefore, they require huge cash outflow. Strategy must be evolved whether to try for a star or hold the current position or divest. Question marks must be analyzed carefully in order to determine whether they are worth the investment required to achieve market share.
A decision needs to be taken about whether the product justifies considerable expenditure in the hope of increasing its market share, or whether it should be allowed to die quietly. Most businesses start off as a question mark in that the company tries to enter a high-growth market in which there is already a market leader. A question mark require a lot of cash for setting up additional plant and equipment and hire more personnel to keep up with the fast-growing market to overtake the market leader.
Low Growth-Low Market Share- Dogs:
Dogs describe company business that has weak market shares in low-growth markets. Products with low market share and limited growth potential are referred to as dogs. The prospects for such products are bleak. It is better to phase them out rather than continue with them. Dogs should be allowed to die or should be killed off. Although they will show only a modest net cash outflow or even a modest cash inflow, they are cash traps.
They provide a poor return on investment and not enough to achieve the organization’s target rate of return. These units are typically ‘break-even, generating barely enough cash to maintain the market share. Though owning a break-even unit provides the social benefit of providing jobs and possible synergies that assist other business units, from financial point of view such a unit is worthless, not generating cash for the company.
They depress the company’s overall ‘return on assets ratio’, used by the investors, financial institutions and banks in judging how well the company is being managed. Since Dogs hold little promise for the future and may not even pay their own way, they are prime candidates for divestiture. The only way for dog is to increase its rate of sales growth by taking sales away from competitors.
Question marks unable to obtain a dominant market share by the time the industry growth rate inevitably slows become dog.
The feasible strategies are:
(a) Invest more money to see whether the market share can be increased.
(b) Harvest whatever can be extracted and then close down.
(c) Divest by selling or hiving off the business unit.
(d) Minimize the number of dogs in a company.
(e) As soon as they stop delivering, they should be phased-out or otherwise liquidated.
(f) Expensive turnaround plans should be avoided.
In some industries, dogs provide a platform for the development of future stars, act as loss leaders or help to complete a product range, to kill competition, for tax planning etc.
Infants – Products in an early stage of development.
Warhorse – Products that have been cash cows in the past and still making acceptable sales and profits even now.
Dodos – Products with low share, negative growth and negative cash flow.
For a Strategic Business Unit (SBU), there are four strategic alternatives are suggested:
(a) Build – To increase the SBU’s market share, even foregoing short-term earnings to achieve this.
(b) Hold – To preserve the SBU’s market share.
(c) Harvest – To increase the SBU’s short-term cash flow regardless of the long-term effect.
(d) Divest – To sell or liquidate the business because resources can be better used elsewhere.
The BCG matrix is criticized for the following reasons:
(a) It does not talk about profitability at all.
(b) It fails to correctly define market share and market growth.
(c) It ignores competition factors and trends in markets.
(d) It considers only two factors viz., market growth rate and market share, ignoring all other factors.
(e) It does not say how long a product will continue in each phase.
(f) It fails to consider globalization factor, where markets are not limited to a particular area or place.
(g) It encourages strategy development for general use rather than specific criteria.
(h) It implies assumptions about mechanism of corporate financing and market behaviour that are either unnecessary or false.
(i) It overlooks other important strategic factors that are a function of the external competitive environment.
(j) It does not provide direct assistance in company with different businesses in terms of investment opportunities.
(k) Its focus is on cash flow, whereas organizations may be more interested in ROI.
(l) It does not depict the position of business that are about to emerge as winner because the product is entering the takeoff stage,
(m) It neglects small competitors that have fast growing market shares.
(n) It fails to consider that, a business with a low market share can be profitable too.
(o) A high market share does not necessarily lead to profitability all the time.
(p) Market growth is not the only indicator for attractiveness of a market.
(q) It does not offer guidance for inter unit comparisons.
(r) An SBUs profitability, cash flow and industry attractiveness not always be closely related to market share and growth rate.
The BCG matrix cannot be used in isolation. It is a rough model, and the originators of the matrix modified it over time to include, for example, the concept of a ‘cash dog’ which has a low share of a low growth market but still earns a nice profit. The BCG matrix is not a tool for increasing profits. It is an analytical model suggesting guidelines for cross subsidization. BCG matrix does not talk about profits at all; it is useful in increasing cash flow situation.
The application BCG matrix to strategic decision making is in the manner of the diagnostic rather than a prescriptive aid. BCG model evaluates a firm’s products, business and/or profit centres as separate entities. Decisions are made for each entity pertaining to its market share and existing or potential growth rate of the industry.
The BCG matrix helps in forecasting cash flow situations. It also helps to make product mix decisions. An ideal business portfolio (mix of businesses) as envisaged by the BCG matrix would be one with largest number of cash cows and stars and only a few question marks and dogs. The matrix combines market growth rate and market share, and thus directly relates to the experience curve.
BCG matrix provides analysis in determining the competitive position and this can be translated into strategy. It helps the managers ‘balance the flow of cash resources among their various businesses. This sort of analysis enables a company to assess its competitive standing and enables to decide future resources allocation for its product portfolio.
Matrix Type # 2. GE Multifactor Portfolio Matrix:
This matrix is also called as ‘GEs Stoplight Matrix’ or ‘GE Nine-cell Matrix’ or ‘Industry Attractiveness – Business Strength Matrix or-‘GE Business Screen Matrix’ or ‘General Electric-Mckinsey Portfolio Matrix’ or ‘Business Planning Matrix’. This matrix was developed in 1970s by General Electric Company of US with the assistance of the Mckinsey consulting firm. This matrix helps in guiding resource allocation. This analysis is on the basis of two factors viz., business strength and industry attractiveness. This is developed in 3 x 3 grid as shown in figure 9.2.
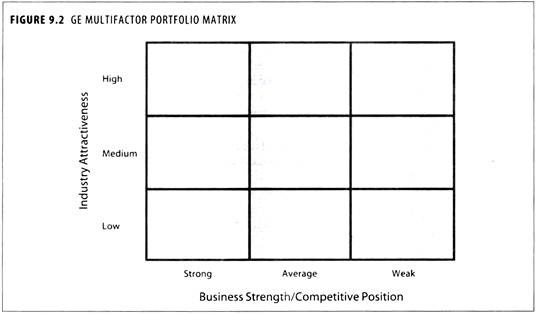
The vertical axis indicates industry attractiveness and the horizontal axis shown the business strength in the industry. The factors that affect market attractiveness are called ‘drivers’.
The industry attractiveness is measured by a number of factors like:
i. Size of market
ii. Market growth rate
iii. Industry profitability
iv. Competitive intensity
v. Economies of scale
vi. Technological requirements
vii. Pricing trends
viii. Overall risk of returns in the industry
ix. Opportunity for differentiation of products and services
x. Demand variability
xi. Segmentation
xii. Distribution structure etc.
Business strength is measured by considering the typical drivers like:
i. Market share
ii. Market share growth rate
iii. Profit margin
iv. Distribution efficiency
v. Brand image
vi. Ability to compete on price and quality
vii. Knowledge of customer
viii. Customer loyalty
ix. Production capacity
x. Access to financial resources
xi. Technological capability
xii. Management calibre etc.
In this model, market growth is replaced by market (industry) attractiveness.
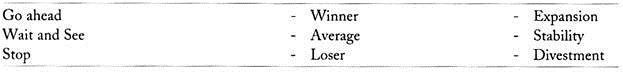
The strategic planning approach in this model is based on analogy of traffic lights at street crossing:
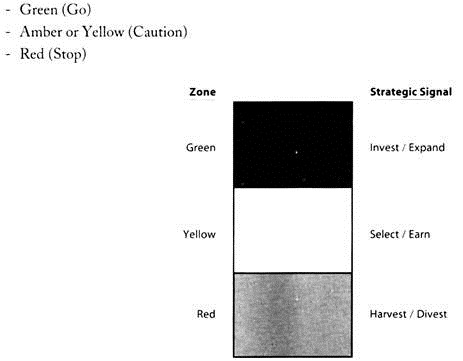
If the product falls in the Green (Go) section i.e. if the business position is strong and industry is at least medium in attractiveness, the strategic decision should be to expand, to invest and grow.
If the business strength is low but industry attractiveness is high, the product is in the Amber/Yellow zone. It needs caution.
A product is Red (Stop) zone indicates that the business strength is low and so is industry attractiveness.
The appropriate strategy in this case should be retrenchment, divestment or liquidation.
The SBUs in the ‘Green’ section maybe said to belong to the category of stars’ or ‘cash cows’ in BCG matrix.
Those in ‘Red’ zone are like ‘dogs’ and those in the Yellow or Amber zone are like ‘question marks’.
Each factor is assigned as a weight which is appropriate to industry or company.
The following steps are taken to plot SBUs on the GE/Mckinsey portfolio matrix:
Step 1 – Specify the typical factors that determine the industry attractiveness. For each product line or SBU, overall industry attractiveness is assessed and rated in a 5-point scale ranging from 5 (very attractive) to 1 (very unattractive).
Step 2 – The typical factors that characterize business strength of each product line or SBU are assessed and measured on a 5-point scale ranging from 1 (very week) to 5 (very strong).
Step 3 – Determine weight of each driver. The company must assign relative importance weights to the drivers.
Step 4 – Multiply the weights with scores of each factor of industry attractiveness and ascertain the overall weighted score of industry attractiveness.
Step 5 – Multiply the weights with scores of each factor of business strength and ascertain the overall weighted score of business strength.
Step 6 – Plot each product line or SBU current position on the matrix.
Step 7 – View resulting graph and interpret it.
Step 8 – Perform a review analysis using adjusted weights and scores (sensitivity analysis).
Industry Attractiveness/Business Strength
= Factor value1 x Factor weighting1 +………….. + Factor valuen x Factor weightingn
Strategic business units are portrayed as a circle plotted in the GE/Mckinsey matrix, whereby:
(a) The size of the circles represents the market size.
(b) The size of the pies represents the market share of the SBUs.
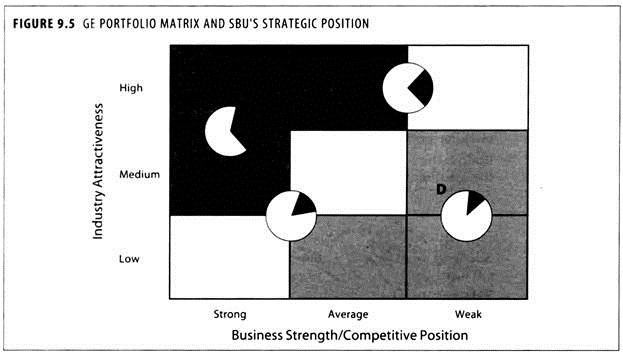
The circles indicate company’s SBUs; the areas of the circles are proportional to the relative size of the industries in which these SBUs compete. The pie slices within the circles represent each SBU’s market share. Thus, circle A shows a company SBU with a 40% market share in a good sized, highly attractive industry in which the company has strong business strength.
Circle B indicates an SBU that has 22% market share but the industry is not very attractive. Circles C that indicates an SBU with high industry attractiveness, but its competitive position is very weak. Circle D that indicates an SBU with low industry attractiveness with weak competitive position. The strategy alternatives suggested for these four SBUs are: build A; hold B; hold/harvest C; and divest D.
SBU A requires to implement growth strategies or Green-light strategy.
SBU B requires to implement stability strategies or Yellow-light strategy.
SBU C requires to implement turnaround strategy or Yellow-light strategy.
SBU D requires to implement divestment strategy or Red-light strategy.
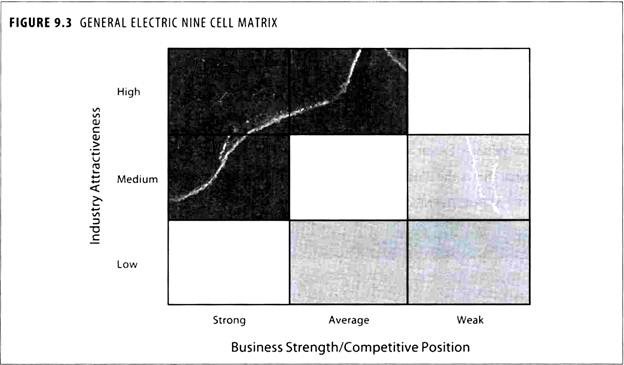
Based on the combinations the following strategies are made:
A firm with a number of products can identify each of them in one of the 9 cells based on the particular cell, where a product is located, different strategies can immediately be suggested.
The table below suggests some strategies to be adopted as per the GE 9 cell matrix:
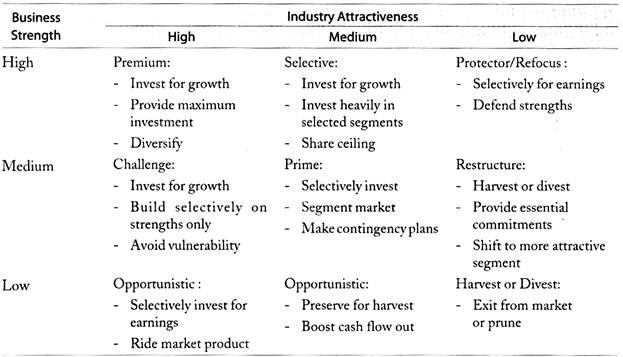
Careful thought must be given as to which cell a product should be placed in the GE Matrix. A much more difficult problem would be to analyze precisely what the strategy should be once a product is located.
Limitations of GE/Mckinsey Matrix:
While the GE approach overcomes some of the problems for the BCG model, both have further limitations:
(a) It is complicated and cumbersome.
(b) Aggregation of the indicators is difficult.
(c) Core competencies are not represented.
(d) Interactions between SBUs are not considered.
(e) It does not depict the position of new products or business units in developing industries.
(f) It does not provide specific strategy to use or how to implement that strategy.
(g) Trying to fit all business units in nine cells may prove difficult for some businesses.
(h) The process of selecting factors, assigning weights, rating and computing values, in reality is based on subjective judgments.
This model is an improvement over the BCG Matrix in the sense that while BCG Matrix bases industry attractiveness on a single variable (industry growth rate) in this model industry attractiveness is measured by a number of factors like size of the market growth rate industry profitability, competitive intensity, technological requirements, etc.
Similarly, while the BCG matrix bases business strength entirely on relative market share, in this model, the business strength is rated considering a number of factors such as market share, market share growth rate, profitability, distribution efficiency, brand image, etc. Also, this 9-cell model is a refinement of the 4-cell BCG Matrix (only high and low) which is too simplistic and in which the link between market share and profitability is not necessarily strong. Low share business can be profitable and vice versa.
Matrix Type # 3. Hofer’s Product-Market Evolution Matrix:
According to this model, a firm’s business is positioned in a 15-cell matrix based on two major variables viz., stage of production-market development and the competitive position. Charles W. Hoffer has suggested a further refinement of GE/Mckinsey portfolio matrix by identifying companies, particularly new businesses, that are about to accelerate their growth. This matrix is also called ‘life-cycle portfolio matrix. An illustrative graph representing Hofer’s matrix is given in figure 9.6 provides potential strategies for different units placed in the matrix.
Hofer’s matrix reflects the stage of development of the product or market. Business units are placed on a grid showing their stage of product-market evolution and their competitive position. Circles represent the industry and the pie wedges represent the market share of the business unit. Hoffers evolution matrix are useful to develop strategies that are appropriate at different stages of the product life cycle.
In Hofer’s matrix, the vertical axis represents the stages of product-market evolution and horizontal axis represents the SBU’s competitive position. In this matrix, three stages of competitive position of SBU (viz., strong, average and week) are shown on horizontal axis. The vertical axis shows the industry’s state in the evolutionary life cycle, starting with initial development and passing through the growth, competitive shake-out, maturity, saturation and decline stages.
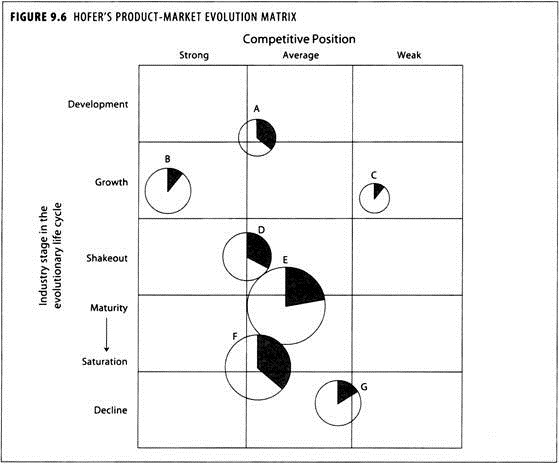
SBU A with average competitive position and in development stage holds out prospects for future development deserves expansion and desired financial resources to be allotted to exploit the opportunities.
SBU B with strong competitive position and in growth stage requires to adopt growth strategies to make it a future winner.
SBU C with weak competitive position which is in growth stage of the industry should give lot of attention and requires a careful formulation of marketing strategies to make it more competitive in the industry.
SBU D with moderately strong position is in the shake-out stage can be probable with close attention and careful marketing strategy formulation. This may also requires adoption of growth strategies.
SBU E with average competitive position and in maturity stage of the industry needs to adopt stability strategies.
SBU F with moderately strong competitive position and is in the maturity stage of the industry life cycle, needs the stability, harvest and retrenchment strategies need to be adopted. No further funds to be invested in this SBU. The market strategies require to hold the market position without fall.
SBU G with moderately weak competitive position and is in the decline state of the industry life cycle need to be divested immediately to arrest any cash loss since it is in a position of loosing. Revival of this SBU is not suggested. The Hofer’s product-market evolution matrix displays business portfolio of an international firm with relative greater degree of accuracy and completeness.
The Hofer’s matrix considered the following variables:
Variable # (a) Market and Consumer Behaviour Variables Like:
i. Buyer needs
ii. Purchase frequency
iii. Buyer concentration
iv. Market segmentation
v. Market size
vi. Elasticity of demand
vii. Buyer loyalty
viii. Seasonality and cyclicality
Variable # (b) Industry Structure Variables Like:
i. Uniqueness of the product
ii. Rate of technological change in product design
iii. Type of product
iv. Number of equal products
v. Barriers to entry
vi. Degree of product differentiation
vii. Transportation and distribution costs
viii. Price/cost structure
ix. Experience curve
x. Degree of integration
xi. Economy of scale etc.
Variable # (c) Competitor Variables Like:
i. Degree of specialization within the industry
ii. Degree of capacity utilization
iii. Degree of seller concentration
iv. Aggressiveness of competition
Variable # (d) Supplier Variables Like:
i. Degree of supplier concentration
ii. Major changes in availability of raw materials
Variable # (e) Broader Environment Variables:
i. Interest rates
ii. Money supply
iii. GNP trend
iv. Growth of population
v. Age distribution of population
vi. Life cycle changes
Variable # (f) Organizations Variables Like:
i. Quality of products
ii. Market share
iii. Marketing intensity
iv. Value added
v. Degree of customer concentration etc.
Hofer developed descriptive propositions for each stage of product life cycle.
For example- in the maturity stage of the product life cycle, Hofer identified the following major determinants of business strategy:
(a) Nature of buyer needs
(b) Degree of product differentiation
(c) Rate of technological change in the process design
(d) Ratio of market segmentation
(e) Ratio of distribution costs to manufacturing
(f) Value added
(g) Frequency with which the product is purchased
Hofer, thereafter formulated normative contingency hypothesis using the above major determinants.
An example for the maturity stage is when:
(a) Degree of product differentiation is low.
(b) The rate of buyer needs is primarily economic.
(c) Rate of technological change in process design is high.
(d) Purchase frequency is high.
(e) Buyer concentration is high.
(f) Degree of capacity utilization is low.
Then the business firms should:
(1) Allocate most of their R&D funds to improvements in process design rather than to new product development.
(2) Allocate most of their plant and equipment expenditures to new equipment purchases.
(3) Seek to integrate forward or backward in order to increase the value they added to the product.
(4) Attempt to improve their production scheduling and inventory control procedures in order to increase their capacity utilization.
(5) Attempt to segment the market.
(6) Attempt to reduce their raw material unit costs by standardizing their product design and using interchangeable components throughout their product line in order to qualify for volume discount.
Matrix Type # 4. Market Life Cycle-Competitive Strength Matrix:
BCG matrix has failed to consider the wide range of factors affecting cash flow beyond market growth and market share. The market life cycle-competitive strength matrix is a 16 cell matrix introduces the four stages of market life cycle viz., introduction, growth, maturity, decline on horizontal axis and competitive strength of SUB is analyzed as high, moderate and low on vertical axis.
Competitive strength is the overall subjective rating, based on a wide range of factors regarding the likelihood of gaining and maintaining a competitive advantage. The matrix considers multiple factors in assessing competitive strength of each SBU. This matrix is developed to identify ‘developing winners’ as well as ‘potential losers’. The total area of the matrix is segregated into three zones viz.- push, caution and danger.
In SBUs falling under ‘Push zone’, the company can invest aggressively and adopt growth strategies. These SBUs generate sufficient cash flow and potential winners can be identified.
In SBUs falling under ‘Caution zone’, the company can invest cautiously, requires careful analysis and decision making; and adopt stability strategies.
In SBUs falling under ‘Danger zone’, the company should stop further investment and adopt retrenchment strategies like harvest, divest and liquidation.
The units falling in the Push zone represents Stars and Cash Cows. The SBUs or products coming under Caution represent question marks. The remaining units falling in Danger zone represents Dogs.
Matrix Type # 5. Arthur D. Little Portfolio Matrix:
The ADL portfolio matrix was suggested by Arthur D. Little (ADL) consists of 20 cell, identified by competitive position and its stage of industry maturity. In this matrix, the stage of industry maturity is identified in four stages viz., embryonic, growth, maturity and ageing. The competitive position is categorized into five classes viz., dominant, strong, favourable, tenable and weak. The purpose of the matrix is to establish the appropriateness of a particular strategy in relation to these two dimensions.
The position within the life cycle and of the company is determined in relation to eight external factors (or disciplines) of the evolutionary stage of the industry.
These are:
(a) Market growth rate
(b) Growth potential
(c) Breadth of product line
(d) Number of competitors
(e) Spread of market share among the competitors
(f) Customer loyalty
(g) Entry barriers
(h) Technology
It is the balance of these factors which determines the life cycle. The competitiveness of the organization can be established by looking at the characteristics of each category. The weights must be defined to calculate the matrix position of a particular business the matrix location of each unit can be used to formulate a natural strategy to accomplish the business goals of the firm.
The competitive position of a company’s SBU or product line can be classified as:
Type # i. Dominant:
It is comparatively a rare situation where the SBU enjoys monopoly position or very strong market ability of its products. This may be due to high level of entry barriers or protected technology leadership.
Type # ii. Strong:
When an SBU enjoys strong competitive position, it can afford to chalk out its own strategies without too much concern for the competitors.
Type # iii. Favourable:
In this competitive position, no firm will enjoy dominant market share and the competition will be intense. The strategy formulation much depends on the competitors moves. The market leader will have a reasonable degree of freedom. Analysis of their product portfolio and learning from them would help others while framing their own strategies.
Type # iv. Tenable:
The tenable competitive position implies that a firm can survive through specialization and focus. These firms are vulnerable to stiff competition in the market. They can withstand with cost focus and differentiation focus strategies.
Type # v. Weak:
The weak firms will generally show poor performance. They can withstand with niche strategy and can become strong players in their area. The consistent weak performance may need to divest or withdraw from the product line.
Matrix Type # 6. Ansoff’s Product-Market Growth Matrix:
The Ansoff matrix describes the firm’s existing and new products to be marketed in existing and new markets. The matrix emphasizes on growth, but firms in declining industries may wish to scale down their operations in existing markets or product areas.
Ansoff has identified four main strategies by the name ‘product-market components’ that are open to a company.
These four strategies are:
Strategy # 1. Market Penetration:
It involves selling more products to the same market i.e. to sell existing products into existing markets. Market penetration involves trying to milk more from existing products and existing markets. If the market as a whole is growing, this might appear a fairly low risk strategy to adopt. Where the market is stagnant, market penetration might involve market share at the expense of other players in the field.
A firm can maintain or increase its current market share with existing products through:
(a) Advertising
(b) Sales promotion
(c) Competitive pricing
(d) Spending more on distribution etc.
Market penetration can be achieved by:
(a) Increasing market share
(b) Increasing product usage
(c) Increasing the frequency of usage
(d) Increasing the quantity used
(e) Finding new application for current users
A company can attain the following through market penetration:
(a) Secure dominance of growth market
(b) Help restructure a mature market by driving out competitors
(c) Increase usage of existing products by the current customers.
Strategy # 2. Market Development:
It involves to sell existing products into new markets. It may try to attract new users for existing products, resulting in a market development e.g. exporting, if the firm has previously served only the domestic market. This strategy might be attractive if the unit has to achieve high sales volumes to utilize capacity efficiency.
This strategy is achieved through:
(a) New geographical markets
(b) New distribution channels
(c) Different packing sizes
(d) Different quality levels
(e) Different pricing to different customers
(f) Offering to different set of customers
(g) Creating new market segments etc.
The main benefits of this strategy are in increased economics of scale, putting competition off, high sales volume utilizing capacity effectively.
Strategy # 3. Product Development:
It involves offering new products to existing markets i.e. new products are launched at existing markets. The company may seek growth by offering modified or new products to current markets.
This strategy can be implemented by:
(a) Adding product features, product refinement
(b) Introducing a new generation product
(c) Developing a new product for the same market
Firms with an expensive distribution network may choose this strategy to make most effective use of it by marketing more products through.
The main advantages of this strategy are:
(a) Product development forces competitors to innovate
(b) New comers to the market might be discouraged
(c) A firm might lose out if its existing products fall in price.
The major drawbacks of this strategy include the expenses and the risk. Product development is not automatically successful, in spite of the common customer base.
Strategy # 4. Diversification:
It involves moving into new market with new products i.e. to sell new products in new markets. This strategy is often more risky since the firm decides to make unfamiliar products for the unfamiliar markets simultaneously. Ansoff suggests that ‘diversification’ should be a last resort strategy. The firm should have a clear idea about what it expects to gain from diversification.
The benefits of this strategy are:
(a) Offers prospects for growth
(b) Investment of surplus funds, not required for other expansions
(c) Achieving greater profitability
(d) Providing a more comprehensive service to customers.
The diversification involves starting up or acquiring businesses outside the company’s current products and markets. Conglomerate diversification can be justified on the existence of synergies.
Ansoff s matrix is only a framework for identifying product-market opportunities and does not provide any criterion for choice. There is nothing to stop a firm carrying at all four strategies simultaneously provided, it has the resources. A firm can pursue a penetration strategy in its existing markets as well as diversifying into new ones.
The major drawback of the matrix is that new technology, and new manufacturing techniques are ignored, which can alter the dynamics of the market. The matrix does not address the degree of change in each product-market area and it does not identify the role of profit. The matrix does not withdrawal option as a strategy, in case of necessity.
Matrix Type # 7. Directional Policy Matrix:
The Directional Policy Matrix (DPM) is developed by Shell Chemicals, U.K. It is another portfolio model helps the companies in identifying one balanced business portfolio. The model is positioned in 3 x 3 matrix. The vertical axis represents the company’s competitive capability graded in three classes viz., weak, average and strong. The horizontal axis represents the business sector prospects which are categorized into unattractive, average and attractive.
The competitive capability of the company is determined on the basis of three factors, such as market position, production capability and product research and development. The profitability prospects of a business are determined on the basis of market growth rate, market quality and environmental prospects. The DPM is an aid to the top management in strategic planning for a conglomerate with diverse position in terms of their prospects and competitive capabilities.
(1) Divestment:
In the first quadrant, the companies competitive capabilities are weak and its business prospects are also unattractive. The SBU will be in a position cash outflow and will be a looser. This represents ‘dog position in BCG matrix. The situation is not likely to improve in future. Therefore, the investments should be withdrawn immediately by divestment. The resources so released can be properly used elsewhere.
(2) Phased Withdrawal:
The competitive capability of this SBU is weak and its business sector prospects are average. The investment in these SBUs should be withdrawn in a phased manner. The company may adopt harvest strategy in these SBUs, without any further new investments in these businesses.
(3) Double or Quit:
The business prospects are attractive but the company’s capability is weak in this area of business. The company has two options to remedy the situation i.e.- (a) invest more to exploit the prospects of the business sector, (b) if not possible to better the situation, it is suggested to quit such business altogether.
(4) Phased Withdrawal:
The SBU falling quadrant (4) has unattractive prospects of the business sector in which the company’s competitive capability is average. The company should withdraw from this business gradually in a phased manner by adopting harvest strategy.
The prospects of the business sector is average in this SBU and the company’s competitive capability is also average. It is suggested to hold the position with little support or investment from outside the SBU. When the position is more clear, either the SBU can continue in such business or withdraw the investment by focusing on other profitable business.
(6) Try Harder:
The business sector prospects are attractive for the SBU, but the company’s competitive capability is average. These SBUs need additional resources to strengthen their capabilities. Niche is the suitable strategy in these situations. Lot of efforts are required to tap the prospects of the business sector.
(7) Cash Generation:
The business sector prospects are bleak but the SBUs competitive capability is strong, which make the SBU to generate cash inflow with its internal strength. Very little additional investments maybe allowed for such SBUs but expansion programs should not be undertaken unless the industry attractiveness is improved substantially.
(8) Growth:
The SBU’s industry attractiveness is average and the company’s competitive capability is strong in this area. This requires infusion of additional funds to support product innovation, R&D activities, capacity expansion etc. They should adopt growth strategies in this situation with caution. The sales promotion and advertising will enable the company to increase its market share.
(9) Market Leadership:
The SBU’s business sector prospects are attractive and the company’s competitive capabilities is also strong. The company can adopt offensive strategies to increase its market share and attain market leadership through innovations, capacity additions and R&D experiments. The economies of scale will also help in attaining cost leadership also. The company can apply growth strategies to such SBUs.