
In this article we will discuss about the strategic analysis and choice as studied in strategic management! Learn about:- 1. Nature of Strategy Analysis and Choice 2. Strategic Choice at the Corporate Level 3. Strategic Choice at Business Level 4. Selection Factors Influencing Strategic Choices 5. Selection of Strategies 6. Contingency Strategies.
Further this article will help you to learn about:-
- Strategy Analysis and Choice
- Strategic Analysis and Choice- BCG Matrix
- Strategic Analysis and Choice- Tools and Techniques
Strategic Analysis and Choice: Nature, Techniques, Approaches, Ways and Factors
Strategic Analysis and Choice – Nature of Strategy Analysis and Choice
Strategy analysis and choice focuses on generating and evaluating alternative strategies, as well as on selecting strategies to pursue. Strategy analysis and choice seeks to determine alternative courses of action that could best enable the firm to achieve its mission and objectives.
ADVERTISEMENTS:
The firm’s present strategies, objectives, and mission together with the external and internal audit information, provide a basis for generating and evaluating feasible alternative strategies. The alternative strategies represent incremental steps that move the firm from its current position to a desired future state.
Alternative strategies are derived from the firm’s vision, mission, objectives, external audit, and internal audit and are consistent with past strategies that have worked well. The strategic analysis discusses the analytical techniques in two stages i.e. techniques applicable at corporate level and then techniques used for business-level strategies.
The techniques that have been discussed for the corporate level include BCG matrix, GE nine-cell planning grid, Hofer’s matrix and Shell Directional Policy Matrix and the techniques for business- level include SWOT analysis, experience curve analysis, grand strategy selection matrix, grand strategy clusters.
ADVERTISEMENTS:
The judgmental factors constitute the other aspect on the basis of which strategic choice is made. We discuss the several factors that guide the strategists in strategic choice. The selection of strategies in three ways i.e. selection against objectives, referral to a higher authority and by partial implementation has been discussed.
Contingency strategies in order to face various situations that may arise in the course of strategy implementation have been discussed. Finally, we discuss the nature and contents of a strategic plan document.
Strategic Analysis and Choice – Strategic Analysis at the Corporate Level: Techniques
Strategic analysis at the corporate level treats a corporate body constituting a portfolio of businesses in a corporate vase. The analysis considers the various issues regarding the several businesses in the corporate portfolio.
ADVERTISEMENTS:
The strategic options are the generic strategies of stability, expansion, retrenchment, and combination. The corporate level strategic analysis is relevant to a multi-business corporation. For single business entities, business-level strategic analysis would suffice.
We begin with an explanation of the corporate level analysis techniques that form a major part of the analysis performed at the corporate level.
Corporate Portfolio Analysis:
During the 1960s and 1970s a number of management consulting companies developed a series of conceptual techniques aimed to help the top officers of diversified corporations better manage their portfolio of businesses. A fundamental method of corporate strategic analysis in diversified, multi-industry companies is the business portfolio analysis approach.
ADVERTISEMENTS:
Corporate portfolio analysis can be defined as a group of techniques that assist strategists in making strategic decisions regarding individual products or businesses in a firm’s portfolio. Corporate portfolio analysis may be employed for competitive analysis and strategic planning in multi-business corporations as well as for less diversified firms.
The main benefit of using a portfolio approach in a multi-business corporation lies in allocating resources at the corporate level to the businesses with highest potential. For instance, a well -diversified company may consider diverting resources from cash-rich businesses to the businesses with faster-growth potential to achieve corporate objectives in an optimal way.
A number of techniques considered suitable for corporate portfolio analysis are discussed below:
Technique # 1. BCG Matrix:
ADVERTISEMENTS:
The BCG matrix is a tool that can be used to determine what priorities should be given in the product portfolio of a business unit. It has 2 dimensions; market share and market growth. The basic idea behind it is that the bigger the market share a product has or the faster the product’s market grows the better it is for the company. Placing products in the BCG matrix results in 4 categories in a portfolio of a company.
Boston Consulting Group’s growth/share matrix has become one of the most widely used approaches that facilitate corporate strategic analysis of likely “generators” and optimum “users” of corporate resources. Each of the company’s businesses is positioned in the matrix in accordance with its market growth rate and relative competitive position.
Market growth rate refers to the projected rate of sales growth for the market that a particular business caters to. It is usually measured as the percentage increase in sales in a market or unit volume over the two most recent years. Market growth rate indicates relative attractiveness of the markets each of the businesses serves in a portfolio of businesses.
Relative competitive position means the ratio of a business’s market share divided by the market share of the largest competitor in that market and provides a basis for comparing the relative strengths of different businesses in the portfolio.
ADVERTISEMENTS:
Stars:
Stars are businesses that have high market share in a high growth environment. They are growing rapidly and are the best long-run opportunities in terms of growth and profitability in the firm’s portfolio. They are leaders in their business and generate large amount of cash. They require substantial investment to maintain and expand their dominant position in a growing market.
The investment requirement often exceeds the internal cash generation. These businesses, therefore, are short-tern, priority consumers of corporate resources. Because of their high share, they are expected to enjoy a lower cost structure than their lower share competitors because of the experience effects. In brief,
Stars (=high growth, high market share)
ADVERTISEMENTS:
i. Use large amounts of cash and are leaders in the business so they should also generate large amounts of cash.
ii. Frequently roughly in balance on net cash flow. However if needed any attempt should be made to hold share, because the rewards will be a cash cow if market share is kept.
Cash Cows:
Cash cows are low-growth, high market-share products or divisions. Because of their high market share, they have low costs and generate cash. Since growth is slow, reinvestment costs are low. Cash cows provide funds for overhead, dividends, and investment for the rest of the firm and are in excess of their needs.
Therefore, these businesses serve as a source of corporate resources for deployment elsewhere (to stars and question marks) and are managed to maintain their strong market share while efficiently generating excess They are the foundation of the firm, and stability is the appropriate strategy for them.
ADVERTISEMENTS:
Cash Cows (=low growth, high market share)
i. profits and cash generation should be high , and because of the low growth, investments needed should be low. Keep profits high
ii. Foundation of a company
Dogs:
Such businesses are defined as those in which the growth rate is slow and the relative market share is low compared to the leading competitors. Because of their low market share these businesses are often expected to have a higher cost structure than industry leaders.
It is difficult and extremely expensive for them to gain share in a mature market. Divestment or rapid harvesting is the recommended strategies for such weak businesses. Often these low capital intensity businesses can be fruitful cash generators.
ADVERTISEMENTS:
Dogs (=low growth, low market share)
i. Avoid and minimize the number of dogs in a company.
ii. Beware of expensive ‘turn around plans’.
iii. Deliver cash, otherwise liquidate
Question Marks (= high growth, low market share)
a. Have the worst cash characteristics of all, because high demands and low returns due to low market share.
ADVERTISEMENTS:
b. If nothing is done to change the market share, question marks will simply absorb great amounts of cash and later, as the growth stops, a dog.
c. Either invest heavily or sell off or invest nothing and generate whatever cash it can. Increase market share or deliver cash.
Question marks are high-growth, low-market-share products or divisions. Their conditions are the worst, for their cash needs are high, but cash generation is low. Such businesses are seen to indicate opportunity. They need to gain share by generating additional market share and hence lower cost via experience gains, while the growth rate in the industry is high.
The primary objective of such businesses should be to gain share rather than maximize short-term profitability. So question marks should be converted into stars, then later into cash cows. This strategy will lead to a cash drain in the short run but positive flow in the long run. The other option is divestment.
This technique usually applies to multiple-SBU firms making decisions about the expansion, maintenance and retrenchment of different SBUs. Its’ goal is to determine the corporate strategy that best provides a balanced portfolio of business units. Glueck observes, ‘The goal of all this is to have a balanced portfolio of product or divisions’.
Some of the BCG prescriptions could ultimately lead to a lack of innovative product introductions, since by definition, new products start as a dog or question marks”
ADVERTISEMENTS:
The BCG matrix was a valuable initial development in the portfolio approach to corporate-level strategy evaluation. BCG’s ideal, balanced portfolio would have the largest sales in cash cows and starts, with only a few question marks and very few dogs.
BCG matrix makes two major contributions to corporate strategic choice:
1. The assignment of a specific role or mission for each business unit.
2. The integration of multiple business units into a total corporate strategy.
BCG matrix suffers from a number of limitations:
ADVERTISEMENTS:
1. Since it is difficult to define a market clearly, measuring market share and market growth rate becomes more difficult.
2. Dividing the matrix into four cells based on a high/low classification scheme is too simplistic. It does not recognize the markets with average growth rates or the businesses with average market shares.
3. The relationship between market share and profitability varies across industries and market segments. In some industries a large market share creates major advantages in unit costs; in others it does not. Some companies, for instance Mercedes Benz and Polaroid, with low market share can generate superior profitability and cash flow with careful strategies based on differentiation, innovation or market segmentation.
4. The matrix is not helpful particularly in comparing relative investment opportunities across different business units in the corporate portfolio. For example, is every star better than a cash cow? How should one question mark be compared to another in terms of whether it should be built into a star or divested?
5. Strategic evaluation of a set of businesses requires examination of more than relative market shares and market growth. The attractiveness of an industry may increase based on technological, seasonal, competitive, or other considerations as much as on growth rate. Likewise, the value of a business within a corporate portfolio is often linked to considerations other than market share.
6. The four colorful classification in the BCG matrix somewhat oversimplify the types of businesses in a corporate portfolio. Likewise, the simple strategic missions recommended by the BCG matrix often don’t reflect the diversity of options available.
7. Executives dislike the use of terminology such as dog, question mark cash-cow in BCG matrix. These terms are seen as negative, stable and unnecessarily graphic.
Technique # 2. Threats-Opportunities-Weaknesses-Strengths (TOWS) Matrix:
The TOWS matrix is an important tool that helps managers develop four types of strategies:
(a) SO Strategies
(b) WO Strategies
(c) ST Strategies
(d) WT Strategies
Matching key external and internal factors is the most tedious part of developing a TOWS Matrix. It requires good judgment. However, there is no one best set of matches.
(a) SO Strategies:
SO strategies use a firm’s internal strengths to take advantage of external opportunities. All managers would like their organization to be in a position in which internal strengths can be used to take advantage of external trends and events. Organizations generally will pursue WO, ST, or WT strategies in order to get into a situation in which they can apply SO Strategies.
When a firm has major weaknesses, it will strive to overcome them and convert them into strengths. When an organization confronts major threats, it will attempt to avoid them in order to focus on opportunities.
(b) WO Strategies:
WO strategies focus at improving internal weaknesses by taking advantage of external opportunities. Sometimes a firm may have key external opportunities but it may have internal weaknesses that can prevent it from exploiting them.
For example, there may be a huge demand for electronic devices to control the amount and timing of fuel injection in automobile engines (opportunity), but a certain auto parts manufacturer may not possess the technology required for producing these devices (weakness).
The firm may consider one possible WO strategy to acquire this technology by forming a joint venture with a firm having competency in this area. Another WO strategy may be to hire and train internal people with the required technical capabilities.
(c) ST Strategies:
ST strategies make use of firm’s strengths to minimize the impact of external threats.
(d) WT Strategies:
WT strategies are defensive tactics directed at reducing internal weakness and avoiding external threats. An organization faced with numerous external threats and internal weaknesses may indeed be in a precarious position. In fact, such a firm may have to battle for its survival, merge, retrench, declare bankruptcy, or choose liquidation.
The TOWS matrix involves eight steps:
1. List the firm’s key external opportunities.
2. List the firm’s key external threats.
3. List the firm’s key internal strengths.
4. List the firm’s key internal weaknesses.
5. Match internal strengths with external opportunities, and record the resultant SO Strategies in the appropriate cell.
6. Match internal weaknesses with external opportunities, and record the resultant WO Strategies.
7. Match internal strengths with external threats, and record the resultant ST Strategies.
8. Match internal weaknesses with external threats, and record the resultant WT Strategies.
Technique # 3. GE Nine-Cell Planning Grid:
GE nine cell planning grid, tries to overcome some of the limitations of BCG matrix in two ways:
1. It uses multiple factors to assess industry attractiveness and business strength in place of the single measure employed in the BCG matrix.
2. It expanded the matrix from four cells to nine cells. It replaced the high/low axes with high/medium/low making a finer distinction between business portfolio positions.
The grid then does rating of each of the company’s business units on multiple sets of strategic factor within each axis of the grid.
In order to assess the industry attractiveness factors such as market growth, size of market, industry profitability, competition, seasonality and cyclical qualities, economies of scale, technology, and social/environmental/ legal/human factors are included.
For assessing business strength factors such as market share, profit margin, ability to compete, customer and market knowledge, competitive position, technology, and management caliber are identified.
The strategists then calculate “subjectively” a business’s position within the planning grid by quantifying the two dimensions of the grid.
The strategist first selects industry attractiveness factors to measure industry attractiveness and then assign each industry attractiveness factor a weight that reflects its perceived importance as compared to other attractiveness factors. Favorable to unfavorable future conditions for those factors are forecast and rated based on some scale (0 to 1 scale is illustrative).
Then a weighted composite scope is obtained for a business’s overall industry attractiveness. In order to assess business, a similar procedure is followed in selecting factors, assigning weights to them, and then rating the business on these dimensions.
Thus the GE planning grid might prove to be a useful tool for assessing a business within a corporate portfolio. Usually several managers are involved during the planning process. The inclusion and exclusion of factors and their rating and weighting are primarily matters of managerial judgment. This classifies businesses in terms of both the projected strength of the business and the projected attractiveness of the industry.
The decisions concerning the resource allocation remain quite similar to those in the BCG approach. Business classified as invest to grow would be treated like the stars in the BCG matrix. These businesses would be provided resources to pursue growth-oriented strategies.
Businesses classified in the harvest/divest category would be managed like the dogs in the BCG matrix. Businesses classified, as selectivity/ earnings would either be managed as cash cows or as question marks.
While the strategic recommendations generated by the GE planning grid are similar to those from the BCG matrix, the GE nine-cell grid improves on the BCG matrix in three fundamental ways.
i. The terminology associated with GE grid is preferable because it is less offensive and more universally understood.
ii. The multiple measures associated with each dimension of the GE grid include more factors relevant to business strength and market attractiveness than simply market share and market growth.
iii. The nine-cell format allows finer distinction between portfolio positions than does the four-cell BCG format.
Technique # 4. Hofer’s Matrix:
Hofer criticizes the BCG matrix because it inadequately represents new businesses in new industries that are just starting to grow. Hofer offers an extension of BCG analysis that remedies that inadequacy. Hofer analyzed businesses in terms of their competitive position and stage of product-market evolution.
Circles represent the size of the industries involved. The pie wedges within the circles represent the market shares of the firm. Hofer suggests that these be plotted for present and future businesses.
Strategic choices based upon such a scheme might follow the logic below:
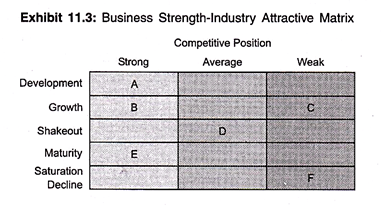
Business A seems to be an emerging star, and thus a target for excess resource allocation-especially to strengthen its competitive position in light of its strong market share.
i. Business B might follow much the same scenario as business A, but corporate resource allocation would probably be contingent on determining why B has been unable to obtain a higher market share, given its strong competitive position, and on the presentation of sound plans to rectify that deficiency.
ii. Business C and D are question marks, though C is a strong candidate for retrenchment.
iii. Business F and, to a lesser extent, business E represent cash cows within the corporate portfolio and would be key targets for corporate resource generation.
iv. Business G appears to be an emerging dog, managed to generate short-term cash flow and targeted for eventual divestiture or liquidation.
Hofer’s approach can be a useful tool to aid the thinking of strategists in multiple- SBU firms who are considering alternative strategies for their various SBUs. Even within a single SBU with multiple products and/or markets, the approach can aid the thinking about the desired portfolio.
An Assessment of Corporate Portfolio Analysis:
Hill and Jones point four main flaws with of the portfolio planning techniques:
i. An assessment of a business in terms of only the two dimensions of market share and industry growth can be misleading as a number of other factors need to be taken into account.
ii. The relation between relative market share and cost saving is not directly proportional. Companies with a low market share but focused on a market niche could have a low operations cost.
iii. A high market share in a low-growth industry does not necessarily result in the large positive flow.
iv. None of the portfolio planning techniques pays attention to the source of value creation from diversification strategies. They treat business units as independent, whereas they are linked to the corporate headquarter to share skills and competencies.
Managements do not pay adequate attention to the process of managing a large diversified company. They consider that success is simply a matter of putting together the right portfolio of businesses, whereas in reality it comes from managing a diversified portfolio to create value.
Technique # 5. Shell Directional Policy Matrix:
The Shell Oil Company developed the Directional Policy Matrix in the nineteen seventies following the widespread implementation of the Boston Matrix. General Electric and the McKinsey Company also contributed to the development of this technique, which resulted in what is now known as the GE-McKinsey, or Directional Policy Matrix.
In the Directional Policy Matrix, the vertical axis is defined as ‘Market Attractiveness’ and the horizontal axes as ‘Competitive Strength’. The individual factors that comprise market attractiveness may be referred to as external variables, i.e. factors outside the control of the company.
The individual factors that comprise ‘Competitive Strength’ may be referred to as internal variables, i.e. factors within the control of the company. Selecting the factors is not a trivial matter and should involve collective effort from key managers and senior executives.
As the process is largely unscientific it is important that as many parties are involved as possible. When done properly the result will be a consensus view that reflects organizational values.
Unlike the Boston Matrix in which one is looking for a balance of business opportunities spread amongst growth and maturing markets, in the Directional Policy Matrix the concentration of business opportunities should be focused around the ‘Leader’ domain, i.e. the top left hand area of the matrix.
Under such circumstances, one is looking at a strong portfolio where the company is focusing on markets that are attractive and where it is acknowledged as being competitive. Note that metrics relating to market size and growth may not feature in the ‘Segment Attractiveness’ axis; it is quite possible for segments labeled as ‘Cash Cows’ (bottom right hand comer in the Boston Matrix) to appear in this domain.
The closer and opportunity is towards the bottom and the right hand corner of the matrix, the weaker the company is in relation to market requirements, and the less attractive the market. If the company finds significant elements of the portfolio in the ‘Divest’ domain it needs to think quickly about what actions to take, e.g. to what extent should they be ‘milked’ and how quickly should they be disposed of. Despite its potential, an opportunity labeled as a ‘Question Mark’ product in the Boston Matrix could fall into this domain if it is not strategically aligned with the holding group.
Areas in between are more problematic. The company will need to make a strategic decision on whether or not to keep the segment in the portfolio, the amount to invest in it, whether it can ever hope to achieve market leadership, the extent to which it should generate cash and so on.
Generally speaking the further towards the top and right, the more likely one is to invest, as one is approaching markets that the company would deem as attractive, despite the fact that the company is not yet competitive. Conversely those opportunities towards the bottom and left are in areas that the company would find less attractive, and should be managed diligently for cash.
Leader Domain:
The strategy should be to maintain this position. At certain stages this may imply a need for resources which cannot be met entirely from funds generated by the product, (e.g. resources to expand capacity), although earnings should be above average.
Try Harder Domain:
The implication is that the product can be moved towards the leadership box by judicious application of resource. In these circumstances the company should certainly consider making available resources in excess of what the product can generate.
Growth Domain:
Investment should be made to allow the product to grow with the market. Generally, the product will generate sufficient cash to be self-financing and should not be making demands on other corporate cash resources.
Double or Quit Domain:
Tomorrow’s breadwinners among today’s R and D projects may come from this area. Putting the strategy simply, those with the best prospects should be selected for full backing and development; the rest should be abandoned.
Proceed with Care Domain:
In this position, some investments may be justified but major investments should be made with extreme caution.
Cash Generator Domain:
A typical situation in this matrix area is when the company has a product that is moving towards the end of its life cycle and is being replaced in the market by other products. No finance should be allowed for expansion, and so long as it is profitable, the opportunity should be used as a source of cash for other areas. Every effort should be made to maximize profits since this particular activity has no long-term future.
Phased Withdrawal Domain:
A product with an average to weak position with unattractive market prospects or a weak position with average market prospects is unlikely to be earning any significant amounts of cash. The indicated strategy is to realize the value of the assets on a controlled basis to make the resources available for redeployment elsewhere.
Divestment Domain:
Products falling in this area will probably be losing money, not necessarily every year, but the losses in bad years will outweigh the gains in good years. It is unlikely that management will be surprised by specific activities falling into this area since poor performance should already be known.
A Comparison of the Boston and Directional Policy Matrix Techniques:
Many major companies use the Boston Matrix technique and it is apparent that Market Growth and Relative Market Share are very powerful and informative key business indicators. But it is equally clear that Market Growth and Relative Market Shares are not necessarily the only determinants of commercial success.
Likewise it may not be possible to clearly define specific competitors in segments. For example, an IT company that is targeting large corporates using ‘older’ technologies may find itself competing with a whole raft of management consultancies, systems suppliers and even the corporate’s own in-house IT department.
The profile of competition will change with every bid, and defining the economic performance of specific competitors (as required by the Boston Technique) will be an impossibility.
The Directional Policy Matrix overcomes these limitations by utilising a multivariate approach and therefore provides an alternative technique when other factors are more important. Note metrics relating to size, growth, and share can be left out of the equation altogether!
However, in providing this extra sophistication, the utility of the tool and its successful use are dependent upon nominating the correct key determinants for success, i.e. correct Segment Attractiveness Criteria and Critical Success Factors.
Whilst it is much easier to make accurate assessments of Market Growth and the Relative Market Shares (of competing companies), the Directional Policy Matrix necessitates an assessment of the company’s relative strengths and weaknesses compared to the norms of ‘best’ case and ‘worst case’ scenarios, or compared to the different types of competitor that it typically faces in each segment.
Qualitative market research techniques can be of enormous help in arriving at a view about what the criteria should be, the weightings and the relative performance of different types of competitor within the market.
Technique # 6. Strategic Position and Action Evaluation (SPACE) Matrix:
The Strategic Position and Action Evaluation (SPACE) matrix is another important matching tool. Its four-quadrant framework indicates whether aggressive, conservative, defensive, or competitive strategies are most appropriate for a given organization.
The axes of the matrix represent two internal dimensions (financial strength (FS)) and competitive advantage (CA) and two external dimensions (environmental stability (ES)) and industry strength (IS). These four factors are the most important determinants of an organization’s overall strategic position.
Depending upon the type of organization, several variables could make up each of the dimensions represented on the axes of the SPACE matrix.
SPACE matrix involves the following steps:
1. Select a set of variables to define financial strength (FS), competitive advantage (CA), environmental stability (ES), and industry strength (IS).
2. Assign a numerical value ranging from +1 (worst) to +6(best) t each of the variables that make up the FS and IS dimensions. Assign a numerical value from -1 (best) to -6(worst) to each of the variables that make up the ES and CA dimensions.
3. Compute an average score for FS,CA, IS, and ES by summing the values given to the variables of each dimension and then by dividing by the number of variables included in the respective dimension.
4. Plot the average scores for FS, IS, ES, and CA on the appropriate axis in the SPACE matrix.
5. Add the two scores on the x-axis and plot the resultant point on X. Add the two scores on the y-axis and plot the resultant point on Y. Plot the intersection of the new xy point.
6. Draw a directional vector from the origin of the SPACE matrix through the new intersection point. This vector reveals the type of strategies recommended for the organization- aggressive, competitive, defensive, or conservative.
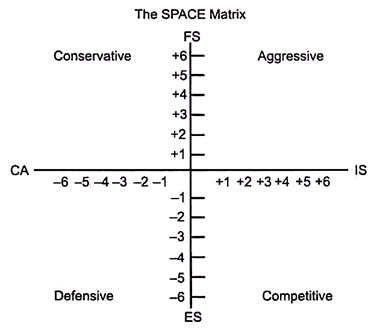
The directional vector associated with each profile suggests the type of strategies to pursue: aggressive, conservative, defensive, or competitive. When a firm’s directional vector is located in the aggressive quadrant of the SPACE matrix, an organization is in an excellent position to use its internal strengths- (1) to take advantage of external opportunities, (2) overcome internal weaknesses, and (3) avoid external threats.
Therefore, market penetration, market development, product development, backward integration, forward integration, horizontal integration, conglomerate diversification, concentric diversification, horizontal diversification, or a combination strategy all can be feasible, depending on the specific circumstances that face the firm.
The directional vector in the conservative quadrant implies staying close to the firm’s basic competencies and not taking excessive risks. Conservative strategies most often include market penetration, market development, product development, and concentric diversification.
The directional vector in the defensive quadrant suggests that the firm should focus on rectifying internal weaknesses and avoiding external threats. Defensive strategies include retrenchment, divestiture, liquidation, and concentric diversification.
Finally, the directional vector in the competitive quadrant of the SPACE matrix suggests backward, forward, and horizontal integration, market penetration, market development, product development and joint ventures.
Strategic Analysis and Choice – Strategic Choice at Business Level: Approaches
Once a multi-industry firm has identified business units in terms of invest, hold, or harvest, each business unit may identify and evaluate its grand strategy alternatives.
A single business should consider a number of approaches in selecting its grand strategy. Here we will discuss SWOT analysis, experience curve analysis, life cycle analysis, grand strategy selection matrix and grand strategy clusters.
Approach # 1. SWOT Analysis:
SWOT stands for Strengths and Weaknesses of a business and environmental Opportunities and Threats a business faces. SWOT analysis identifies systematically these factors and the strategy that reflects the best match between them. It is based on the assumption that an effective strategy maximizes a business’s strengths and opportunities and minimizes its weakness and threats.
An opportunity is a major favorable situation in the firm’s environment. Key trends, such as identification of a previously overlooked market segment, changes in competitive or regulatory circumstances, technological changes, and improved buyer or supplier relations, are the sources of opportunities for a firm.
A threat stands for a major unfavorable situation in the firm’s environment or an impediment to the firm’s current and/or desired future position. The major threats to a firm’s future success might include the factors such as the entry of new competitor, increased bargaining power of buyer or supplier, major technological change, slow market growth and changing regulations.
For instance increasing use of personal computers was a major opportunity for IBM. An opportunity for one firm can be a strategic threat to another. If the managers of a firm clearly understand the opportunities and threats their firm is likely to face, it assists them to identify realistic strategic alternatives and clarifies the most effective niche for the firm.
Strength is a resource, skill, a distinctive competence or other advantage and the needs of markets a firm serves or anticipates serving that gives the firm a comparative advantage relative to competitors in the marketplace. Financial resources, image, market leadership, and buyer/supplier relations are examples of strength.
A weakness is a limitation or deficiency in resources, skills and capabilities that seriously impedes effective performances. Facilities, financial resources, management capabilities, marketing skills, and brand image could be sources of weaknesses.
Identification of key strengths and weaknesses of the firm helps in narrowing down the choice of alternatives and choosing a strategy. While identification of distinctive competence and critical weaknesses in relation to key determinants of success for different market segments provides a useful framework for choosing the best strategy.
SWOT analysis helps in two ways in strategic choice decision-making:
1. It provides a logical framework for guiding systematic discussions of the business’s situation, alternative strategies, and, the choice of strategy.
2. It provides a structured approach for the systematic comparison of key external opportunities and threats with internal strengths and weaknesses.
For strategy formulation, the firm attempts to build upon its strengths and eliminate its weaknesses. When the firm does not possess the skills required to take advantage of opportunities or avoid threats, the necessary resources may be identified from the SWOT analysis and steps taken to procure the strengths or to reduce any weaknesses.
Approach # 2. Experience Curve Analysis:
The concept of experience curve refers to systematic unit-cost reductions that have been observed to occur over the life of a product. According to the experience curve concept, unit cost declines as a firm accumulates experience in terms of a cumulative volume of production.
It implies that larger firms in an industry are likely to have lower unit costs as compared to smaller firms, thereby gaining a competitive cost advantage Learning effects, economies of scale, product redesign and technological improvements underlie the experience curve phenomenon.
In other words, a company increases the accumulated volume of its output over time, it is able to realize both economies of scale and learning effect. As a result, unit cost fall with increases in accumulated output.
The experience curve is significant from strategic choice point of view. It suggests that increasing a company’s product volume and market share will also bring cost advantages over the competition.
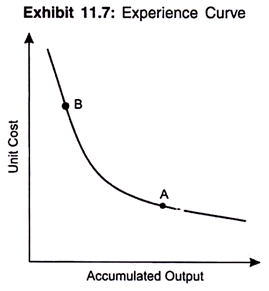
Figure 11.7 explains that company A down the experience curve has a cost advantage over company B. The concept of experience curve is more relevant in those industries that are engaged in the mass-production of standardized output. If a firm desires to gain more efficiency and attain low cost position, it must ride down the experience curve and achieve cost advantages over its competitors.
For example Japanese semiconductor companies used such tactics to ride down the experience curve and gain a competitive advantage over their U.S. rivals in the market for DRAM chips. Hill and Jones warn companies that go further down the experience curve, should not become complacent about its cost advantages.
They give three reasons why companies should not become complacent about their efficiency-based cost advantages derived from experience effects:
i. Neither learning effects not economies of scale go on forever, the experience curve is like to bottom out at some point. Further unit-cost reduction from learning effects and economies of scale will be difficult to derive. Other firms will also be able to reduce their costs and equalize with the cost leader.
Therefore, establishing a sustainable competitive advantage must involve strategic factors as better customer, responsiveness, product quality, or innovation in addition to the minimization of production costs by utilizing existing technologies.
ii. The development of new technologies may turn competitive cost advantages of experience effects obsolete.
iii. High volume does not necessarily give a company a cost advantage.
Approach # 3. Grand Strategy Selection Matrix:
Grand strategy selection matrix is another guide to the choice of a promising grand strategy. The matrix is based upon the principal purpose of the grand strategy and the choice of an internal or external emphasis for growth and/or profitability. The early approaches to strategy selection were based on matching a concern for internal versus external growth with a principal desire to either overcome weakness or maximize strength.
Most experts are now of the opinion that the unique set of conditions that exist for the planning period and the company strengths and weaknesses guide the better selection of a strategy. This led to the development of grand strategy selection matrix.
A business firm in quadrant, the first quadrant finds itself overly committed to a particular business with limited growth opportunities or involving high risks. Vertical integration is the appropriate strategy that enables the firm to curtail risk by reducing uncertainty either about inputs or about access to customers.
Alternatively, conglomerate diversification provides a profitable option for investment without diverting management focus from the main business. However, the external orientation to overcoming weaknesses usually results in the most costly grant strategies.
The decision to acquire another business needs sizable financial investments and large initial time. Thus strategists pondering over these approaches must protect against exchanging one set of weaknesses for another.
Firms in quadrant II opt to divert resources from one business activity to another within the company. This is a more conservative approach to overcome weakness than the earlier one and does not reduce the company’s commitment to its basic mission.
It has the characteristic of rewarding success and further development of proven competitive advantages. Retrenchment is the least disruptive strategy of this quadrant and can be used as a turnaround strategy if weaknesses grew from inefficiencies. Streamlining its operations and eliminating waste, a business can achieve new strengths.
However, when the weaknesses are a major obstruction to success in the industry, and when the costs of overcoming the weaknesses are unaffordable or are not justified by a cost-benefit analysis, then eliminating the business must be considered.
Divesture offers the best possibility for recouping the company’s investment. Liquidation can be an attractive strategy when the alternatives cause unnecessary outflow of organizational resources.
People say that a company should build on its strengths. This is based on the assumption that growth and survival of a business depend on its ability to seize a market share that is large enough enable to reap benefits of economies of scale.
If a firm adopts this approach, four alternative strategic options can be considered:
1. Concentration
2. Market development
3. Product development, and
4. Innovation
When a firm adopts concentration, it is strongly committed to its existing products and markets and strives to solidify its position by reinvesting resources to fortify its strength.
With market or product development strategies the business attempts to increase its operations. If the strategists feel that the current products can be well received by new customer groups, market development is done. Product development is resorted when it is believed that existing customers possess an interest in products related to the firm’s existing lines of business.
Innovation is preferred when a business possess strengths in creative product design or unique production technologies. Peters and Water argued that innovative companies are especially adroit at continually responding to change of any sort in their environment…. When the environment changes, these companies change too.
If a business attempts to maximize its strength by aggressively expanding its basis of operations, it needs to lay an external emphasis in selecting a grand strategy.
The possible options include:
1. Horizontal integration
2. Concentric diversification
3. Joint venture
Horizontal integration enables a firm to quickly increase its output capability.
In concentric diversification the distinctive competencies of the diversifying firm facilitate a smooth, synergistic and profitable expansion.
Joint venture permits a business to expand its strengths into competitive fields that it would hesitate to enter alone. A partner’s capabilities in the functional areas can reduce financial investment and increase the probability of success.
Approach # 4. Grand Strategy Clusters:
Thompson and Strickland’s improvements on BCG growth share portfolio matrix provide another method of selecting a grand strategy option. Figure 11.9 presents a model of grand strategy clusters. The growth rate of the general market and the company’s competitive position in that market define the situation of a business.
When these factors are considered simultaneously, a business can be broadly categorized in one of the four quadrants:
1. Strong competitive position in a rapidly growing market.
2. Weak position in a rapidly growing market.
3. Weak position in a slow growth market.
4. Strong position in a slow growth market
Each of these quadrants offers a set of promising possibilities for choice of a grand strategy.
Business in a strong competitive position in a rapidly growing market are in an excellent strategic position. Such businesses adopt strategy of continued concentration on their current business because consumers seem content with the firm’s current strategy and a shift from the established competitive advantage may prove to be dangerous.
However, if the resources of a business are in excess of the demands of a concentration strategy, it should consider vertical integration. Backward integration helps a business protect its profit margins by extending backward into the production of components or raw materials.
Forward integration assists a business in protecting its market share by moving forward into wholesaling and distribution toward end users. Another option in this quadrant might be to consider concentric diversification that diminishes the risks associated with narrow product or service. This strategy requires continuance of heavy investment in the company’s core business.
Firms in a weak competitive position in a rapidly growing market must seriously evaluate maintaining their existing approach to the market place.
It must determine if it is able to compete effectively and choose of the four grand strategic options:
(a) Formulation or reformulation of a concentration strategy,
(b) Horizontal integration
(c) Divestiture; or
(d) Liquidation
A business even with weak competitive position may be able to find a profitable niche in a rapidly growing market. In such a situation concentration strategy should be followed. Horizontal integration strategy is adopted if the firm is short of critical competitive element or sufficient economies of scale to achieve competitive cost efficiencies.
Divestiture eliminates a drain on resources and provides additional funds to promote other business activities. The option of liquidation is followed as a last resort when a business cannot be sold as a going concern and at best is worth only the value of its tangible assets.
The decision to liquidate is an undeniable admission of failure by a firm’s strategic management and is thus often delayed to the further detriment of the company. Strategic managers often do not favor divestment as it is likely to endanger their control of the firm. They may even lose their jobs.
Businesses in a slow growth market with a relatively weak competitive position likely to continue will reduce their resource commitment to that business. In this quadrant, retrenchment strategy will have the benefits of making resources available for other businesses, and operating efficiency of employees may increase.
An alternative strategy is concentric or conglomerate diversification that diverts resources for expansion through investment in more promising business. If an optimistic buyer can be found, then the divesture follow, otherwise liquidation is the only option.
Businesses in a slow-growth market with a strong competitive position tend to diversify into more promising growth areas. High cash flow and limited internal growth needs characterize these businesses. Concentric diversification into ventures that utilize their proven business acumen is an excellent option.
Conglomerate diversification is a second strategy that spreads investment risk and keeps focus of the managerial attention on the current business. Multinational firms are attracted to joint ventures. A joint venture enables a domestic firm acquire competitive advantages in promising new business areas while involving limited risks.
Strategic Analysis and Choice – Selection Factors Influencing Strategic Choices
Strategic choices are influenced by four managerial selection factors:
Factor # 1. Perception of External Dependence:
Business firms depend on other units that include the owners, competitors, customers, government, and community for their survival and prosperity. The more dependent a firm on these units is, the less flexible its strategic choice can be. Thus the range of strategic choices is limited. Strategic choices result from interactions of the firm with its environment. Thus strategic choices are outcomes that are negotiated as various parties maneuver to reach their objectives.
These dependencies can be objectively measured. A stockholder who controls 51 percent of the voting stock clearly has more power, and the firm is more dependent on the wishes of the majority power. But in addition to the objective phenomena there are the subjective views of the decision makers.
Facts do not speak for themselves, executives interpret them. Executives who see the firms differently can head two firms of equal power. One firm’s executives can see their firm as weak and dependent, the other as strong.
Thus the weights they put on the strategic alternatives can vary. For instance, a strategy requiring lower prices to gain market share may be rejected if managers believe that their union has the power to gain greater wages and benefits than their competitors offer. Diversification strategies are often used to reduce dependence.
Factor # 2. Managerial Attitudes toward Risk:
Another factor influencing strategic choice is how much risk the firm, its stockholders, and management can tolerate. Managerial attitudes toward risk ranges from comfort to strong risk aversion. The risk averters probably view the firm as very weak and will accept only defensive strategies with very low risks.
Risk attitudes can change, and vary by industry volatility and environmental uncertainty. In very volatile industries, executives must be capable of absorbing greater amounts of risk otherwise they cannot function.
Risk attitudes can also vary on the basis of internal conditions. These internal conditions may include. The amount of gambling on any given project and the amount of betting and the amount of loss involved. The financial strength and the past success also have an influence on the perception of risk. If you have won recently, you may see less risk in the future.
Thus the assessment of manager’s perception of risk will help in understanding the potential acceptability of a given strategic option. In so far as they influence managerial attitudes, the risk attitudes of the managers and stockholders will eliminate some strategic alternatives and highlight others.
Factor # 3. Managerial Awareness of Past Strategies:
Past strategies are the beginning point of strategic choice and may eliminate some strategic choices as a result. The beginning point of the process is the present position of the firm. From there, the initial question is, Will the continuation of our strategy lead to the expected attainment of desired objectives? To the extent that the gap is small, past strategy will be continued. And to the extent that managers are committed to continuing the strategy, other alternatives will be ignored.
The corporate cultures built up to implement the past strategy also get in the way of choosing a new strategy. A corporate culture is the “personality” of an organization. Changing a corporate culture represents new patterns of resources allocation, norms, communication, leadership, rewards, and so on.
Such changes will be needed if a new strategy diverges very far from the past one. It is often difficult and time- consuming to change corporate culture. Even the past image of the firm may make a new strategy harder to implement. So the values of management and perceptions of the firm from outside as a result of long commitments to past strategy are preventing the firm from moving rapidly into new growth areas.
Factor # 4. Managerial Power Relationships:
People know that power relationships are a key reality in organizational life. In many enterprises, if the top manager begins to advocate one alternative, the decision to choose it is soon unanimous.
Sometimes personalities get involved in the strategic choice: whom the boss likes and respects has a lot to do with which strategic choice is made. And sometimes if “mistakes” are made, the power can shift the blame to lower-level executives.
The power of the CEO plays a role, too. The manager’s personal goals, ambitions, values, and motivation can affect the choice of strategy. If the CEO is very powerful, the organization’s goals become intertwined with personal goals in the choice process.
There is no doubt that power and politics influence decisions, including strategic decisions. The significance of the decisions, the degree of time pressure, the degree of uncertainty, and the style of the decision maker influence the relative roles of analytical, political, and intuitive approaches to decision making. The external political pressures are also involved in determining the trade-offs among objectives.
It can be said that politics always plays a role, even to the extent of influencing objectives and the way the analytical approaches are used and interpreted. According to Mintzberg, politics seems to be an over-riding factor in the strategic choice process about 30 per cent of the time. Thus, it is important to analyze the values and goals of the key managers.
The strategy chosen has little chance of success unless it will be implemented effectively; it is unlikely that a politically unacceptable strategy will be carried out successfully.
The power of lower-level participants also plays a role in strategic decision-making. Of course, top managers make the strategic choices, but earlier strategic choice made by their subordinates limit the strategic choice usually considered. Subordinates can choose to hold or submit proposals for strategic change.
They can also influence the choice by providing analytical data that support their proposal. Moreover, strategies must be implemented, and lower-level managers have the power to make or break a strategy.
Decision-makers also have opportunities to select the type of environment within which they will operate. In large organizations, they have the power to influence conditions prevailing in the environments in which they are operating.
According to Child, threats and opportunities perceived in the environment, which affect strategic choice, “are functions of the power exercised by decision makers in the light of ideological values”. Hence, power constrains choices on the one hand, and expands choice opportunities on the other. The key is the perception of power and its use.
Finally, sometimes workers’ councils have an influence on strategic choices. Thus the power of “insiders” and “outsiders” can be a strong political influence on the strategic decision. Coalitions develop to influence the formation of objectives and strategies.
Factor # 5. Time Dimension and Strategic Choice:
The timing of decisions and time pressures affect the strategic decision process and the quality of the decision. The deadlines for making a strategic choice is often set not by the manager but by others. Sometimes, the strategist must make decisions in time frames set by other. In other cases, the strategist has more time to seek alternatives and choose among.
When time pressures are significant, strategist may not be able to gather enough information or consider an adequate number of alternatives. Time pressures also affect the strategic choice process itself. Finally, the desire to accomplish certain objective within specific time fame will more naturally lead to the choice of some alternative strategies.
Strategic Analysis and Choice – Selection of Strategies: Ways
The evaluation of alternative strategic options does not itself determine which strategies are to be selected for implementation.
Johnson and Scholes suggest three ways in which strategies are selected:
Way # 1. Selection against Objectives:
The first way the future strategies are selected is against the quantified objectives of the organization. ‘Evaluation methods are therefore central to the decision-making process and are expected to provide quantified ‘answers’ regarding the relative merits of various options and to indicate the ‘right’ course of action’. Sometimes objectives need to be adjusted to the strategy. It is essential for the strategist to assess that the strategic options fit specified objectives of the organization.
Way # 2. Referral to a Higher Authority:
Commonly the selection of strategies takes place by referring the matters to a higher authority. In many cases the managers responsible for evaluation of strategies may not have the authority to take final decision in the matter. Similar, the managers responsible for taking the decisions on strategies might not have participated in the evaluation process.
The way the results of evaluation are conveyed to the senior managers plays a very important role in the selection of strategies. It is likely that senior managers may not have the time or willingness to reveal the detailed information of the evaluation. ‘They are more concerned with using their judgment of the situation on the available facts, and also with seeing how different strategies will fit the overall mission of the company.’
Thus the evaluation process raises the level of debate taking place among senior managers when they are using judgment on the selection of strategy. In a multi-business diversified corporation the evaluation of strategies varies at the corporate, subsidiary, or the service departments.
Way # 3. Partial Implementation:
The final decision on a strategy may be taken by committing some resources to the partial implementation of one or more strategies that allows the organization to acquire more experiment on the ground, to improve its understanding of the suitability of each strategy and, at a later date, to make a more informed decision about strategies to pursue.
The merit of partial implementation approach is that it can usually be authorized at lower levels within the organization. However, senior managers might perceive some risks in allowing too much freedom for such unauthorized experimentation within the organization.
Strategic Analysis and Choice – Contingency Strategies
Strategists will choose to look at one set of strategic alternatives in first-generation planning a multiple set of alternatives in second-generation or contingency approaches to strategic management. In more developed strategic management, managers also prepare alternative strategies that they can consider if conditions should change. When conditions change sufficiently, consideration of the contingency strategies is triggered.
A programmed or contingency strategy is another dimension to alternative approaches to strategic choice. A programmed strategy is a strategy that is planned in such a detailed and integrated way that it is difficult to change it once it has begun to be implemented. A contingency strategy requires the planner to choose the preferred strategy given the best estimate of conditions and other strategic choices.
But it is flexible enough to allow for shifts in the thrust of the plan when conditions warrant it. In effect, programmed strategies emanate from first-generation planning, Second-generation planning leads to contingency strategy formation.
Programmed planning is suitable for stable environments with people who prefer well-defined roles. The contingency strategy is suitable for unstable environments with people who prefer variety and stimulations.
Culture and Politics of Strategy Choice:
All organizations have their own culture. Culture includes the set of shared values, beliefs, attitudes, customs, norms, personalities, heroes, and heroines that describe a firm. Culture is the unique way an organization does business. It is the human dimension that creates solidarity and meaning, and it inspires commitment and productivity in an organization when strategy changes are made.
All human beings have a basic need to make sense of the world, to feel in control, and to make meaning. When events threaten meaning, individuals react defensively. Managers and employees may even sabotage new strategies in an attempt to recapture the status quo.
Strategic management may be viewed from a cultural perspective because success often depends upon the degree of support that strategies receive from a firm’s culture. If a firm’s cultural products such as values, beliefs, rites, rituals, ceremonies, stories, symbols, language support its strategies.