
Here is a compilation of essays on ‘Foreign Trade’ for class 10, 11 and 12. Find paragraphs, long and short essays on ‘Foreign Trade’ especially written for school and college students.
Essay on Foreign Trade
Essay Contents:
- Essay on the Introduction to Foreign Trade
- Essay on the Composition of Imports in India
- Essay on the Composition of Exports in India
- Essay on the Foreign Trade in India during 2006-07
- Essay on the Recent Trends of Foreign Trade in India
Essay # 1. Introduction to Foreign Trade in India:
ADVERTISEMENTS:
During the Pre-British period, India was famous for foreign trade. Indian merchants used to export various types of manufactured articles particularly textiles and handicrafts which had been famous world-wide. With the advent of British rule, India became a colony of the British and the pattern of its foreign trade became typically colonial. During this period, India was a supplier of foodstuffs, raw materials and primary products to the industrialised nations particularly England and an importer of manufactured goods. British imposed a pattern of trade in India that was deliberately designed in their own favour and against the interest of India. This dependence on foreign countries for manufacturing did not permit industrialisation at home. Rather as a result of the competition from British Manufacturers, the indigenous handicrafts suffered a severe blow.
During the post-independence period, the colonial pattern of trade had to be changed to suit the needs of a developing country. Thus, India experienced a complete change in the composition and direction of foreign trade.
The study of foreign trade in India can be divided into two parts:
(A) Foreign Trade before Independence
ADVERTISEMENTS:
(B) Foreign Trade after Independence
A. Foreign Trade before Independence:
Study of India’s foreign trade before independence can be divided into the following parts:
1. Volume of Trade:
ADVERTISEMENTS:
Before the Second World War, India was forced to export more than its imports in order to meet the unilateral transfer of payments to Britain in the shape of salaries and pensions of British Officers, interest on sterling loans and dividends on British capital invested in India. During the Second World War, there was a basic change in the nature of India’s foreign trade. It began exporting to Britain large quantities of goods, but Britain could not export to India adequate quantities of goods in return because of its engagement in the war.
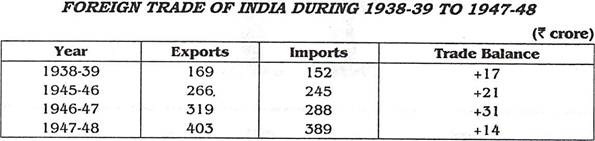
Such unrequired exports gave rise to sterling balances. Thus more exports and less imports was the feature of India’s foreign trade. In 1939, the total value of India’s foreign trade was Rs. 321 crore. Of it the value of exports was Rs. 169 crore and that of imports Rs. 152 crore. In 1947-48, total volume of trade rose to Rs. 792 crore (exports worth Rs. 403 crore and imports worth Rs. 389 crore).
The following table shows the volume of foreign trade of India during 1938-39 to 1947-48:
2. Composition of Foreign Trade:
ADVERTISEMENTS:
The composition of foreign trade underwent a change during 1938-39 to 1947-48. The raw material components of exports declined from 45% of total exports in 1938-39 to 31% in 1947-48; the share of manufactured goods improved from 30% in 1938-39 to 49% in 1947-48. India did export in the pre-war period some wheat, wheat flour, barley and pulses, but with a rapidly increasing population these exports had completely disappeared in the post-independence period.
During this period, India used to import finished consumer goods, Machines, Chemicals, Iron and Steel etc. The partition of India and its rising population meant a rapid exhaustion of food surplus and thus, food-grain imports were undertaken on a large scale. During this period, the raw material component of imports showed signs of improvement and import of manufactured goods was on decline.
3. Direction of Trade:
ADVERTISEMENTS:
Before independence, most of India’s foreign trade was with England and Common Wealth Countries. England accounted for 34% of the total exports and 31% of the total imports of India. The share of other British colonies like Burma, Canada, and Sri Lanka, etc. in our export trade was 21% and in import trade was 10%. During this period America’s share in India’s total exports was 8% and in total imports 7%. In the year 1947-48, the share of England in India’s imports fell to 25% and that of America rose to 30%. Russia and other East Europe countries contributed very little to our foreign trade.
4. Balance of Trade:
Before independence, India had a favourable balance of trade position. In 1939, balance of trade was favourable to the extent of Rs. 17 crore and in 1946-47 it was favourable to the extent of Rs. 31 crore. However, in 1947-48, the trade was favourable only to the extent of Rs. 14 crore.
It can be concluded that before independence, India’s foreign trade was organised on the basis of the policy framed by the British Government.
ADVERTISEMENTS:
B. Foreign Trade after Independence:
In the post-independence period, economic planning was launched in the country in 1951 and its foreign trade went through a great deal of transformation.
This change can be studied under the following headings:
1. Value of Foreign Trade
ADVERTISEMENTS:
2. Composition of Foreign Trade
3. Direction of Foreign Trade
1. Value of Foreign Trade:
On the eve of planning, the foreign trade of India showed an excess of imports over exports. In order to have a clear idea about the trend in the value of foreign trade in the country since the inception of planning, the value of foreign trade (value of imports plus exports) should be studied since 1950-51. As there was a devaluation of rupee in 1966, all figures of foreign trade have been transformed in post-devaluation rates to bring uniformity in the data.
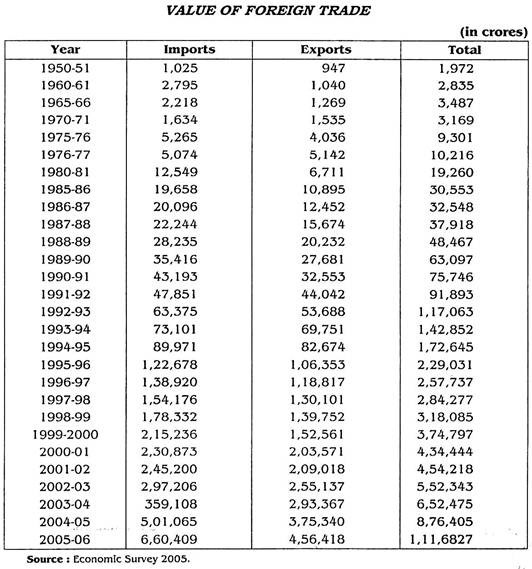
The following table shows the changes in the value of foreign trade since the first five year plan:
Salient points of trends in value of trade since independence are discussed as follows:
ADVERTISEMENTS:
i. Growing Value of Trade:
The total value of India’s foreign trade has gone up from Rs. 1972 crore in 1950-51 to Rs. 19,260 crore in 1980-81 and to Rs. 4,34,444 crore in 2000-01. Much of this increase was concentrated in the last 10 years or so. For instance, between 1951-1971, the total value of foreign trade rose by only 60.9% and during 1970-71 to 1980-81, total value of foreign trade rose by 507% i.e. by nearly 6 times. But during 1980-81 to 1990-91, total value of trade rose by 293.3% i.e. by nearly 4 times. In 2001-02, the value of trade recorded an increase of 4.55% over the previous year.
ii. Larger Growth of India’s Imports:
The value of India’s imports has been continuously rising since 1951. The total value of imports which was Rs. 1025 crore in 1950-51 rose to Rs. 43,193 crore in 1990-91. The value of imports rose to Rs. 2,45,200 crore in 2001-02 and to Rs. 6,60,409 in 2005-06.
The reasons for these large growths of imports were:
ADVERTISEMENTS:
(a) Rapid industrialisation necessitating increased imports of machinery and equipment, industrial raw materials, technical know-how etc.
(b) Control of inflationary pressure within the economy through increased imports and supply of price sensitive goods such as edible oils, cement etc.
(c) Policy of liberal imports, resulting in increase of not only essential imports but even non-essential imports like colour TVs etc.
(d) Periodic increase in crude oil prices by OPEC since 1973 is the main factor responsible for increased value of imports especially till 1979-80 and again in 1999-2000 and 2000-01.
(e) Policy of import liberalisation pursued in 1985-86 and in 1991-92.
(f) A serious factor here is that the unit value index of imports has risen much faster than the quantum index.
ADVERTISEMENTS:
iii. Inadequate Expansion of Exports:
Another very peculiar situation that India has been facing is a very slow growth in respect of its exports. The total value of exports raised from Rs. 947 crore in 1950-51, to Rs. 1535 crore in 1970-71, and Rs. 6711 crore in 1980-81 to Rs. 32,553 crore in 1990-91. In 2001-02 the value of exports rose to Rs. 2,009,018 crore and 45641.8 in 2005-06. India’s exports were almost stagnant during the first 15 years of planning. The main reason for this was that in our exports was the predominance of traditional goods such as tea, jute and cotton manufacturers, the foreign demand for which was inelastic. Besides, the rise in prices in India and the high cost of production of our export goods did not allow these goods to be competitive in the international markets.
Due to the various export promotion measures since the devaluation of rupee in 1966 the value of India’s exports recorded some increase but this increase was total inadequate considering the sizeable growth in the value of imports.
There have been many reasons why our exports did not match our import requirements:
(a) The major export items of India were till recently agriculture based and the prices of primary goods generally remained low in the international commodity markets, mainly because the demand for these goods in the developed countries was inelastic and partly due to the failure of primary goods producing countries acting together.
(b) The ever increasing domestic consumption and inadequate export surplus in certain commodities e.g. sugar, vegetables, meat etc. the demand for which has been rising.
ADVERTISEMENTS:
(c) Export promotion measures such as tax and other incentives were found inadequate. Particularly in the context of larger incentives provided even by advanced countries like Germany and Japan.
(d) The policy of protectionism adopted by advanced countries such as U.S.A preventing the full flow of exports from developing countries.
(e) Long period of business recession in recent years in most developed countries resulting in sluggish international demand.
(f) The unit value of exports has risen much more than the quantum index of exports showing that the increase in the value of exports was partly monetary.
(g) In 1980-81, exports as percentage of GDP were only 5.5%, in 1990-91 this ratio increased to 5.8% and it further improved to 8.5% in 1999-2000. However, imports which were 10.2% of GDP in 1980-81, declined to 8.8% in 1990-91 and rose further to 12.3% in 1999-2000 and 7% and 2005-06.
iv. Widening Trade Deficit:
ADVERTISEMENTS:
As a result of higher growth of imports and slow growth of exports, the country has been experiencing a widening trade deficit since 1980-81. India has recorded a small surplus of trade only in two years 1972-73 and 1976-77 and except this it has experienced deficits throughout this period. The annual average trade deficit which was Rs. 108 crore during the first plan gradually rose to Rs. 747 crore during the Third Plan. Due to import compression and boosting exports, the annual average trade deficit declined to Rs. 167 crore during the Fourth Plan. Since then, the annual average trade deficit rose from Rs. 810 crore during the Fifth Plan to Rs. 5716 crore during the Sixth Plan and to Rs. 7720 crore during the Seventh Plan. By 2001-02, the extent of trade deficit had increased to Rs. 36182 crore.
2. Composition of Foreign Trade:
Composition of foreign trade means the structural analysis involving the various types and the volume of various items of exports and imports of the country. The composition reflects the diversification and specialisation attained in the productive structure of the country along with its rate of progress and structural changes. After independence and during five year plans, there has been a good deal of change in the composition of India’s foreign trade. Goods which used to be exported from India previously e.g. food-grains, cotton etc., now is figured in its imports. On the other hand, in the exports of the country, the share of finished goods, iron and steel, engineering goods etc. has increased a lot.
Essay # 2. Composition of Imports in India:
In 1947-48, the main items of imports in India were machinery of all kinds, oils, grains, pulses and flour, cotton, vehicles, cutlery, hardware, chemicals, drugs and medicines, dyes and colours, other yarns and textile fabrics, paper, paper board and stationary, and metals other than Iron and Steel and manufactured goods. These imports together constituted more than 70% of all imports.
The initiation of the planning process in the country in 1951-52 and more specifically the beginning of the second plan in 1956-57 brought about a considerable change in the composition of imports. With the emphasis in the planning and development of basic, capital goods and engineering industries the country had to import huge quantities of capital equipment along with its spares known as maintenance imports.
The following table shows the changes in the composition of import in India since 1960-61:
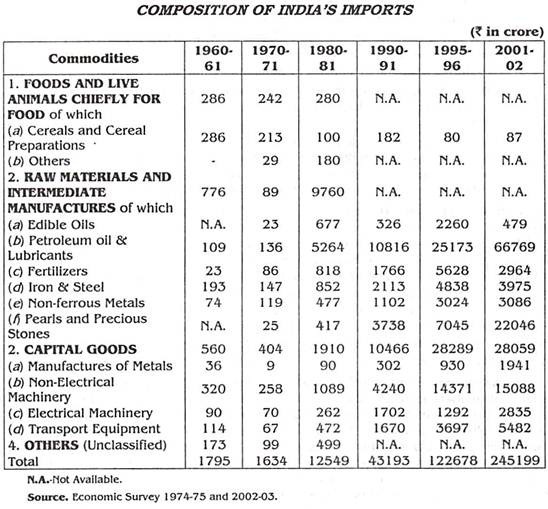
For convenience the imports have been divided into four broad groups (i) Food and live animals chiefly for food (ii) Raw-Materials and Immediate manufactures (iii) Capital goods and (iv) Other goods.
The structural changes in the imports since 1950-51 show:
(a) Rapid growth of industrialisation necessitating increase in imports of raw materials and capital goods.
(b) Growing imports of raw materials on the basis of liberalisation of imports for export promotion and
(c) Declining imports of food-grains and consumer goods due to the country becoming self-sufficient in the food-grains and other consumer goods through agricultural and industrial growth.
Important facts regarding the composition of different import items (as shown in the above table) are as follows:
(i) There has been a substantial rise in the import expenditure on Petroleum, oil and lubricants (POL) imports, Import expenditure on POL rose significantly from Rs. 136 crore in 1970-71 to Rs. 66,769 crore in 2001-02. This sharp increase was due to hikes in oil prices in 1973-74 and 1978-79, by the oil and Petroleum Exporting countries (OPEC). Official projections say that imports of POL will further go up in the coming years since the demand for petroleum products are expected to grow in future.
(ii) Imports of different type of capital goods rose significantly from Rs. 404 crore in 1970-71 to Rs. 28059 crore in 2001-02, which amounted to about 10.9% of the total imports. The increase in these imports was due to rapid industrialisation initiated during the planning period.
(iii) Due to the increasing demand of the gems and jewellery industries, the imports of pearls, precious and semi-precious stones have increased significantly. Import bill on these items rose considerably from Rs. 25 crore in 1970-71 to Rs. 22046 crore in 2001-02 and it amounted to nearly 8.9% of the total imports in 2001-02.
(iv) Due to the increasing requirement of fertilizers for the implementation of the new agricultural strategy and also due to the increasing prices of fertilizers in the international market, the import expenditure on fertilizers has also increased. Import bill on fertilizers which was Rs. 86 crore in 1970-71 rose to Rs. 2964 crore in 2001-02, which accounted for nearly 1.31% of the total imports.
(v) Despite increasing domestic production of iron and steel, substantial quantities continue to be imported as domestic production has failed to keep pace with the rising demand. Import bill on iron and steel rose considerably from Rs. 197 crore in 1960-61 to Rs. 3975 crore in 2001-02 and amounted to over 1.62% of total imports in 2001-02.
(vi) Food-grains had to be imported on a considerable scale for a number of years to meet the domestic requirements of the country. Because of increasing domestic demand the edible oil also had to be imported on a considerable scale in certain years. However, as the production increased, the imports declined.
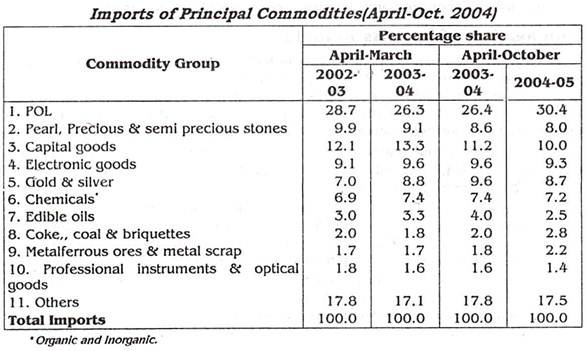
The following table shows the percentage shares of various commodities in Indian imports:
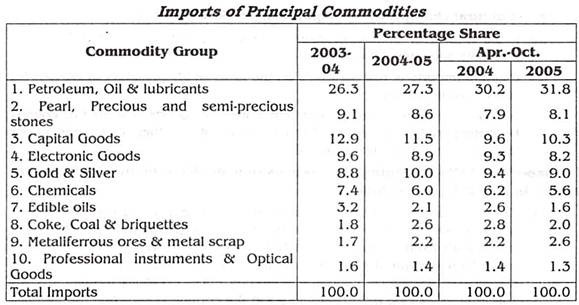
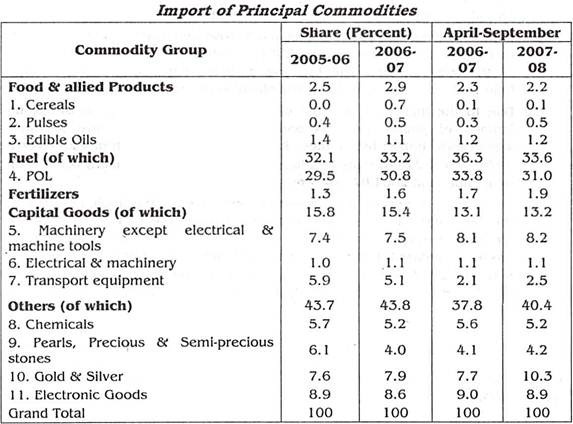
The above table shows that POL continues to be the single major item of import with its share stabilizing at 30-31 per cent level. The sharpest rise has been seen in share of capital goods imports in 2006-07 which was of about 4.9 percentage points over 2000-2001. The major decline is in import share of pearls and precious and semi-precious stones reflecting the fall in export share of gems and jewellery. Food and allied imports showed a marginal decrease due to fall in share of edible oils. The Capital goods imports increased considerably. Imports of gold and silver have been around 8 per cent though it has increased to 10 percent in the first half of 2007-08.
Essay # 3. Composition of Exports in India:
At the time of independence the three most important items in India’s export basket were Jute, tea and cotton textiles. Together these three items constituted 50% of the total exports of the country. As the industrial structure of the country got strengthened and diversified, new export opportunities opened up and the combined share of Jute, tea and cotton textiles fell to 31% in 1970-71 and further to 10% in 1998-99. As against this, the share of engineering goods which was a meager 3.4% in 1960-61 rose to 15.8% in 2001-02.
The following table shows the composition of exports in India:
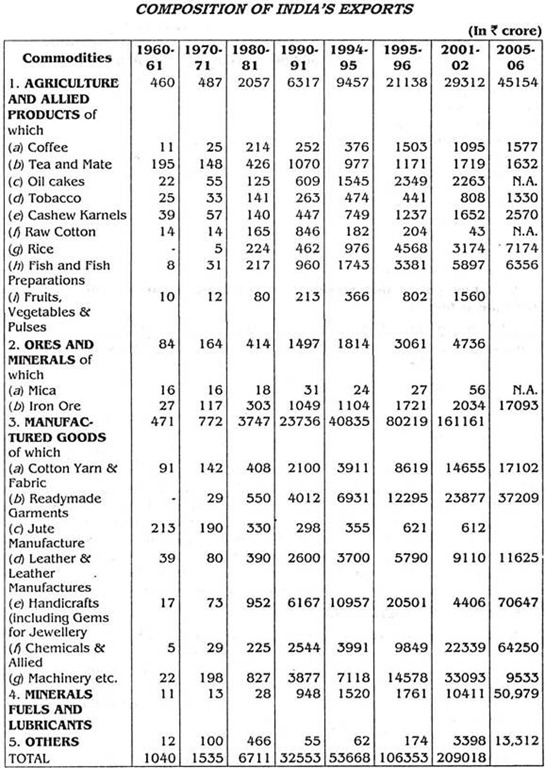
Important points that emerge from the table regarding different export items are as follows:
1. The most important export item in 1960-61 was jute and it contributed 21% of total export earnings. But its share gradually declined to 12.4% in 1970-71 and then to only 0.29% in 2001-02.
2. The second most important item in 1960-61 was tea and it contributed 19.3% of total export earnings. Its share has also declined consistently to 9.6% in 1970-71 and to 0.82% in 2001-02. During recent years it has contributed more earnings as compared to Jute.
3. The share of cotton fabrics in total export earnings of the country also declined marginally from 8.7% in 1960-61 to 6.4% in 1990-91 and to 7.01% in 2001-02.
4. As is clear from the table, the most spectacular increase has been recorded by handicrafts. The share of handicraft in export earnings of 1970-71 was just 4.7%. From there it increased to Rs. 20501 crore in 1995-96 and occupied first place in India’s total exports.
5. Exports of machinery and engineering goods rose substantially from a mere Rs. 22 crore in 1960-61 to Rs. 33093 crore in 2001-02, which constituted about 15.8% of total earnings in 2001-02. It has occupied second place after handicrafts.
6. Export of readymade garments has emerged as an important foreign exchange earner in recent years’ export earnings from ready-made garments which were just Rs. 29 crores in 1970-71, increased to Rs. 23877 crores in 2001-02. These exports constituted 11.4%, of total export earnings in 2001- 02 and occupied third place.
7. In recent years 2001-02, the exports of some other articles also increased considerably which include leather and leather manufactures (Rs. 9110 crore-5th place), chemicals and allied products (Rs. 22,339 crore-4th place), Iron ore (Rs. 2034 crore) etc.
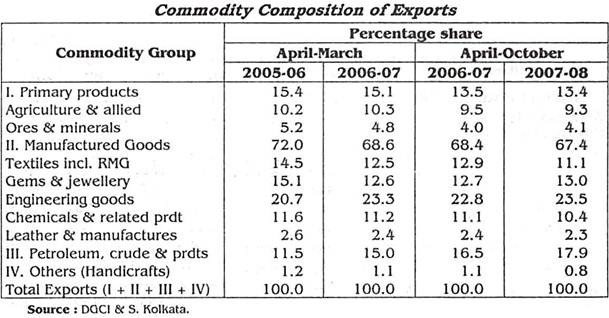
8. The exports of India have been broadly classified into five groups:
(i) Agriculture and allied products-their share changed from 31.7% in 1970-71 to 14% in 2001-02
(ii) Ores and Minerals-whose share decreased from 10.7% in 1970-71 to 2.2% in 2001-02
(iii) Manufactured goods-whose share increased from 50.2% in 1970-71 to 68.6% in 2006-07
(iv) Mineral, fuel & lubricants-whose share increased from 0.84% in 1970-71 to 4.98% in 2001- 02
(v) Others which constituted for 6.4% of exports in 1970-71 and 1.62% in 2001-02.
9. Export growth in 2006-07 was driven mainly by petroleum products.
10. The rising share in engineering goods affected India’s revival of heavy manufactures from 2005 to 2008.
The pattern of India’s exports indicates that:
(a) The Indian economy is being diversified and non-traditional items of exports are growing in importance.
(b) India is now in a position to take advantage of both favourable demand situation and attractive price situation in international markets.
(c) Consequent upon the programme of industrialisation initiated during the planning period, the exports of engineering goods rose significantly.
(d) While some commodities have tremendous exports potential (e.g. handicrafts, engineering goods and ready-mades), other (like sugar, jute, yarn and manufactures, Iron and Steel) have fluctuated widely.
(e) Emphasis is also being given to boosting the export of agricultural produce with the announcement of new agricultural policy. Rice export as well as exports of fruits, vegetables and processed foods is gaining importance in our exports.
3. Direction of India’s Foreign Trade:
In the pre-independence period, the direction of India’s foreign trade was determined by the colonial relations between India and Britain. In other words, Britain decided from which countries India could import its requirements and to which countries it could export its products. Naturally a major portion of India’s trade was either directly with Britain or its colonies or allies. This pattern continued for some years even after independence also, till India explored the possibilities of having trade relations with other countries of the world also. Now after more than 50 years of planning, the trading relations exhibit marked changes. The direction of trade has been totally diversified.
For the purposes of studying direction of trade, India’s trading partners have been divided into five major groups – OECD (Organisation of Economic Co-operation and Development Countries), OPEC (Oil and Petroleum Exporting Countries), Eastern Europe, Developing nations and others.
The following table shows the direction of India’s imports and exports:
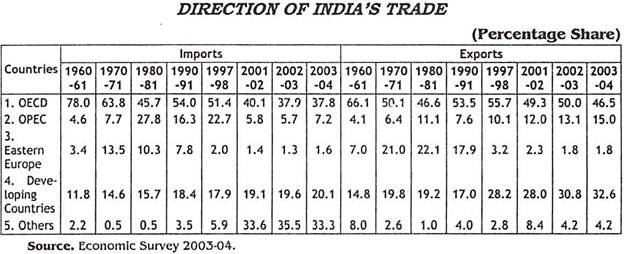
OECD includes countries of (i) European Union (EC) which include UK, Germany, Italy, France, Luxembourg, Netherland, Ireland, Belgium, Denmark etc. (ii) north America (USA and Canada) (iii) Oceania i.e. Australia, New-Zealand, Japan etc. Although the shares of OECD countries in India’s imports was all along higher, but the same gradually declined from 78% in 1960-61 to 40.1% in 2001-02. The share of exports declined from 66.1% in 1960-61 to 49.3% in 2001-02.
OPEC countries include Saudi Arabia, Iran, Iraq, Brazil etc. The share of OPEC countries in India’s imports increased from 4.6% in 1960-61 to 5.8% in 2001-02. The share of exports of these countries marginally measured from 4.1% in 1960-61 to 12% in 2001-02.
Eastern Europe countries include Russia, Poland, Hungary, Romania, Czechoslovakia etc. The share of these countries in India’s imports was only 3.4% in 1960-61 but gradually increased to 13.5% in 1970-71 but since then it gradually declined to 1.4% in 2001-02. The share of Eastern Europe countries in India’s exports increased remarkably from 7.0% in 1960-61 to 22.1% in 1980-81 and then it slowly declined to 17.9% in 1990-91 and then to 2.3% in 2001-02.
The share of developing countries in India’s imports gradually rose from 12% in 1960-61 to 18.4% in 1990-91 and stood at 19.1% in 2001-02. The share of these countries in India’s exports maintained a steady level i.e. from 14.8% in 1960-61 to 28% in 2001-02.
The share of other countries in India’s imports gradually increased from 2.0% in 1960-61 to 33.6% in 2001-02. The share of these countries in India’s exports showed a fluctuating picture. The share which was 8% in 1960-61 reduced to 1% in 1980-81, increased to 2.8% in 1997-98 and then increased to 8.4% in 2001-02.
In India’s exports EU occupies the first and USA the second place. In India’s import trade, EU occupies the first and OPEC the second place. The share of Africa and South America is only marginal in India’s foreign trade. India could cultivate trade relations with these countries-they could offer huge markets for India’s exports. Likewise the scope of India’s exports to the developing countries of the Middle East Asia is vast and in recent years, India is increasingly cultivating these markets.
Essay # 4. Foreign Trade in India during 2006-07:
(1) India’s merchandise exports and imports (in US$, on customs basis) grew by 22.6 per cent and 24.5 per cent respectively in 2006-07, recording the lowest gap between growth rates after 2002-03. Petroleum products (59.3 per cent) and engineering goods (38.1 per cent) were the fastest growing exports. The perceptible increase in share of petroleum products in total exports reflected India’s enhanced refining capacity and higher POL prices.
The rising share of engineering goods reflected improved competitiveness. The value of POL imports is increased by 30 per cent, with volume increasing by 13.8 per cent and prices by 12.1 per cent in 2006-07. Non-POL import growth at 22.2 per cent was due to the 29.4 per cent growth of gold and silver and 21.4 per cent growth of non-POL non-bullion imports needed to meet industrial demand.
(2) In the first nine months of the current year, exports reached US$ 111 billion, nearly 70 per cent of the year’s export target. During April-September 2007, the major drivers of export growth were petroleum products, engineering goods and gems and jewellery. Machinery and instruments, transport equipment and manufactures of metals have sustained the growth of engineering exports. There was a revival of the gems and jewellery sector with export growth at 20.4 per cent for April-September 2007, after a deceleration in 2006-07.
(3) Imports grew by 25.9 per cent during April-December 2007 due to non-POL imports growth of 31.9 per cent, implying strong industrial demand by the manufacturing sector and for export activity. The merchandise trade deficit in April-December 2007 at US$ 57.8 billion was very close to the trade deficit of US$ 59.4 billion for 2006-07 (full year). Despite the large overall trade deficit, there was a large (but declining) trade surplus with the United States and UAE, and a small surplus with the United Kingdom and Singapore (till 2006-07). The surplus with the first three has continued in 2007-08. The largest trade deficits are with Saudi Arabia, China and Switzerland. The trade deficit with China has increased further in April-September 2007.
(4) A comparison of the commodity-wise growth of major exports to the United States, European Union and rest of the world provides a better idea of the impact of economic slowdown and rupee appreciation. Manufactured exports to the United State decelerated sharply in 2006-07 because of demand slowdown while dollar depreciation was an additional factor in 2007-08.
The slowdown of exports to the European Union was marginal because both factors were absent. In contrast, there was a marginal acceleration in manufactured exports to the rest of the world in the first half of 2007-08. India’s exports of textiles, leather & manufactures and handicrafts to US performed poorly in 2006-07, even though the rupee depreciated marginally. However, exports of all subcategories, including engineering goods and chemicals, have decelerated in the first half of 2007-08.
In the case of EU, the sharp deceleration in textiles and poor performance in handicrafts were substantially offset by reasonable growth in other manufactures in 2006-07 and the first half of 2007-08. Leather and leather manufactured exports have performed well overall and to EU and other countries, while showing a decline in the case of United States. Thus, there seems to be a greater correlation between the demand in partner country and the bilateral exchange rate, on the one hand, and India’s bilateral exports at a disaggregated level, on the other, than is visible for total Indian exports to the world.
5. Trade with the top 12 trading partners increased by over 11.2 percentage points since 2001-02 to 53.8 per cent of total in 2006-07. The share of the United States, the largest trading partner, declined by 2.5 per cent points to 9.8 per cent in 2006-07 while China became the second largest partner in 2006-07 with its share increasing by 5.2 percentage points over the decade. China’s trade share during April-October 2007 is even higher than that of the United States by Rs. 600 crore.
6. India’s export of services grew by 32.1 per cent to US$ 76.2 billion in 2006-07. Software services, business services, financial services and communication services were the main drivers of growth. Commercial services exports were almost 60 per cent of merchandise exports in 2006-07. However, services exports grew by a disappointing 8.6 per cent in April- September 2007, due to a decline in the value of non-software services, particularly business and communication services.
7. India has continued to favour multilateral trading arrangements which are both transparent and fair to the developing, economies. After the suspension of negotiations in July 2006 due to differences in perceptions, safeguarding, the interests of low income and resources poor agricultural producers along with making real gains in services negotiations and addressing growth and development concerns in industrial tariff negotiations.
Essay # 5. Recent Trends of Foreign Trade in India:
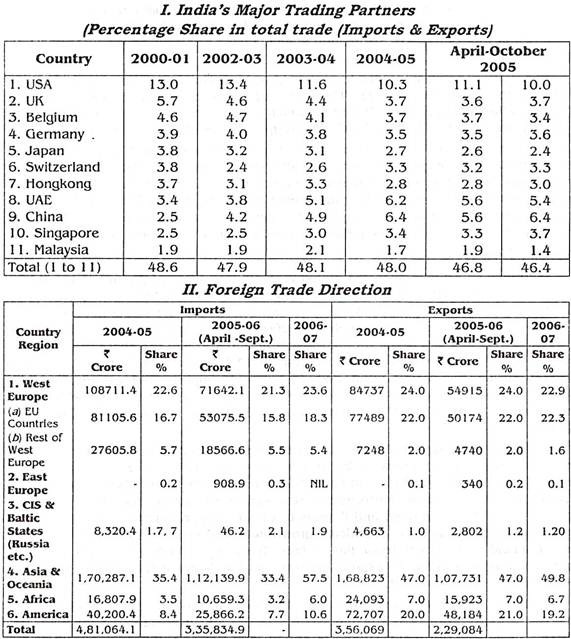
According to the data available during 2004-05, the share of the major 11 trading partners of India, accounting for a share of around 48% in India’s trade, has not changed much since 2000-01. While USA continues to be the single largest trading partner of India, its share has fallen in 2004-05 and April-October 2005. China emerged as the second major trading partner in 2005-06 and the share of combined China-Hong-Kong at 9.4% was close to that of USA. While UAE is the next major trading partner and is important both in terms of imports and exports, another important country, whose share has been increasing steadily is Singapore with whom India has recently signed a Comprehensive Economic Cooperation Agreement (CECA).
Region-wise in 2004-05, India’s exports to Asia and Oceania accounted for 47.4%. The other two major regions EU-25 and America had shares of 21.7% and 20.4% respectively. Exports to Africa and Latin American Countries were also impressive. In April-October 2005, while Performance was similar to that in 2004-05, growth of exports to EU 25 accelerated and Exports to China, Hong Kong Singapore and Korea continued to be impressive. Significant growth was also seen in trade with Sri Lanka and Thailand with which India has a Free Trade Agreement (FTA). The growing importance of Asia in India’s exports indicates that the Regional Trading Arrangements (RTA) strategy is bearing fruit.
In 2004-05, India’s imports from Asia and Oceania, accounted for 35.4% of total imports. Imports from EU 25 accounted for 16.9% and from America for 8.4%. In America, U.S. was the major source of import, and Belgium, Germany and the U.K. were the major import sources in EU 25. In Asia, import growth from major sources like China and Singapore and within SAARC, growth in imports from Sri Lanka and Pakistan were impressive.
In April-October 2005, there was an acceleration of growth in imports from Asia and Oceania and from America continued to be impressive despite moderation. While the country-wise performance was almost similar to that in 2004-05, within SAARC, besides Sri Lanka and Pakistan, imports from Bangladesh witnessed an impressive rebound in growth.
The following tables show the direction of India’s foreign trade country-wise and region-wise:
According to WTO (World Trade Organisation) report, world export growth rate during 2002 has declined to 4% but Indian exports registered the third highest growth rate of 14% in the world after China (22%) and Czech Republic (15%).
Reports and that India ranked 30th in merchandise exports and improved its rank to 24th in imports.
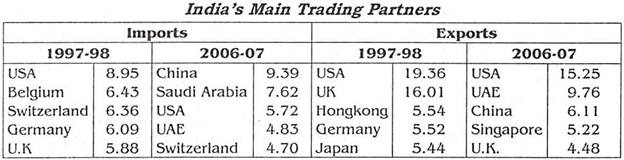
The number above refers to the country’s share in total Indian imports and exports.