
Master guide for learning about the modern and traditional techniques of controlling in management!
These techniques of control are being used by managers since long and, therefore, known as traditional techniques.
1. Personal Observation:
The simplest way to control organisational activities is that managers take round at the work place and observe the progress of the work. Any defect in performance can be spotted and corrected immediately. A face-to-face interaction is possible where workers get their doubts solved on-the-job and guidance and counselling can also be provided there and then.
This method creates psychological pressure on the employees and they perform better when they know they are being observed by their superiors. Managers can also know the behavioural, technical and psychological problems that workers are facing at the work place and they try to overcome these problems.
ADVERTISEMENTS:
However, this method demotivates the employees who work under psychological pressure of being constantly watched. This method is also not suitable for large-scale organisations where managers cannot spend time in personally observing the performance of each worker.
Small, medium-sized and non-profit organisations can be benefited more by this technique of control than large-sized, profit-making organisations.
2. Budgeting:
A budget is a statement which reflects future incomes, expenditures and profits that can be earned by a firm. It is a future projection of the firm’s financial position. Non-financial aspects like units produced, units sold, unit cost of material and labour etc. can also be important components of a budget.
Budget is “the process of stating in quantitative terms, planned organisational activities for a given period of time.” Budgeting control refers to comparison of actual performance with planned or budgeted performance. It is a basic technique of control and is used at every level of organisation. Budgets are prepared for the organisation as a whole and for each departmental unit.
ADVERTISEMENTS:
3. Break-Even Analysis:
Break-even analysis or cost-volume-profit analysis defines the relationship between sales volume, costs and profits to arrive at a figure of sales at which sales revenue is equal to cost. The point at which sales revenue is equal to cost (fixed cost plus variable cost) is the break-even point.
Sales beyond the break-even point will earn profits for the organisation and sales below the break-even point is a situation of loss.
As a technique of control, managers compare actual output with the break-even point of sales and if they are not able to sell beyond this point, they should improve their performance by increasing the sales or reducing the costs.
ADVERTISEMENTS:
The break-even point can be diagrammatically depicted as follows:
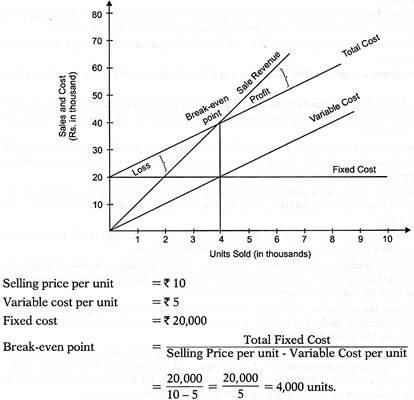
At 4,000 units, the firm is indifferent to profits and losses (sales = cost, it is a no profit, no loss situation). If the firm sells more than 4,000 units, it will earn profits and if sales are less than 4,000 units, it will incur losses. As a controlling device, managers must perform at a level where they can sell at least 4,000 units.
Advantages of Break-Even Analysis:
ADVERTISEMENTS:
i. Managers can find estimates of profit and loss at different levels of output and improve their performance to reach the break-even sales.
ii. If managers cannot sell the break-even output, the break-even analysis decides to delete the product. Similarly, managers can add products which are profitable.
iii. As costs are divided into fixed and variable costs, managers can focus on variable costs and reduce them to the extent possible.
Limitations of Break-Even Analysis:
ADVERTISEMENTS:
i. This technique assumes variable cost and selling price to remain constant for different levels of output. It does not always hold true. Increase in variable cost may be more or less than the proportionate increase in selling price.
ii. Fixed costs also do not remain constant. These costs may increase after a specified level of output. For example, for output upto 20,000 units, fixed costs may remain constant at Rs. 20,000. For output levels beyond 20,000 and upto 40,000 units, it may rise to Rs.25, 000 and for output range of 40,000 to 60,000 units; it may rise to Rs.30, 000. These are known as step-up costs and increase with increase in output. Such costs are not considered in the break-even analysis.
iii. Some costs cannot be divided into fixed and variable costs and to that extent, do not form part of the break-even analysis.
4. Financial Statements:
Financial statements depict financial position of the firm over a period of time, generally one year.
ADVERTISEMENTS:
The statements are prepared along with last year’s statements so that firm can compare present performance with last year’s performance and take action to improve its future performance. As these statements are prepared at the end of the financial year, as a measure of control, they guide managers to improve future performance.
These statements provide information on the following aspects:
1. Liquidity – The firm can know how much cash it has to meet its financial liabilities.
2. Financial strength – It represents assets, liabilities and equity position of the firm.
ADVERTISEMENTS:
3. Profitability – The excess of revenue over cost represents profit of the firm.
Two most commonly used financial statements are:
(i) Balance Sheets, and
(ii) Income Statements.
i. Balance Sheet:
It is the statement of financial position at a point of time, usually March 31. Balance sheet describes the company’s assets, liabilities and owner’s equity.
ADVERTISEMENTS:
Assets = Liabilities (+) Equity.
(a) Assets – Assets are the resources owned by the enterprise.
There can be two type of assets:
(i) Current assets – These are the cash and near-cash assets which can be converted into cash within a short period of time, usually one year. Cash, accounts receivable, debtors and inventory are the common current assets.
(ii) Fixed assets – These assets have a life span of more than one year. Fixed assets are plant and machinery, building, land, patents, goodwill etc.
(b) Liabilities are the claims that outsiders have against the assets of the company.
ADVERTISEMENTS:
These can also be divided into two groups:
(i) Current liabilities – These claims are paid by the company within a short period of time, usually one year. Bills payable, creditors and unpaid taxes are some of the current liabilities.
(ii) Long-term liabilities – These debts are repaid by the firm over a long period of time, usually more than one year, for example, bonds and debentures.
(c) Net worth or owner’s equity – These are the claims of owners against company’s assets. Net worth is the difference between assets and liabilities.
ii. Income Statement:
While balance sheet depicts financial position of the firm at a point of time (March 31), income statement depicts the financial performance over a period of time (financial year – from April to March). It is a statement of company’s revenues and expenses.
ADVERTISEMENTS:
Revenues are the inflows of cash, for example, sales, interest received etc.
Expenses are the outflows incurred to earn the revenues, for example, purchase of raw material, payment of taxes etc.
Difference between revenues and expenses is profit (revenues > expenses) or loss (revenue < expenses).
Current year’s statements are compared with last year’s statements and change in the profit or loss serves as the basis for controlling future performance.
5. Statistical Data and Reports:
Data helps in applying statistical techniques of averages, regression, correlation etc. to predict financial performance. Data can be used for diagrammatic representations like trend charts, histograms, pie charts, and bar graphs etc. which assess the company’s performance. Deviations can be pointed out and corrected.
Report is a statement that represents data in the form of information for carrying out the controlling function.
ADVERTISEMENTS:
Statistical data and regular reporting system provide information about company’s financial and non-financial performance. A supervisor, for example, prepares a special report on how the salesmen are dealing with customers. This report helps managers to control the behavioural attitudes of salesmen to develop a good clientele.
Modern Techniques of Control:
In addition to traditional techniques of control which are still being practised by managers, some of the modern techniques of control are discussed below:
1. Management Information System (MIS):
To carry out managerial functions of planning through controlling for various functional areas (production, marketing etc.) and integrate them with the external environment (Government, customers etc.), managers need different types of information (quantitative and qualitative).
Earlier, this information was provided by the accounting system which was limited and quantitative in nature. With computers, managers have access to huge quantity of data at very high speed. Computers help to create the data base and manipulate the information as desired for taking various managerial decisions. It helps in storage and retrieval of information. Computers enable managers to collect data at very short intervals of time, process, analyse, convert it into useful information and relate it to the external environment.
This system of obtaining timely, relevant and accurate information based on computer technology is known as management information system. The system helps managers in preparing reports for effectively carrying out planning and controlling functions.
Different authors define MIS as follows:
ADVERTISEMENTS:
“MIS is a formal method of making available to management the accurate and timely information necessary to facilitate the decision-making process and enable the organisation’s planning, control and operational functions to be carried out effectively.” — Stoner and Wankel
“MIS is a formal system of gathering, integrating, comparing, analysing and dispersing information internal and external to the enterprise in a timely, effective and efficient manner” — Weihrich and Koontz
“MIS is a system that gathers comprehensive data, organises and summarises it in a form valuable to managers, and provides those managers with the information they need to do their work.” — R.W. Griffin
A well-designed MIS provides information related to factors internal and external to the organisation. Internal information relates to various functional areas and external information relates to competitors, customers, suppliers, Government, debtors, creditors, etc.
Effective management information system has the following features:
a. Timeliness – Managers need upto date and timely information to make decisions. On-line transactions have made it possible for managers to access latest information with respect to different functional areas.
b. Accuracy – Not only should information be provided on time, it must also be accurate. Wrong information will lead to wrong decisions. MIS helps in providing accurate information.
c. Relevance – MIS has access to huge data with respect to business activities. Data relevant to the decision-making process is picked up by managers and the rest is left out.
d. Concise – The data is related only to the area or activity with respect to which decisions have to be made.
e. Completeness – While picking up the data, managers collect information relevant for solving the business problems.
It is clear that MIS plays important role in decision-making. It provides timely, accurate, useful and relevant information for carrying out planning, organising, staffing, directing and controlling functions and making decisions relevant for each of these functions.
2. Management Audit:
Audit means periodic inspection of financial statements and verifying that the statements are honestly and fairly prepared according to accounting principles. An audit, thus, provides a basis for control.
Two types of audit can be conducted by a firm:
(a) External audit
(b) Internal audit
(a) External Audit:
It refers to verification of financial statements. Company’s assets, liabilities and capital accounts are checked and deviations are reported to managers for future action. Control is, thus, facilitated through verification of accounts against the standard principles. This audit is known as financial audit.
External audit checks fraudulent practices in preparing financial accounts so that outside parties like investors, bankers and financial institutions enter into fair and honest dealings with the firm.
External audit is conducted by people external to the organisations. Certified Public Accountants or Chartered Accountants conduct this audit for the firms.
The Institute of Chartered Accountants of India defines auditing as “a systematic and independent examination of data, statements, records, operations and performances (financial or otherwise) of an enterprise for a stated purpose. In any auditing situation the auditor perceives and recognises the propositions before him for examination, collects evidence, evaluates the same and on this basis formulates his judgment which is communicated through his report.”
Since external audit is conducted at the end of the financial year when accounts have already been prepared, it serves as a method to control future actions. Current operations of the firm cannot be controlled by managers. This limitation of external audit is overcome through internal audit.
(b) Internal Audit:
It refers to verification of various statistical data and reports so that correct and fair presentation of financial statements is made. It evaluates the firm’s internal operations, determines where things have gone wrong and where corrective action is needed. It examines the efficiency with which the firm utilises its assets and carries its operations in the light of environmental factors. This audit is conducted by members internal to the organisation. These members may belong to the department of finance or there may be a separate internal auditing staff (in case of large-sized organisations).
A.E. Mackay suggested that the internal team for carrying out management audit should comprise of managers from the following organisational areas —(i) Operations management, (ii) Financial management, (iii) Internal auditing, (iv) Electronic data processing systems management, and (v) The Board of Directors.
Internal audit verifies the efficiency with which managers run an enterprise and, therefore, it is more appropriately termed as management audit. “It aims at evaluating the quality of management and the quality of managing as a system.” It assesses the organisation’s objectives, policies, plans and managerial efficiency (planning, organising, directing & controlling). It reviews the past and present policies of the company and points out deviations and suggests ways to check the deviations. Management audit is, therefore, evaluation of managers and of the enterprise as a whole.
John Crowhurst defines management audit as, “the comprehensive examination of an enterprise to appraise its organisational structure, policies and procedures in order to determine whether sound management exists at all levels, ensuring effective relationship with the outside world (i.e., shareholders, suppliers, customers, the community in general) and internal efficiency.”
3. Responsibility Accounting:
It divides the organisation into smaller units where each unit is headed by a manager who is responsible for achieving the targets of his unit. These units are called responsibility centres and the head of each responsibility centre is responsible for controlling the activities of his centre. Performance of each responsibility centre is judged by the extent to which targets of that centre are achieved.
There are four major types of responsibility centres:
a. Cost centres – These centres aim to achieve their goals within the cost constraints. Various direct (raw material, labour etc.) and indirect costs (research and development expenses) are determined and the centre head limits his expenses within the budgeted expenses or costs.
b. Revenue centre – The revenue is estimated and expressed in monetary terms and actual sales figures are compared with budgeted figures. This determines the efficiency of the revenue centre. Corrective action is taken if estimated revenue is not achieved.
c. Profit centre – This centre has the responsibility of earning desired amount of profits. Profit is the difference between revenues and costs. These centres can be divisions, departments or the organisation as a whole.
d. Investment centre – Profits depend upon efficient use of assets. Investment centres invest in assets which generate maximum revenue and profits for the enterprise. Efficiency of the investment centres is judged through the returns they earn on investments.
4. Network Techniques (PERT and CPM):
When a complex project is undertaken which involves a series of inter-related or inter-dependent activities, the network models or techniques help in planning, coordinating and controlling the network of activities. Various sequences of activities are scheduled with reference to time and cost and managers execute the project within the constraints of time and cost.
Two commonly used techniques that help in execution of complex project are:
a. PERT – Programme Evaluation and Review Technique developed initially for the US Navy special projects.
b. CPM – Critical Path Method developed by researchers of DU Pont Company and computer specialists from Remington Rand Company.
a. PERT-Programme Evaluation and Review Technique:
PERT is also called time-event network. It is a technique used to plan and control a complex project that is represented as a network of events and activities, with time estimates given to complete each activity.
It is a network of events and activities on a project with estimated time for completion of each activity.
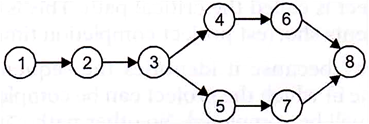
An event is the beginning or the ending of the activity. It is represented by a circle in the network. An event by itself does not use time or resources.
An activity is the time taken by an operation between two events. It represents time taken to complete an event. It is represented by an arrow.
A simple network of events and activities appears like this –
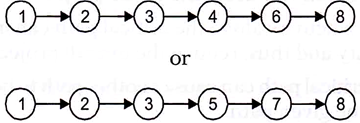
The project can be completed in the following two sequences of events and activities –
After developing the network, managers focus on time estimates to complete each activity.
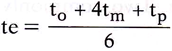
The expected time taken by each activity depends upon three time estimates:
a. Optimistic time (to) – It is the time taken to complete an activity when everything goes well, as expected. It accounts for no disruptions.
b. Most likely time (tm) – It is the time that is normally taken to complete an activity. It is the realistic time taken for completing an activity. It accounts for reasonable amount of disruptions.
c. Pessimistic time (tp) – It is the opposite of optimistic time and specifies the time taken to complete the activity if nothing goes well.
Expected time (te) to complete each activity is computed as follows –
Expected time taken to complete each activity is written below the activity or the arrow. The network with three time estimates (appearing above the arrow) and the expected time (appearing below the arrow) appears as follows –
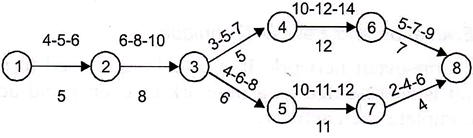
(Time may be in weeks, days, months or any other time parameter)
Expected time taken to complete the project, depending on two sequences of activities is –

While one sequence of activities takes say, 37 weeks to complete the project, the other sequence takes 34 weeks. The sequence of events and activities that takes the longest time to complete the project is called the critical path. This is the longest path through the network which represents shortest project completion time.
This path is called ‘critical’ because it identifies the sequence of activities that will determine the shortest time in which the project can be completed. This is the minimum time in which the project will be completed. No other path can complete the project in lesser time than this.
The critical path requires attention because:
1. Any delay along this path will delay the entire project.
2. Special study of each activity along the critical path can introduce ways to reduce time for each activity and thus, reduce the overall project time.
3. Planning along the critical path can cause another path to become critical by spotting the bottlenecks in the given path.
The critical path is the longest duration path through the network. Activities that lie on critical path cannot be delayed without delaying the project. Critical path analysis is an important aspect of project planning because of its impact on the entire project.
Slack time is the time between the earliest and latest start time for an activity or between the earliest and latest finish time for an activity. It is the amount of time by which an activity can be delayed without delaying the project. Since slack time for critical path is zero, it represents the shortest time during which the project must be completed.
Managers must focus on the critical path. Delay in completion of any activity along the critical path by one week will delay the whole project by one week. The critical path in this case has to be shortened if the project is to be completed before the time specified on critical path.
This can be done by:
1. Reducing the expected time for any of the activities,
2. Transferring resources from other paths to the critical path,
3. Deleting some of the activities on the critical path, if possible.
The purpose of PERT is to reduce completion time of the project in order to avoid risk of delay in its completion.
b. CPM – Critical Path Method:
CPM determines critical activities for completing the project, assumes expected time as the time taken to complete the project and concentrates on this critical sequence of activities to optimise the use of time and resources. It concentrates only on the critical path and not the whole project.
CPM also plans and controls various sequences of events and activities similar to PERT with the difference that:
1. PERT specifies the expected time for completing various activities based on three time estimates, CPM gives one time estimate for completing each activity.
2. PERT identifies only time estimates but CPM identifies both time and cost estimates. PERT is, therefore, used where time factor for completion of project is important but CPM is used where both time and costs have to be considered.
3. PERT deals with projects where activities are non-recurring in nature, CPM is used where standard activities are performed for completing the project, that is, where time for completion of activities is known.
The PERT/CPM techniques of control have the following merits:
a. It enables managers to plan the time and cost estimates to complete a complex project.
b. Primary focus is on the critical path which will help managers in timely completion of the project. If managers feel that critical path is taking longer than the estimated (or standard) time, they can direct resources from other paths to the critical path. It, thus, facilitates control by exception.
c. It enables managers to find deviations at the point of occurrence and take timely action to correct them.
d. It improves communication in the organisation as people performing different events constantly interact with each other.
e. These techniques are important in projects where time is the important factor. Delay in completion of the project by even one day involves huge fixed costs and may attract penalties for non-completion of the project in time.
f. Since time and cost schedules are determined for each activity, there is optimum allocation of scarce organisational resources.
g. It is more of a feed-forward controlling device than a feedback technique of control. It helps managers in anticipating problems and plan for them in the current plans.
Limitations of the Network Techniques:
a. These techniques are time-consuming and, therefore, a thorough cost-benefit analysis should be done before applying them.
b. They are based on estimates of time and cost. If these estimates go wrong, entire planning will go wrong.
c. Time and cost factors are the main focus of attention. Other factors that affect efficient completion of the project are not considered.
Proper planning and analysis of events and activities (network) enables managers to benefit by these techniques.
5. Balanced Score Card:
Balanced score card is “a performance measurement tool that looks at four areas — financial, customer, internal processes and people/innovation/growth assets — that contribute to a company’s performance.” It evaluates organisational performance in terms of financial and non-financial parameters. It is a performance appraisal and reporting system that maintains balance between financial and non-financial measures. It links performance to rewards and recognises the diversity of organisational goals.
It presents financial and non-financial measures to evaluate the firm’s long-run and short- run performance in a single report. Managers develop goals in these four areas and take steps to achieve these goals. For example, sales growth or return on investment (ROI) can be used as measures of financial performance; sales from new products can be used as measures of customer goals. Managers focus on all these areas as they collectively account for organisational success.
They maintain balance amongst goals in all these areas Emphasis on financial performance disregarding customer satisfaction or developing a score card around customer satisfaction ignoring finance and internal processes will not ensure organisational success. However, depending upon strengths of the organisation where it has competitive advantage, it can develop a score card around its major focus area (say, customer satisfaction).
Other areas (financial, internal processes and people/innovation/growth) will support the main focus area. Score cards reflect strategies of organisations around which resources are centered. It focuses on areas which provide value to customers through product development and equality operations besides profits for organisations.
A balanced score card (emphasis on four areas) described the strategies of IBM Global Services in Houston as follows:
“The internal processes part of our business is directly related to responding to our customers in a timely manner, and the learning and innovation aspect is critical for us since what we’re selling to our customers above all is our expertise. Of course, how successful we are with those things will affect our financial component.”
6. Ratio Analysis:
Financial statements show financial performance in absolute figures. The statements, for example, may represent profit of Rs.50 lakh or Rs.40 lakh for a year. The figure of profit has no meaning unless it is related to capital employed by the firm. Profit of Rs.50 lakh may have been earned over a capital base of Rs.1 crore giving a return of 50% while Rs.40 lakh may have been earned on a capital base of Rs.60 lakh giving a return of 66.796.
Though the figure of Rs.50 lakh looks more attractive, it is not actually so. Ratio is a numerical relationship between two numbers. Ratio analysis draws comparison between selected items from the financial statements in percentages or fractions and assesses financial performance of the firm.
Use of Ratios:
Ratio analysis has the following uses:
1. Ratios can be used to compare current performance of the company with its past performance. Performance over a period of time in a year can also be compared. This helps managers in making predictions. A fall in the profit ratio, for example, requires managers to take corrective action.
2. Ratios of a company can be compared with ratios of other firms in the same industry. Comparing performance with other companies helps in assessing its market standing.
3. Ratios help in taking corrective action by setting standards of performance for sales, profits etc. If these standards are not met, it requires corrective action by managers.
4. Ratios help in delegation and decentralisation of authority by defining a target rate of return for departmental performance. Departmental heads compare their performance with the standard rate of return.
5. Ratios help in financial decision-making. They provide important information to stakeholders for determining their interest in the company. Profitability ratios, for example, help shareholders in deciding whether to retain or sell their shareholding in the company. Banks and financial institutions assess liquidity ratios to find company’s financial strength and ability to repay the loans. Long-term creditors are interested in solvency conditions or leverage ratios.
6. Ratios optimise the use of capital and other resources. They help in knowing whether or not capital is providing fair return to owners and other stakeholders. This promotes efficiency of the firms.
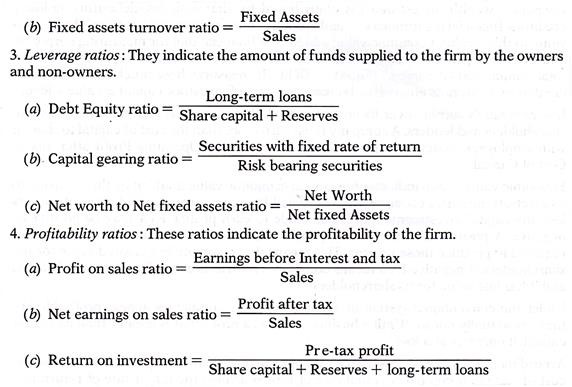
Some of the important financial ratios are given below. Their detailed analysis is, however, not made.
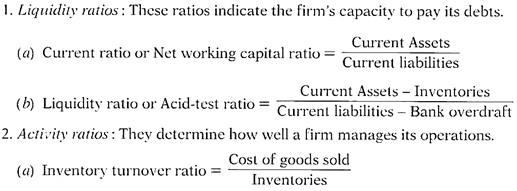
Limitations of Ratio Analysis:
Ratio analysis suffers from the following drawbacks:
1. Use of ratios does not indicate optimum use of capital resource.
2. Ratios help in intra-firm and inter-firm comparison but do not provide a standard rate of return against which performance can be measured.
3. Figures used in measuring certain ratios, for example, return on investment, do not reflect their true values as prices change over time.
4. Different firms adopt different ways of computing depreciation or inventory. Inter-firm comparison in such cases does not reflect true picture of their performance.
7. Economic Value Added (EVA):
Value added is an important tool to measure financial performance of a company. It indicates net wealth or value created by the company. Its major goal is to maximise shareholders’ wealth. Companies must generate wealth to survive and grow. A company may survive without profits in the short-run but it cannot survive without adding value to its wealth. It covers financial management functions that result in wealth creation.
Value added is a better measure of corporate performance than traditional financial accounting measures. Anything that has utility and provides satisfaction to a person has value for him. Value added is “the wealth created by the reporting entity by its own and its employees’ efforts and comprises salaries and wages, fringe benefits, interest, dividend, tax, depreciation and net profits (retained).”
Corporate wealth (investment) is contributed by shareholders, debenture holders, creditors, financial institutions etc. and it is necessary for corporate survival that it adds value to this wealth. Economic value added is “a financial tool for measuring corporate and divisional performance calculated by taking after-tax operating profit minus the total annual cost of capital.” (Equity + Debt). It measures how much value has been created by a business enterprise. Increase in value of investors’ capital is value added.
It is company’s surplus over its cost of capital, that is, surplus income after paying to shareholders and lenders. A company must earn more than the cost of capital to share it with employees, management and shareholders. EVA = Operating Profit after Tax (–) Cost of Capital.
Economic value added indicates how much economic value is added by the company to its assets. It measures economic value created by a company over and above its profits less any capital investments that it has made to earn profits. EVA may be positive or negative. A positive EVA means company’s returns are more than the cost of funds required to produce those returns. This means that company has created value for the shareholders. A negative EVA means company’s returns are less than the cost of capital and it has lost value for its shareholders.
Under the conventional system of accounting many companies appear profitable but they are actually not so. “Until a business returns a profit that is greater than its cost of capital, it operates at a loss.”
According to EVA, managers earn a rate of return on their assets (or capital) above the cost of capital. It compares actual rate of return against the target rate of return and measures its true economic profit.
Rate of return is the rate that company earns on investment and cost of capital is the minimum rate that a firm must earn on investment for its market value to remain unchanged. It is the rate paid by the company to investors. It is the discount rate that determines the present value of estimated future cash proceeds and helps in deciding whether or not a project is worth undertaking. EVA is closely related to Net Present Value (NPV) approach. If operations and assets of the organisation earn less than the cost of capital, they are abandoned.
As a performance tool, companies can improve EVA by earning more profit without using more capital or using less capital, or by investing capital in high-return projects, that is projects whose return are more than the cost of capital. It describes whether a business optimally utilises its assets to generate return and maximise shareholders’ value.
EVA is the tool that measures corporate real profitability. CEO of Coca Cola asserted – “We raise capital to make concentrate and sell it at an operating profit. Then pay the cost of capital, shareholders pocket the difference.”
Merits of EVA:
EVA has the following merits:
1. It maximises the return of company over and above its cost of capital. The focus is, thus, on stakeholders (management or employees) and not owners (shareholders) only.
2. It attempts to optimise the capital structure by minimising its cost of capital.
3. It is an incentive tool for employees to improve organisational performance as they share surplus profits of the company.
4. It optimises the use of capital by investing it in investment outlets that provide maximum returns. The aim is to maximise the difference between return on capital and cost of capital.
8. Market Value Added (MVA):
Market value added is “a financial tool that measures the stock market’s estimate of the value of a firm’s past and expected investment projects.” Thus, it measures market value of the firm’s stock. If company’s market value is more than the capital invested (share capital, debentures and retained earnings), the company will have positive MVA. It means managers have created wealth. If, on the other hand, market value is less than capital invested in the firm, MVA will be negative which means managers have destroyed wealth.
MVA is the difference between market value of capital less book value of capital. Capital does not include debt as debt is not traded in stock market. It is more appropriately defined as difference between market capitalisation and net worth. Market capitalisation is closing share price multiplied by number of outstanding shares on the date of balance sheet and net worth is equity share capital plus reserves and surplus minus accumulated losses and miscellaneous expenditure.
A firm that reports positive EVA for a number of years will have high MVA.
MVA and EVA are modern financial control measures that monitor and measure organisational performance. They are fast replacing traditional financial ratio measures such as return on investment.