
Compilation of answers on the methods, techniques and tools of controlling used in an organisation. This article will guide you to learn about: 1. What Is Controlling In Management 2. Process Of Controlling In Management 3. Importance Of Controlling 4. Nature Of Controlling 5. Example Of Controlling In Management 6. Types Of Controlling 7. Need Of Controlling In Management 8. Purpose Of Controlling.
Answer 1. Methods and Techniques of Controlling:
There are many controlling techniques which were also commonly known as controlling aids.
ADVERTISEMENTS:
Generally these controlling techniques can be categorized into two types i.e., Traditional Techniques and Modern Techniques. Now in this article we can concentrate on both the techniques in detail. So that one can understand them well and can practice well in their organizations to achieve their predetermined objectives.
1. Traditional Control Techniques:
The essence of control function is to confirm whether the actions are going according to plans or not. If they are not accordance with the plans then management should take a corrective action to overcome such deviations. For this purpose management should determine standards so that they can easily be compared with them.
For this purpose many techniques have been developed. Among them traditional such as Budgeting and Budgetary Control, Cost Control, Production Planning and Control, Inventory Control etc. are the best examples. Though modern techniques have been developed to improve the quality of controlling process but still today these techniques are being used extensively in the organizations.
Now these techniques can be studied in detail in the following paragraphs:
ADVERTISEMENTS:
I. Budgeting and Budgetary Control:
Budgeting:
A widely used tool for management control is budget. It is a quantitative expression of plan of action. It refers to the plan of an organization expressed in financial terms. It determines financial estimations relating to various activities of an organization for a fixed period of controlling actual performance.
The following are the important definitions of a budget:
ADVERTISEMENTS:
“A budget is pre-determined statement of management policy during a given period provided a standard for comparison with the results actually achieved”. — J. L. Brown & L.R. Howard
“A budget is a financial or quantitative statement prepared prior to a defined period of time of the policy to be pursued during that period for the purpose attaining a given objective”.— I. C. W. A England
From the above definitions the following characteristics can be summarized:
(1) A budget generally relates to a given future period
ADVERTISEMENTS:
(2) It differs from objectives or policies because it is set down in specific numerical terms
(3) It should be flexible
(4) It is fundamental to the organization and hence, it receives the attentions and support of the top management.
Importance of Budgeting:
ADVERTISEMENTS:
(1) Budgeting involves drawing up budgets based on well-defined plans of action.
(2) It serves another important purpose i.e., coordinating plans and activities of various departments and sections.
(3) It facilitate control over expenses, income, costs and profits.
Types of Budget:
ADVERTISEMENTS:
There are many types of Budgets which are generally used in an organization.
They are:
(i) Sales budget – It represents the plan of sales for a given period.
(ii) Purchase budget – It presents the quantities of raw materials and other consumable items to be purchased by a manufacturing company.
ADVERTISEMENTS:
(iii) Cash budget – It is a statement of the anticipated receipts and payments for a given period along with the resulting surplus or deficit.
(iv) Expense budget – It lays down the estimates of the standard or norm of operating expenses of an enterprise for a given period.
(v) Capital budget – This type of budget outlines the anticipated expenditure on plant, machinery, equipment and other items of a capital nature.
(vi) Revenue budget – It indicates the income or revenue expected to be earned from sale of goods produced or purchased for re-sale.
(vii) Production budget – It shows the volume of production to be undertaken for a given period together with the material, labour and machinery requirements sometimes production budgets also show the anticipated cost of production.
(viii) Labour budget – It indicates the types of skills of labourers and the numbers in each category estimated to be required in a given period along with the standard wages payable.
ADVERTISEMENTS:
(ix) Master budget – This is prepared for the whole enterprise by compiling the different sectional budgets which is finally adopted and worked upon.
Budgetary Control:
It is the process of preparing various budgeted figures for the organization for the future period and then comparing with the actual performance for finding out variances. This enables management to find out deviations and take corrective measures at a proper time. Hence, a budget is a means and budgetary control is the end result.
The following two definitions are important definitions of budgetary control:
(1) “Budgetary control is system which uses budget as a means of planning and controlling all aspects of producing and or selling commodities or services”.
(2) “Budgetary control is the planning in advance of the various functions of business so that the business as a whole can be controlled”.
ADVERTISEMENTS:
From the above two definitions, the following characteristics of budgetary control can be extracted:
(1) It implies the planning of activities for each department.
(2) It involves recording of actual performance for sake of comparison and control.
(3) It involves taking the necessary steps to improve the situation and to prevent further deviations.
(4) It involves the co-ordination among various department plans and budgets.
Advantages:
ADVERTISEMENTS:
(1) The budgetary control aims at the maximization of profits of an organization.
(2) It provides the management with a means of control over planned programmes.
(3) It facilitates co-ordination among various activities of an organization.
(4) Wastage is minimized and hence efficiency can be achieved.
(5) Budgetary control enables the introduction of incentives schemes of remuneration.
(6) It creates consciousness among the employees.
ADVERTISEMENTS:
(7) The national resources will be used economically and wastage will be eliminated.
(8) It provides an effective means by which top management can delegate authority and responsibility without disturbing overall control.
Limitations of Budgetary Control:
(1) The future uncertainties reduce the utility of budgetary control system.
(2) Budgetary control may lead to conflicts among functional departments.
(3) The lack of co-ordination among different departments results in poor performance.
ADVERTISEMENTS:
(4) The cost of employing additional staff for budgeting increases the expenditure of an organization which generally cannot be afford by small enterprises.
II. Cost Control:
The cost of production is an important factor in calculating the income of an organization. Hence, every organization tries it level best to keep the cost within the reasonable limits. The techniques of cost control involve the setting of cost standards for various components of cost and making comparison of actual cost data with standard cost. This process is known as standard costing. This standard costing refers to a pre-determined estimate of cost with can be used as a standard.
This standard cost forms the basis of control under standard costing. Actual cost is compared with the standards, variations are analysed and suitable action are taken to overcome such variations. Thus standard costing may be regarded essentially as a tool of cost control.
Advantages:
(1) It helps in discovering efficient and inefficient activities in an organization.
(2) It provides valuable information for submitting tenders or quoting prices of products and services.
(3) It reduces cost of an organization.
(4) Cost records become a basis for planning future production policies.
(5) The reasons for variations in profit can be ascertained.
Limitations:
(1) It is very expensive to apply.
(2) The success of this method depends on the reliability and accuracy of standards.
III. Production Planning and Control:
It is an important function of production manager. This is the function of looking ahead, estimating difficulties to be occurred and remedial steps to remove them. It guides and directs flow of production so that products are manufactured in a best way.
Following techniques are helpful in production planning and control:
(i) Routing – It is the determination of exact path which will be followed in production. It determines the cheapest and best sequence of activities to be followed.
(ii) Scheduling – It is the determining of time and date when each operational activity is to be started and completed.
(iii) Dispatching – It refers to the process of actually ordering the work to be done.
(iv) Follow up and Expediting – It is related to evaluation and appraisal of work performed.
(v) Inspection – It is to see whether the products manufactured are of requisite quality or not.
IV. Inventory Control:
It refers to the control of materials in an efficient manner, which ensures maximum return on working capital. It is very important for the smooth functioning of production department. Its main objective is to maintain a suitable supply of material at the lowest cost.
This control is exercised at three phases:
(i) Purchasing of materials
(ii) Storing of materials
(iii) Issuing of materials.
This can be exercised by establishing various criteria such as:
(i) Safety inventory level
(ii) Maximum inventory level
(iii) Reordering level
(iv) Danger level
V. Profit and Loss Control:
It is a simple and commonly used overall control tool to find out the immediate profit or cost factors responsible for either the success or failure of business. As a controlling device it enables the management to influence in advance revenues, the expenses and consequently even profits.
The sales, expenses and profit of different departments are compared. The department becomes a cost centre. The in charge of the department is responsible for its performance. Even historical comparison is done to assess the performance. In case there are deviations in performance than immediate steps are taken to rectify them.
VI. Statistical Data Analysis:
It is an important control technique. This analysis is possible by means of comparison of ratios, percentages, averages, trends etc., of different periods with a view to find out deviations and causes. This method is applicable in case of inventory control, production control and quality control. The minimum and maximum control limits are fixed and deviations with in these limits are allowed.
It variations go beyond limitations then immediate steps are taken to correct them. Statistical control charts are prepared with the help of collected data and permissible limits are plotted. This chart will give an idea whether everything is going as per the plans or not. Hence, analysis of data is important device of control.
2. Modern Techniques:
Besides the traditional techniques which were discussed above, there are many other techniques which have been evolved in modern times. These techniques are also called non-budgetary techniques.
The following are the modern techniques of control which are commonly modern times:
I. Return on Investment Control (ROI):
One of the most successfully used control technique of measuring both the absolute and the relative success of a company is by the ratio of net earnings to investment the company has made. This approach often referred to a ROI. If the rate of return on investment is satisfactory, it will be considered as good performance. The return on investment can be compared over a period of time as well as with that of other similar concerns.
The return on investment can be computed with the following formula:
![]()
II. Programme Evaluation and Review Techniques (PERT):
The success of organization depends on its activities for the accomplishment of an objective within stipulated time and cost. Management should determine activities to be performed and their inter-relationships so that estimated resources and time needed to complete these activities as per schedule and to monitor and control the time and cost of the project.
Through network analysis technique the time can be minimized to complete the project and also overall project cost can be minimized. For this purpose PERT and CPM are the two important types of network analysis used in modern management.
It is a technique of project which is used in the following managerial functions:
i. Planning:
The planning of project includes the listing of different jobs that has to be performed to complete the venture. Here, requirements of men, material and equipment are determined along with the costs and duration for the various jobs, in the process of planning.
ii. Scheduling:
It is the arrangement of the actual jobs of the project according to sequence of the time in which they have to be performed. At this stage calculation of manpower and materials required are calculated along with the expected time of completion of each job.
iii. Control:
The process of control starts with comparison of the difference between schedules and actual results. They analyse of difference and the corrective action taken is the essence of control process.
The most important condition for implementing PERT is the breaking up of the project into activities and determining the order of occurrence of these activities i.e., deciding activities which are to be completed before. The next step is to draw graph, which explains the activities outlining the predecessor and successor relations among them. A thorough understanding of the steps associated with the construction of the graph is important for understanding of PERT.
Advantages:
The following are the important advantages of PERT are:
(1) It forces managers to chalk-out a plan to integrate all the activities as a whole.
(2) It is instrumental for concentrating attention on critical elements that may need modifications.
(3) It is helpful in solving problems of scheduling the activities of one-time projects i.e., the projects which are not taken on routine basis.
(4) It helps in completing a project on schedule by coordinating different jobs involved in its completion.
Limitations:
(1) The expected time for each activity of any programme cannot be determined with certainty.
(2) It is suitable for programmes where time is essential consideration.
III. Critical Path Method (CPM):
The technique is helpful in finding out the more strategic elements of a plan for the purpose of better designing, planning, coordinating and controlling the entire project. It was developed by walker of Dupont Company in 1950s, under this technique a project is broken into different operations or activities and their relationships are determined.
These relations are shown with the help of diagram known as network diagram. The network diagram may be used for optimizing the use of resources and time. This technique is based on the assumption that activity times are proportional to the magnitude of resources allocated to them and by making a change in the level of resources, the activity times and the project completion time can be varied.
Objectives of CPM Analysis:
The following are the main objectives of critical path analysis in a network:
(1) To estimate a route or path between two or more activities which maximizes some measures of performance.
(2) To locate the points of hurdles and difficulties in the implementation of any project.
(3) To determine starting and ending times for each activity.
(4) To determine the slack associated with each non-critical activity.
Advantages:
The application of CPM leads to the following advantages:
(1) It determines most critical elements and pays more attention to these activities.
(2) It results in the maximum utilization of resources and facilities.
(3) It provides standard method for communicating project plans, schedules and costs.
(4) It concentrates on the timely completion of the whole project.
(5) It improves the quality of planning and controlling.
(6) It eliminates waste of time, energy and money on unimportant activities.
Limitations:
CPM is having two major limitations:
(1) It has limited use and application in routine activities for recurring projects.
(2) Time given for different activities may prove to unrealistic.
PERT and CPM Compared:
PERT and CPM as techniques of planning and control have certain similarities as well as differences.
The two techniques are similar in the following respects:
(1) Both CPM and PERT use the project network as their basis.
(2) The concept of critical paths and activity slack are common to both.
(3) Both the techniques are basically time-oriented. They are now used for cost control as well.
The differences between the two techniques are the following:
(1) PERT is used for new industries with rapidly changing technology having more uncertainties, while CPM is used for construction projects where uncertainties are limited.
(2) CPM is activity-oriented while PERT is event-oriented.
(3) CPM lays stress on the element of costs whereas PERT is concerned essentially with the time factor.
IV. Management Information System (MIS):
This system emphasizes on providing timely, adequate and accurate information to the right person in the organization which in turn helps in making right decisions. It is a planned technique for transferring of intelligence within an organization for better management. Under this method data from all possible sources are collected and properly processed for using in future. So this system should be designed in such a way that helps management in exercising effective control over all aspects of the organization.
MIS is of two types:
(1) Management operating system and
(2) Management reporting system.
The first one meant for meeting the information needs of the lower and middle level managements and second one is to supply information to top level management for decision-making.
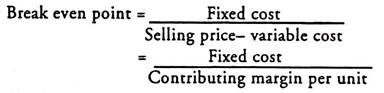
V. Break Even Analysis:
A significant and popularly used control technique among the business enterprises and industries is the analysis of break-even point which explains the relationship between sales and expenses in such a way as to show at what volume revenue exactly covers expenses. This technique measures profit corresponding to the different levels of output. Hence, the study of cost- volume-profit relationship is frequently referred to as break even analysis.
In the words of Matz and Curry “Break-even analysis indicates at which level costs and revenue are in equilibrium”. Thus, break-even analysis is associated with the calculation of break-even point. It is also known as no profit, no loss point. This point can be calculated mathematically and charted on graph paper also.
The method of calculating break-even point is as follows:
Assumption:
The break even analysis is based on the following assumptions:
(i) All elements of cost i.e., production, administration and selling and distribution can be segregated into fixed and variable components.
(ii) Variable cost remains constant per unit of output and thus fluctuates directly in proportion to changes in the volume of output.
(iii) Fixed cost remains constant at all volumes of output.
(iv) Volume of production is the only factor that influences.
(v) There is a synchronization between production and sales.
Advantages:
The break even analysis renders many advantages for managerial guidance.
Some noteworthy advantages of this analysis are as follows:
(i) It helps in calculating of profit for different sales volumes.
(ii) Calculation of sales volume to produce desired profit can be possible.
(iii) It emphasizes on calculation of selling price per unit for a particular break-even point.
(iv) It helps in determination of margin of safety.
(v) It helps in calculating of sales required to offset price reduction.
(vi) It helps in choosing the most profitable alternatives.
(vii) It helps in determining the optimum sales mix.
(viii) It helps in calculation of sales volume required to meet proposed expenditures.
Limitations:
The break even analysis is based on number of assumptions which are rarely found in real life. Hence, its managerial utility becomes limited.
Its main limitations are as follows:
(i) This analysis overlooks the time lag between production and sale.
(ii) The assumption of keeping factors like plant-size, technology and methodology of production constant in order to get an effective break-even chart is unrealistic in actual life.
(iii) The sales-mix is also not a constant variable.
(iv) The valuation and allocation of costs in an organization is usually arbitrary and hence it reduces the usefulness of this analysis.
(v) This analysis does not take into account the capital invested in the production and its costs which is very important factor in profitability decisions.
VI. Management Audit:
This audit reveals irregularities and defects in the working of management. It also suggests the ways to improve the efficiency of the management. It examines and the reviews various policies and functions of the management on the bases of certain standards. It emphasis to evaluate the performance of various management processes of an organization.
According to Taylor and Perry, “Management audit is the comprehensive examination of an enterprise to appraise its organizational structure, policies and procedures in order to determine whether sound management exists at all levels, ensuring effective relationships with the outside world”.
According to the Institute of Internal Auditors, Management audit is a “future oriented, independent and systematic evaluation of the activities of all levels of management for the purpose of improving organizational profitability and increasing the attainment of the other organizational objectives”.
Hence, from the above two definitions it can be concluded that management audit concentrates on the examination of policies and functions of the management on the basis of certain standards and norms.
Objectives:
The following are the main objectives of management audit:
(i) It assists management in achieving co-ordination among various departments of the organization.
(ii) It detects any irregularity in the process of management and also it suggests improvement to achieve best results.
(iii) It assists all levels of management through constant watch of all activities of the organization.
(iv) It suggests changes in the policies and procedures for a better future.
(v) It ensures most effective relationship with the outsiders and the most efficient internal organization.
(vi) It concentrates on performance of the management through close observation of inputs and outputs.
(vii) It ensures the establishing good relations with the employees and to elaborate duties, rights and liabilities of the entire staff.
(viii) It recommends better human relation approach, new management development and overall organizational plans and objectives.
Importance:
Management audit is very important for its usefulness and is outlined as follows:
(i) It assesses the soundness of plans adopted and the adequacy of control system for making plans successful.
(ii) It is useful in giving advices to the prospective investors.
(iii) It is very much useful in reviewing plans and policies.
(iv) It gives proper advice to the management to perform their functions well.
(v) Financial institutions may get management audit conducted to ensure that their investment in the company would be safe and secured in the hands of the management.
Advantages of Management Audit:
It provides us following advantages:
(i) It helps the management in preparing plans, objectives and policies and suggests the ways and means to implement those plans and policies.
(ii) Proper management audit techniques help the business to stop capital erosion.
(iii) Management audit increases the overall profitability of a business through constant review of solvency, profitability and efficiency position of the concern.
(iv) Management audit eradicates the inefficiencies and ineffectiveness on the part of the management.
(v) The techniques of management audit are not only applicable to all factors of production but also to all elements of cost.
(vi) It helps the top management to take effective decisions in time.
(vii) It helps the management in strengthening its communication system within and outside the business.
(viii) It helps management in preparation of budgets and resources management policies.
(ix) It helps management in training of personnel and marketing policies.
Disadvantages:
The disadvantages of management audit can briefly be stated as follows:
(i) The installation of this audit technique involves heavy expenditure.
(ii) Due to ineffectiveness and inefficiency of the management auditor, management audit cannot provide result oriented service.
(iii) Management auditors may be engaged in some activities detrimental to social objects of auditing for example evasion of tax.
Answer 2. Techniques and Tools of Controlling:
Planning and controlling are now treated as an integrated system. This is quite apparent in management control techniques such as budgeting, break-even analysis, linear programming, and net-work analysis like PERT/CPM.
In a sense plans, policies, procedures and objectives may be considered as feed-forward controls and the combined planning /controlling techniques establish the goals, parameters, and constraints for the control of ongoing operations.
Management control is a systematic effort to set performance standards with planning objectives, to design information feedback systems, to compare actual performance with these pre-determined standards, to determine whether there are any deviations, and to take any action required to assure that all corporate resources are being used in the most effective and efficient way possible in achieving corporate objectives.
Broadly speaking, we have two categories of management controls:
i. Budgetary controls, and
ii. Non-budgetary controls, including all techniques of operations research, i.e., quantitative control techniques.
1. Budgetary Control:
Budget:
A budget is a recorded plan of action expressed in quantitative terms. It is a statement of anticipated results either is financial terms, e.g. cash or capital budget, or even in non-financial terms, e.g., budgets of materials, physical sales volume or units of production. As a recorded plan of action, it is; quantitative statement relating to a certain future period, ii order to attain the given objectives in that period.
The process of preparing a budget is planning and the budget itself is the end point of the planning process, i.e., the resultant plan. However, the budget is the most widely used control device as the planned targets of the budget, are the standards against which actual performance is compared and controlled.
A budget prepared to act as a means of controlling operations. For each unit, we have a separate budget usually for a year. Each budget is expressed in financial terms, as it helps to compare and cc ordinate all operations of the enterprise.
Budgets perform three functions:
(1) They present the objectives, plans and programmes of the organisation and express them in financial terms;
(2) They report the progress of actual performance against these pre-determined objectives plans and programmes;
(3) Like organisation charts, delegator of authority, procedures and job descriptions, they define the assignments, which have flowed down from the chief executive.
Budget while performing the first function acts as the instrument of planning. While performing the second function, it acts as the means of control. While performing the third function, it merely performing the function of defining assignments. Here, we are interested in the second function, viz., and the means of control-reporting progress of actual performance against the programme.
Budgetary Control:
A budget is one of the most important overall control devices used by modern management. Budgets are essentially plans of action. But their use in financially controlling the enterprise is so great that they have come to be regarded as the media of control. The term “budgeting” points out controlling based on a budget. Thus a budget serves as a planning- controlling mechanism.
Of course, a budget, like planning, comes first and budgeting like controlling follows the budget in the cycle of planning-controlling mechanism (controls are the reverse side of the coin of planning).
Budgetary control naturally involves preparation of budgets and later comparison of actual with planned expenditure or comparison of actual performance with the budget and taking corrective actions, if necessary, to remove the shortfall or deficiency. Many companies refer to their budgetary controls as either profit plans or profit paths.
Budgetary control gives due recognition to the importance of managerial functions of planning and control. Plans are described in financial terms. Then the actual performances are compared with the plans (Budgets) and control is exercised to achieve the planned performance.
Budgetary control also enables management to co-ordinate all management functions. For instance, we can co-ordinate sales and production functions so that what is produced is sold at the planned price and what is to be sold is duly produced in the required quality and quantity at the right cost and at the right time.
In recent times, the technique of budgetary control has made great contributions in the Western countries to ensure the effectiveness of operations of a business enterprise. Multinational corporations having numerous subsidiaries all over the world cannot manage their affairs effectively without a comprehensive budgetary control system.
At present a budget is regarded as a profit plan and budgeting is considered as profit planning. Programme Planning and Budgeting (PPB) is a modified concept of budgeting and it concentrates more on goals and programmes in the light of available resources. Costs are assessed against benefits in selecting the best course towards accomplishing a programme goal.
The technique of budgeting itself has undergone radical changes in the recent past. Earlier, budgets operated on a mechanistic accounting concept of departmentalisation of financial expenses. Modern budgeting acts as a positive tool for total management planning and control, the process in which the entire organisation actively participates.
Bottom-Up Approach:
Budgets are not fixed by the top management and then formally ‘given’ to the heads of departments. Today, the budget preparation starts with the smallest unit of the organisation. Such sectional budgets are progressively aggregated to finally arrive at the overall corporate budget.
Stress on Non-financial Indicators:
Another distinctive feature of the modern budgeting is the importance given to non- financial indicators as well. Early budgeting in its zeal for financial aggregations overlooked such non-financial indicators, e.g. market share, capacity utilisation, labour efficiency, etc. Today most budgets duly recognise the importance of these physical indicators at the operational level.
The budgetary control system cannot be standardised and made uniform for all business. No two enterprises operate in the same way with similar resources in identical or similar environments. Even for two companies in the same industry, the financial resources, the age of plant, or the managerial competence may be entirely different.
And budgeting must take these distinctions into account if it is to be effective. The success of each company depends on a particular factor, which may be different from that for other companies. Budgeting, to be effective, must recognise the importance of the key success variable (also sometimes called the Budget Key Factor).
In case of some companies the key success variable may be their marketing skills, while in some other case it may be production efficiencies, or excellence in purchasing, or an advantageous location.
Three Approaches in Budget Preparation:
The Competitive Approach:
Each unit or department is asked to submit its projection for the ensuing year regarding the operating expenses and capital expenditures to the top management or the central budgeting group or committee. The budget committee reviews the demands and returns a fixed Rupee amount to each unit.
The budget committee cannot judge the demands accurately on their merits. It compares projected figures with past expenditures. During inflation it will try to hold the line as near as possible and during recession it will try to reduce the budget items by a certain percentage, say 20 per cent across all units.
Anticipating this behaviour, all units try to pad their demands and inflate their budgets intentionally to cover contingencies or build a higher base for future periods.
The Hard-Line-Soft-Practice Approach:
A firm line is adopted in the initial allocation. Certain reserves are created. But deserving cases or requests are met duly during the budgeted period. Under this procedure loudly protesting units or favoured units get the required funds. Similarly, co-operative groups can be rewarded with additional allocations while quarrelling units are denied such privileges.
The Multiple-Level-Contingency Approach:
Each unit is asked to prepare its budget with upper and lower limits for each major item rather than demanding absolute amount. In a budget meeting unit manager presents his forecast. The superior will consider factors pushing expenditures towards the upper or lower limits. Then the superior aggregates the budget for his entire group and carries this forward to the next level for approval.
The first approach represents traditional autocratic managerial style. The second approach is a combination of autocratic and human relations managerial style. The third approach reflects human resources model. It stresses joint planning process in budgeting. The unit can set a high standard. It gets the freedom to fail. Unpredictable contingencies are duly recognised.
Organization Structure and Budgetary Control:
Budgets place responsibilities for action and results on some individuals in the organization. Naturally, the budgeted expectations must be based upon the resources, in terms of men, machines, materials and money, available to every such individual. In other words, budgeting must closely follow the organization structure. It must demand from an executive what he can reasonably do with the men, machines, materials and monetary resources assigned to him.
For example, it would be foolish to blame the Factory Manager for the high cost of the manufactured product, if such high cost has been the result of buying raw materials at high prices. If, however, these high costs were a result of inefficiencies and waste in the production process the Factory Manager should be held responsible.
This aspect of budgeting requires that the organizational responsibilities must be determined very clearly. Otherwise the budget meetings become a forum for merely, apportioning blame rather than positive contribution to the progress of business.
The trend today is not to take the organisation structure as given for designing a budgetary control system, but to treat the structure and the system as interdependent and interacting with one another and design both simultaneously so as to arrive at an optimum point to attain the management strategy of the company. The top management, to achieve the corporate strategy, must actively participate and wholeheartedly support the efforts of the executives designing the system of budgetary control.
Administration of Budgetary Control:
For proper and effective administration of a budgetary control system, the management of a company must decide the following:
(a) Budget Centre:
Budgets are set for different organisational units in a company. A budget centre is a section or unit of a business which is treated separately for the purpose of defining responsibility and also for the purpose of cost control. Each such unit is an independent entity and it is called the budgetary centre.
Several budget centres may be grouped into departments. The fact that determines the budget centre is the coherence (sticking together) and similarity of activities carried on within the unit. It must also be ensured that there is one executive in charge of each budget centre who should shoulder the responsibility for performance by living within the unit. Each budget centre would plan out its activities and the budget for that centre may be fixed by management.
The performance of the budget centre is judged against its budgeted amount. When the budgets for all budget centres in the company are pooled or aggregated and the overall result is shown for each budget centre, each division of the business and for the company as a whole, we have a summarised statement or a master budget for the entire company.
(b) Budget Period:
Planning should be done for convenient periods. Normally, budgets cover twelve months, though they may be for shorter periods, e.g. three or six months. The period of time to which the budgets relate is called the budget period. Ideally the budgets should be worked out for a period which coincides with the Operating Cycle of the business. The Operating Cycle is the period of time that separates the point of purchase of raw material and the point when the debts resulting from sales of finished products are collected.
Thus, it would consist of the movement of funds in a full cycle of Cash-Raw Materials-Work in Process—Finished Goods—Debtors for Credit Sales—Cash. For different types of business, this Operating Cycle may be different. However, most of the businesses have one year as the budget period. This is because one year is normally the period for which the financial accounts are to be made up.
Thus, comparison between Budgets and Actual Performance is facilitated. This one-year budget period is normally divided into twelve months, or into thirteen four-weekly periods, depending on the practice of the company.
(c) Budget Committee:
The Budget Committee is the organizational device that looks after the administration of Budgetary Control. As stated earlier, budgeting is not merely an exercise in financial figures but a managerial technique to plan and control the entire business. Hence, generally the Functional Heads of all departments would be the members of the Budget Committee.
An ideal budget committee, consisting of the Marketing Manager, Factory Manager, Materials Manager. Financial Controller, Personnel Manager, (R & D), Research and Development Manager would be headed by the Chief Executive or Managing Director. The Budget Officer may act as the secretary of the Budget Committee.
He should be a man well- versed not only in financial and cost accounting, but in other aspects of business as well. His duties would include preparation of data for the Budget Committee Meetings, drafting of the budgets, recording the expenses for each budget centre, calculation of variances, preparation of statements showing variances for each department and answering the queries of various managers.
(d) Budget Manual:
The process of Budgetary Control is repetitive and follows the same pattern every year. To systematize the whole procedure, it is often written down in the form of a Budget Manual. The Budget Manual of any company would contain, among other things, the definitions of various terms, the organization structure and the Budget Centres, the chart of accounts, the composition of the Budget Committee, the procedure of the budgetary control process, various formats used, etc.
As the organization progresses, appropriate changes will have to be made in the Budget Manual. This updating of the Budget Manual is authorised by the Budget Committee. The Budget Manual serves as the basic document of issues relating to the Budgetary Control System, which may be controversial.
Budgets and Operational Flexibility:
Budgets are prepared before the Budget Year commences, and the performance is judged against these budgets. Does this mean that the managers are required to rigidly stick to the budgets accepted by them? Does it mean that any opportunity that comes after the budgets are finalized has to be forgone because it was not budgeted.
If the company sees the chance of a lucrative export order during the Budget Year, it will certainly be foolish to leave it ‘because budgets do not permit its acceptance’. Alternatively, if the company faces a prolonged strike, should we change the Production Manager and the Marketing Manager ‘because they did not achieve their targets’?
Budgeting is an exercise in ‘guessing the future’ and no one can accurately estimate what will happen in future. On the one hand, this becomes the very reason why we try to plan for future, so that chances of being caught unawares are reduced. On the other hand, there must be some flexibility left in the plans since we cannot totally eliminate the chances of being caught unawares.
Many companies today have ‘Flexible Budgeting’ in operation. Costs of different levels of activity differ and this is the basis of flexible budgeting. Thu^ a flexible budget would give the costs of various levels of activity. The ‘fixed’ costs would remain the same at all levels, whereas the ‘variable’ costs would increase in proportion with the level of activity. Thus, the performance of any department can be judged at various levels of activity.
These flexible budgets are prepared only as a back-up for the regular budgets. The budgets are still fixed for a particular level of activity. The top management would allow the use of the alternative level only if it is satisfied that the change in the level of activity was entirely out of control of the Departmental Head.
Advantages of Budgetary Control:
A well-knit system of Budgetary Control, brings with it various benefits for the organisation:
(1) Ensures Improved Planning and Control:
Budgeting is a tool that ensures proper performance of two of the managerial functions: Planning and Control. In spite of the proven importance of planning, it is sometimes said, managers do not plan well ahead unless forced to do so. Budgeting ensures that the organization plans for its own future performance, and then, through the control process, tries to ensure adherence to the plans. It stimulates thinking in advance and leads to specificity of planning.
(2) Ensures Optimum Use of Resources:
Budgeting ensures optimum utilization of all resources. Since all-round thought is given, during the preparation of budgets, to all resources, it is unlikely that any resource would be left idle without sufficient reasons.
(3) Ensures Co-Ordination:
Budgetary control ensures coordination of activities of various departments and secures co-operation. This is achieved by adopting a common set of assumptions through the Policy Guidelines, integrating the activities of different departments to a specific set of targets (‘unity of purpose’) and actual preparation of interlinked budgets of different departments. Budgetary control contributes to balancing of activities and disclosing unbalance early.
(4) Ensures Communication:
Budgets serve as an important tool of communication within the organization. They communicate the top management’s policy to all managers through the policy guidelines. The process of preparation of budgets helps in the communication of strategies to be followed.
The reports of actual performance against the budget communicate to each manager how he has fared, and in which area is action necessary. Communication through the Budgetary Control System is so important that the modern Management Information Systems are built around the Budgets.
(5) Ensures Participation:
Budgeting gives an opportunity to all managers to participate in the planning and control process. Budgets are first prepared at the smallest organizational units, and then progressively aggregated to give the Corporate Master Budget.
This means that each manager plans for himself (of course, to the satisfaction of his immediate superior). Naturally he would strive to achieve the plan, since it is his plan. Thus the commitment to achieve the budgets is obtained and motivation is high throughout the organization.
(6) Ensures Continuity:
A formalized system of Budgetary Control ensures the continuation of the System, irrespective of the persons who are running it for the time being.
Budgetary control provides a basis for:
(a) Administrative control,
(b) Direction of sales effort,
(c) Production planning, and
(d) Control over stocks,
(e) Price fixing,
(f) Financial requirements,
(g) Expense control, and
(h) Production cost control.
The budget co-ordinates sales, manufacturing and finance. It forces executives to think, and think as a group.
2. Non-Budgetary Controls:
Budgetary controls are particularly useful in controlling performance in the areas of profitability and productivity. There are other means of control or non-budgetary controls in order to secure an effective and complete system of management controls.
These techniques of non-budgetary controls are:
i. Reports,
ii. Ratio analysis and R.O.I.,
iii. Break-even analysis,
iv. PERT/CPM network analysis,
v. Inventory control,
vi. Quality control,
vii. Linear programming,
viii. Traditional financial statements,
ix. Human resource accounting,
x. Management, by objectives/ results/ exception,
xi. Computer systems control through computerised management information system,
xii. Performance appraisal,
xiii. Cost- benefit analysis and
xiv. Personal observation and personal contacts giving information not revealed by formal reports,
xv. Audit programmes particularly the management audit to appraise the overall performance of management, e.g., marketing audit, social audit.
Project evaluation report must be backed by cost-benefit analysis in which economic and social costs are duly considered side by side with economic and social benefits. To proceed with a project, the benefit-cost ratio must be more than one or the benefits must be greater than costs. Benefit-cost ratio = Rupees of beneflts/rupees of costs. The ratio must exceed one.
Financial analysis looks after economic cost-benefit analysis and determines economic profitability from the business enterprise viewpoint primarily. However, a business enterprise is a socio-economic and open adaptive system. It is expected to fulfil social responsibilities and must show social awareness in its project evaluation and implementation.
We consider the total costs (economic and social) and total benefits (economic and social) which will be associated in cur project development programme. The project must satisfy economic as well as social aspirations and expectations. Acceptability or otherwise of any project ultimately depends upon its financial implications. We have to evolve a project which is financially viable and sound.
We estimate:
i. Project cost,
ii. Project operating costs, and
iii. Project funds requirements.
Financial analysis will also indicate relative position of the project as compared with other opportunities available for investment. Present Value (PV) technique internal rate of return (IRR), ratio analysis and cost-volume- profit study are the usual tools employed in the financial analysis.
Inventory Control:
There are four important quantity standards in inventory control:
(1) The Maximum:
It indicates the upper limit of the level of stocks or inventory. It points out the largest quantity to be normally kept in the store in the interests of economy.
(2) The Minimum:
It indicates the lower limit of the level of stocks of inventory which is really a maximum reserve or margin of safety. The level of safety may be used only in an emergency. It is the level acting as a safety valve. It is the minimum level of stocks which must be always on hand. It is the minimum reserve of the dealer.
(3) The Standard Order:
It is the quantity of stocks to be requisitioned for purchase at any one time. A repeat order for a commodity is always of the same quantity until conditions change, necessitating a revision of the standard order. The purchase requisition gives this quantity for replenishment of stocks.
(4) The Ordering Point:
It is the quantity of stock necessary to protect against the exhaustion of the stock during the gap between the date of order and the date of actual receipt. When the level of stocks or the balance on hand reaches this level, it is an indication that a new order must be placed at once.
The lime necessary to secure the stock of required articles after requisitioning must be carefully, calculated and sufficient margin must be provided for contingent delay or bottlenecks in transport. Order point indicates when to order.

Economic Order Quantity (EOQ):
Economic Order Quantity or EOQ is a mathematical formula employed in the determination of base stock needs. It guides efficient inventory management.

The most economical order quantity (EOQ) really balances the cost of ordering against’ the cost of holding inventory. If you order lesser than 912 units (EOQ), costs rise because of increased ordering expenses. Costs also rise due to increased inventory charges if you order more than 912 units (EOQ).
At EOQ point, we have a balance between ordering cost and inventory cost and the total cost is lowest. EOQ is the point of cost equilibrium. In our case order quantity of 912 units involves lowest costs. We will have six orders in one year to fill in our annual demand of 5,200 units.
The size of inventory is determined by balancing the market demand and inventory cost factors. Market demand is anticipated by analysing the sales forecast. If our sales forecast be accurate and reliable, we can easily arrive at the optimum inventory size.
The inventory cost factors are:
(1) Cost of making or buying goods.
(2) Cost of holding goods i.e., warehousing expenses, interest, losses due to spoilage, pilferage, etc. The upper limit of inventory is influenced by desired level of customer service.
(c) Statistical Quality Control:
Statistical quality control or SQC involves the use of statistical methods to gather and analyse data in the determination and control of quality. It is the technique of applying statistical methods based upon the mathematical theory of probability to quality control problems. It helps to establish quality standards and maintain adherence to these standards in the most economical manner.
Inspection is a remedial and costly control device. SQC is really a preventive and very economical device to control quality. It can rectify the error immediately when it is discovered. Hence, it gives savings in the cost of production by eliminating waste, reducing the required inspection work, and so on. It reduces inspection as controlled process does not require so large a sample in acceptance sampling. SQC is based on sampling, probability, and statistical inference. The SQC needs representative sample, i.e. a random sample.
Control Limits:
In a normal frequency distribution we have symmetrical curve — a bell shaped curve.
We have only chance causes of variation. In a normal distribution:
Average ± one standard deviation.

SQC through statistical sampling of raw materials now provides reliable information very promptly only on the basis of small samples representing large lots.
Advantages of SQC:
(1) Less defective work and low production cost,
(2) Smooth production process or flow,
(3) Reduction in inspection cost,
(4) Timely warning about deviations,
(5) Simple and efficient inspection process.
SQC is only applicable to repetitive manufacturing process. It is not economical if a production run is for a short period and will probably be not repeated. SQC like regular inspection procedures can be used for accepting or rejecting the products already manufactured, and in addition it can be used in the production process also. Hence, it is gaining great popularity in modern manufacturing process.
Quality control (including SQC) has now been computerised. General electric in U.S.A., found that programmed quality control through computer reduced its inspection labour in some cases by about 95 p.c. and reduced internal failures in industrial controls to such an extent that the computer installation paid for itself in two years.
(d) Management Control by Exception:
The most efficient time and energy is possible when control information stresses the exception or critical points of control and focuses attention upon those functions that need corrective action. MBE is an effective control technique. In a big and complex enterprise, MBE is very necessary. Feed-forward technique such as PERT really focuses our attention on the exceptional or critical activities. Computerisation is also compatible with MBE.
The process of delegation is closely related to MBE. Management by exception principle states that managers should concentrate their time and efforts on those areas that are in difficulty. Exceptions at critical control points are promptly reported to the higher level managers for corrective actions.
Ratio Analysis was perhaps the first financial tool developed to analyse and interpret the financial statements and is still used widely for this purpose. A financial ratio is a relationship between two variables drawn from the financial statements of a business enterprise. Such variables are normally taken either from the Profit-and-Loss Account or from the Balance Sheet of the undertaking.
The ratio may be expressed as a percentage (1/4 X 100 = 25 p.c.); a proportion (1:4); or a fraction (1/4). A financial ratio compares one financial measure, e.g., profits to another, e.g. sales.
Since it represents a relationship between numbers, a ratio can be formed by taking any two figures from the financial statements. However, such an approach would be futile from the point of view of financial analysis unless the variables chosen are significantly related to each other.
Financial analysts have identified some ratios as significant and important, since they throw considerable light on the financial affairs of a business. Such important ratios which are widely used are discussed here.
Ratios have been variously classified, based on their peculiar characteristics. For example, some authors classify them as Balance-Sheet Ratios, Profit and Loss Account Ratios and Mixed Ratios, depending upon the statement (s) from which the variables are chosen. However, a better way of classifying ratios is on the basis of the financial characteristics that they indicate.
On this basis, we can classify the ratios in the following groups:
i. Structural Ratios.
ii. Working Capital Ratios.
iii. Profitability Ratios.
iv. Miscellaneous Ratios.
(f) Return on Investment (ROI):
R. O. I. is a popular tool of budgeting or profit planning and control.
Du Pont chart shows basic elements in the return on investment. If sales were Rs. 4 lacs and investment Rs. 1 lac, the turnover of investment for the year would be four, i.e., our investment would have been used four times in the year. If we find the earnings on sales as 5 p.c., then with a turnover of four, we have the return on investment 20 p.c.
R.O.I. = Earnings/Total Investment or Net Profits/Total Assets.
For example:
Earning=Rs. 85 L.; Investment=Rs. 320 L.; R.O.I. = 24 P.C.
A businessman invests money to earn profits. This ratio denotes the profitability per rupee of investment. It has assumed great importance in the context of large, divisionalized companies. The performance of each division in such companies is judged on the basis of its R.O.I. (Return on Investment).
Sometimes, Net Profit is taken in place of Pre-tax Profit while calculating Return on Investment. R.O.I, is a popular ratio in financial management and analysis. It is used in corporate planning.
It is the function of budgeting to plan the profit picture.
R.O.I. Return on Investment

Du Pont Chart:
The Du Pont Chart provides:
(1) An overall true relationship picture of the financial relationship leading to the earnings rate on investment.
(2) Changes in any important part of the structure influence the final investment returns.
(3) We have Two-tier approach given in the chart. It concentrates our attention on the separate forces offering their contribution to profits.
(4) We can improve R.O.I, either through better use of capital measured by the turnover sequence or through better relationship between sales and costs, measured by the profit margin sequence.
(5) We can achieve the same R.O.I, either by a low profit margin and high turnover or by a high profit margin and low turnover.
(6) R.O.I, is a valuable tool to measure economic performance. It is also employed as a device or means to evaluate or appraise alternative projects involving investment opportunities.

(g) Other Techniques for Analysing R.O.I.:
Apart from the Du Pont method of R.O.I., we have other techniques for analysing return on investment:
(1) Payback method,
(2) Accounting method,
(3) Discounted cash flow,
(4) Present value (PV), and
(5) Internal rate of return (I.R.R.).
(1) The Payback Method:
It measures the length of the payback period—the number of years required for the earnings on the investment to pay back the original capital outlay with no allowance for capital wastage. An investment having shorter payback period is chosen. Highly profitable project can be selected and those showing a low return can be rejected.
![]()
(2) The Accounting Method:
It can be expressed as:

(3) The Discounted Cash Flow:
DCF evaluations are be. On the principle that money has a time value. For instant Rs. 100|- received today is worth more than Rs. 100/- received in a year’s time. We can invest Rs. 100/– at 10 p.c. per year and after one year we have Rs. 110/- and after 2 years it will be Rs. 121/- and so on. Hence, Rs. 121/- received after 2 years can have a present value of Rs. 100/– (the future sum discounted at 10 p.c. per year). This discounting process is just compound interest worked backwards.
In DCF evaluation, we have the following procedure:
Throughout the anticipated life of the project we have yearly records of all expected payments for capital expenditure, goods and services as well as yearly records of all expected receipts from the project. For each year, subtraction of the former from the latter will indicate how much cash the enterprise receives or loses as a result of the project.
Please note that we do not include borrowing and lending as well as payments of interest and dividend in our concept of ‘Cash Flow’ when cash flow statement is used to determine the profitability of our new investment (project).
(4) The Present Value:
Now we have to discount the future cash flow back to the present. The current rate of return on investment will act as the rate of discount in our procedure. We will have compound interest worked backwards. In this way we arrive at the present value of the project (PV). The present value is an important measure of profitability. The higher the present value the more important and desirable is the project.
(5) Internal Rate of Return:
We may also have a second measure of profitability, the internal rate of return (IRR). It is the yield of the project. Entrepreneurs usually judge the value of investment by its yield. Present value may not indicate precisely about the marginal acceptability of a project.
Two projects may have the same present value (PV)—one project is large and its IRR is little above the discount rate while the other project is small but it has a much higher IRR or yield. If you are not very sure about the rate of discount, it is better to consider also the yield or IRR of the project. An investment giving greatest, IRR is more desirable.
Limitations of Ratio Analysis:
(1) There are no ‘standard’ values for any of the ratio which can be calculated scientifically. The ‘acceptable’ values mentioned above are mere-thumb rules prescribed by certain authors.
(2) Any ratio, or any set of ratios, derived from the final accounts of an enterprise, do not throw much light on whether it is run efficiently or not. As there are no standards, these ratios must be compared with some base.
(a) One such base can be similar ratios for the same enterprise over several years in the past. This is historical analysis and would reflect the trend in the value of each ratio over the years. However, so many ratios presented for so many years may, in fact, confuse the reader rather than enlighten him. What inference would one draw if, say, the current ratio has steadly increased over the years, while the Profit-to-Sales ratio has decreased.
(b) Similar is the problem if the other base, viz. ratios for other companies in the same, industry, is used. A company might show a higher Profit-to-Sales ratio, but a lower Return- on Investment, than other companies. With such confusing results, it may become possible to support any conclusion that one may want to draw, and this is clearly dangerous.
(3) Ratio analysis gives only the relationships between different variables and the actual magnitudes are not known through ratios. A very fast expanding company may show a more or less stagnant Fixed-Assets-Turnover ratio, but before attempting to condemn it for this apparent stagnation, one must pause to have a look at the increase in the volume of sales, which, in itself, may be a good achievement.
Similarly, before drawing any conclusion from the different debt-equity ratios of two companies, one must think of the actual magnitude of the capital employed in fixed and current assets.
(4) Ratios are derived from the financial statements and naturally reflect their drawbacks.
We mention below only two such drawbacks:
(a) Some figures in the balance sheet are at historical value (e.g., original cost of fixed assets, loans taken) while others are at current value (e.g., current assets). If one company started its business twenty years ago and the other only two years ago, their final accounts are not comparable.
(b) Several figures in the final accounts depend on the accounting policies followed by the management, e.g., depreciation policies, policies of involuntary valuation, etc. Such changes also make comparison difficult.
Uses of Ratio Analysis:
Four distinct groups are interested in analysing the financial performance of business.
They are:
(1) Management of the business,
(2) Bankers and financial institutions,
(3) Existing and prospective investors, and
(4) Independent financial analysts.
The management of any enterprise uses ratios in conjunction with other financial tools. With the development of modern cost accounting and cash/funds flow techniques, the importance of ratio analysis in internal management has considerably diminished. The new tools are more effective techniques of financial planning and are generally given more importance than ratio analysis.
Bankers and Financial Institutions used to employ ratio analysis for lack of any detailed financial data other than the final accounts. However, in recent times, these lending institutions make it obligatory on their debtors to supply additional information which is riot available to lay outsiders.
These lenders, who are interested mainly in the solvency of the borrower’s business, do use ratios primarily, with additional information to supplement them. It is the last two groups, viz. Investors and analysts that have to depend on ratio analysis and use this tool extensively.
These groups being total outsiders, do not have access to internal cost and financial data, and have to base their opinions only on published data. In these circumstances, ratio analysis does help them in drawing meaningful conclusions.
(h) Break-even Analysis (A Technique of Financial Analysis):
Traditional cost accounting undoubtedly provided the managers with an insight into the cost structure of any business or product. However it was of limited use in several decisions involving the relationship between, say, volume of sales and profit.
The technique of Cost-Volume-Profit Analysis, sometimes rather loosely called ‘Break-Even Analysis’, and this term is used more often, which uses the economist’s concepts of fixed and variable costs in a slightly modified form, proves immensely useful in taking several business decisions. The basic concepts of this analysis are fixed and variable costs.
Fixed Costs:
Fixed costs in business are those elements of cost which do not vary with the volume of production. Here we assume that the installed production capacity is fixed and not intended to be changed. These costs must necessarily be incurred regardless of the level of output and sales. Depreciation, Property Taxes, Interest, Insurance Premium, Rent, Supervisory and Managerial salaries are all typical examples of fixed costs.
Variable Costs:
Variable costs are those which vary directly with the actual volume of production or sale. Thus, the variable cost per unit of output is constant, and as output changes, total variable cost would also change in the same proportion. This concept is somewhat different from the economist’s concept.
To an economist, as output increases the ‘average variable cost’ first drops to a certain level and then starts increasing. To an accountant, the ‘average variable cost’ is constant. Undoubtedly the economist’s concept is closer to reality, but given a reasonably small range of output, the ‘average variable cost’ (i.e., the variable cost per unit of production) can be approximately taken to be constant. Variable costs are also called direct costs.
Break-even point analysis is a popular control device. The break-even chart is a visual device to describe, for instance, the relationship of sales and expenses in such a manner as to demonstrate at what volume revenues exactly cover costs or expenses. At any lesser volume the firm would suffer a loss, and at a greater volume it would earn profit.
Break-even Point Analysis (Cost-Volume-Profit Model):
The cost-volume-prof it model, or break-even chart, provides a useful managerial tool for analysing the relationship between revenues from sales and costs of producing those sales revenues. CVP model emphasizes relationships among decision variables such as price, costs, and volume of scales.
Sales Revenue = Total Costs + Zero Profit/Loss
This is called the break-even point at which the firm has neither profits nor losses. The firm breaks even i.e., it just covers its total cost and we have zero profit/loss.
When sales revenue exceeds total costs, the result or difference is profit and when sales revenue is less than total costs, the result or difference is naturally loss. Thus, break-even point is that point at which sales revenue is just equal to total costs.
Sales Volume:
Sales volume is a function of sale price and the amount of product sold, i.e., unit price multiplied by quantity sold. Our marketing plan is based on sales budget and the sales budget is itself based on the sales forecasts, i.e., estimated sales volume.
Costs:
There are two costs. Fixed costs are the costs of being in business. For a given range of operations they are constant. Variable costs vary with the output or number of units produced.
Contribution:
The concept of contribution is important in break-even analysis. Suppose a marketer is manufacturing and selling shirts. The sale price to the dealer is Rs. 70/-. If variable costs are equal to Rs. 35/- and selling and other direct expenses are Rs. 15/- the total variable cost is Rs. 50/- per unit. The contribution of each unit sold to cover profit and fixed cost is Rs. 20/- (Rs. 70/-, minus Rs. 50/-).
Unit Contribution = Sales Revenue — Variable Cost.

Example:

The figure, (chart) points out that the break-even point is, 5,000 units of sales, or Rs. 3.5 L. (Rs. 70 X 5,000). Fixed cost is Rs. 1.00 L. Beyond break-even point profits are earned. Before it, losses are incurred.
Pricing is the most important factor in the break-even analysis. An increase in the sale price enables a marketer to reach break-even point much more rapidly. If the selling price is say, Rs. 75|- per unit, the break-even point will be-
1L/75-50 = 1L /25= 4000 units.
The break-even analysis is the basic tool for the analysis of cost-based pricing decisions. The higher the mark-up the steeper the slope of the sales revenue line and the lower the break-even point.

Factors Influencing C-V-P Relationship:
The profit of a business is dependent on three basic factors:
(1) Sale price of the product,
(2) Cost of production and distribution of the product,
(3) Volume of sales.
No one factor is independent of the others because cost determines the selling price to arrive at a desired rate of profit. The selling price affects the volume of sales, and the volume of sales directly influences the volume of production Again the volume of production, in turn, influences the cost.
The cost-volume-profit (C-V-P) relationship is influenced by five variable factors-
(1) Sale price,
(2) Sales volume,
(3) Product mix or sales mix,
(4) Variable cost per unit, and
(5) Total fixed cost.
The C-V-P analysis or break-even chart is a good control technique used for measuring the functional relationship between the five major factors affecting the profits and also determining the profit structure of an enterprise. It is very useful in planning and control because it emphasizes the marginal concept, i.e. the effect of additional output or sales or costs on profits.
To permit effective planning and control, management must foresee the part that each of these five variables plays, or will play, in changing the net income, the break-even point, and the return on Investment for the firm.
Break-even analysis is essentially a tool for cost-plus pricing. It ignores the market demand at various prices. It also assumes that costs are static. This is not true in practice.
Uses of (C-V-P) Analysis:
C-V-P Analysis is useful in a variety of situations where the managers are required to take decisions.
Some of the situations are as follows:
i. Pricing decisions.
ii. Make or Buy Decisions- Should we manufacture certain components, which involves additional investment” or buy them from outside?
iii. Production Process Decisions- If the same product can be produced by alternative processes, which one should be adopted?
iv. Acceptance of Special Orders at Discounts.
v. Possible ways of Sales Promotion- Should we reduce the prices, or increase advertising, or incorporate additional features in the product?
vi. Addition or Deletion of Product Lines- Which products can conveniently be added to the product line? Which can be discontinued?
vii. Channels of Distribution- Should we have our own distribution network or should we appoint distributors and stockists?
viii. Sales Mix- Given the present product line, which particular product should be manufactured in larger quantities and which product should not be emphasised?
Illustration:
ABC Pen Manufacturing Company Ltd., sells its pens at Rs. 4.50 per unit. Its variable costs are Rs. 3.00 per pen, and its annual fixed costs are Rs. 40,000. ABC’s current sales are 28,000 pens per year. To increase the profits, the Sales Manager suggests a reduction in the price to Rs. 4.00 per pen. This move, he assures, would increase the sales to 38,000 units per year. What effect would it have on the profits?
Here we see that the contribution margin per pen is (4.50— 3.00) Rs. 1.50 per pen. On reduction in sales price, since variable costs do not change, the contribution margin will be reduced to (4.00—3.00) Re. 1 per pen.
Table given below shows the effect of the proposal on profits.

If the proposal is implemented, the company would incur a loss of Rs. 2,000 against the current profit of Rs. 2,000. Hence, v the proposal should not be accepted.
It should be noted that such an analysis would not have 7 been possible if costs were not classified as variable and fixed.
Knowledge of the break-even point and the underlying functional relationships between costs, volume and profit is very useful for profit forecasting and planning. Break-even chart can be used for flexible budgeting—budgets for favourable, poor and probable business conditions.
We can predict profits at alternative sales volume. We can predict costs and revenues at alternative levels of output. The effect of price changes (or in product mix) on the total profits can be measured. We can also measure the effect of cost changes on break-even point.