
Everything you need to know about capital budgeting methods.
Some of the capital budgeting methods are:-
1.Traditional Methods 2.Modern Methods
1. Traditional methods includes: a.Payback Period Method (PBP) and Its Variants – Post back period, Post payback profitability method, Discounted payback period b.Accounting Rate of Return Method (ARR)
ADVERTISEMENTS:
2. Modern methods includes: a.Net Present Value (NPV) b.Profitability Index (PI) or Benefit Cost Ratio (BCR) c.Internal Rate of Return (IRR)
Traditional and Modern Capital Budgeting Methods: Accounting Rate of Return, Payback Period, Net Present Value (NPV), Internal Rate of Return (IRR) and More..
Capital Budgeting Methods: Traditional Methods and Discounted Cash Flow Techniques
The techniques of capital budgeting can be broadly classified into two broad categories:
(A) Traditional Methods which contain following methods
(i) Average Rate of Return (ARR)
ADVERTISEMENTS:
(ii) Pay Back Method (PB)
(B) Discounted cash flow techniques which contain the following methods –
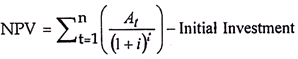
(i) Net Present Value Method (NPV)
(ii) Internal rate of return Method (IRR)
ADVERTISEMENTS:
(iii) Modified Internal rate of return Method (MIRR)
(iv) Profitability Index Method (PI)
These methods are briefly explained below:
Method # A. Traditional Methods
I. ARR Method
ADVERTISEMENTS:
Under this method, the average rate of return using accounting profits is evaluated for the life of the project and the same is divided by the average investment as shown below:
ARR = (Average Profit after tax / Average Investment) x 100
Where,
Avg. Invst. = 1/2(Initial Cost-Salvage Value) + Sal. Value + Increase in N.W.C.
ADVERTISEMENTS:
The averaging process of investment is based on straight line method of depreciation in which the book value of the asset gradually declines to zero from its purchase price. Therefore, if we presume that there is no salvage value and Net working capital, then the above formula of average investment would be given as
Average Investment = 1/2(Initial Cost)
This shows that average investment is half the purchase price.
Now, if we take the effect of salvage value and no working capital, the above formula would be written as
ADVERTISEMENTS:
Average Investment = ‘/^(Initial Cost-Salvage Value) + Salvage Value
This signifies the initial cost would be reduced by the extent of salvage value for average purposes and the salvage value would be recovered at the end of economic life of the project. Likewise, if there is any increase in net working capital, though it will not effect the cost of machine, however, it will be released at the end of the economic life of the asset.
Thus, the amount of working capital which gets released at the end of the economic life of the asset shall be added to the average investment.
Under this method, accounting profits are used and not the cash flow after tax.
ADVERTISEMENTS:
Accept-Reject Rule
If the average rate of return calculated using this method is above the desired rate of return, the project is accepted otherwise it is rejected.
For example, the company has stipulated a cut off rate of 25%, then only those projects which will have an average rate of return greater than 25% would be accepted and those having less than 25% would be rejected. Further, it can also be used for ranking the proposal on the basis of return offered by them.
Merits And Demerits Of ARR Method
Merits
(a) The method is simple to understand and use.
ADVERTISEMENTS:
(b) It is an easy method in terms of calculations. The main inputs required for the purpose of calculation are accounting profits, initial cost of the proposal, salvage value and increase in working capital. All these figures are easily obtainable, therefore, the average rate of return can be easily calculated.
(c) This method takes into account economic benefit linked with the project throughout its life. Thus, the method is better than payback period which is concerned with the economic benefits of the project upto the recovery of cost of the project.
Demerits
(a) It makes use of accounting profits which ignore number of non-cash items and are also subject to change depending upon different methods of depreciation employed or valuation of invention.
(b) This method gives its result in terms of percentage return as a result of which it ignores profitability in absolute terms. For example, in the under-mentioned cases, both the proposals are equally ranked according to this method but proposal B is better as it gives more return in absolute terms
(c) It ignores the concept of time value of money and therefore it ignores the importance of magnitude of the cash inflows generated from the project along with the timing.
ADVERTISEMENTS:
For example, in the under-mentioned cases, both the proposals are equally ranked according to this method as both the projects are offering same amount of return but proposal B is better, as it gives higher return in the initial years which can be reinvested for generating more return.
II. Payback Method
Under this method, the time period within which the initial investment of the project is recovered is calculated. Projects having shorter pay back period are preferred over the projects having long pay back period.
For example, if there are two projects, one is having pay back of 5 years and other is having pay back of 7 years, then the project having payback of 5 years is preferred over the project having payback of 7 years as in the former case, the amount of investment is recovered in a short span of time.
This method is being widely used and it is more popular in firms having liquidity problems. Further, it should be noted that payback period makes use of cash flows after tax and not the accounting profits. There can be two type of situations – Annuity and Mixed Stream of Cash Flows.
Accept-Reject Criteria
ADVERTISEMENTS:
If the payback period of the proposal under consideration is less than the predetermined pay back period, the proposal shall be accepted otherwise rejected. Further, pay back period can also be used for the purpose of ranking the project. The project having shortest payback period is ranked number one and so on the other projects are ranked.
Merits And Demerits Of Pay Back Period
Merits
(a) It is simple to use and understand.
(b) Unlike the case of ARR method, it takes into account the cash flows instead of accounting profit.
(c) Since the method is more popular for short term projects, it automatically eliminates the risk of obsolescence.
ADVERTISEMENTS:
Demerits
(a) It does not take into account cash inflows of the entire period of the project and therefore it may give misleading result. For example, consider two projects A and B having life of 5 years, with following additional details
In the above case, Proposal A is better than Proposal B as it has shorter pay back period of 2 years relative to payback period of 3 years of proposal B. But, proposal B has certain additional large cash inflows in the later years which have not been taken under consideration.
(b) It ignores the concept of lime value of money and therefore ignores the magnitude and timing of the cash inflows. For example, consider two projects A and B having life of 5 years, with following additional details.
According to pay back period method, both the projects are equally good as both are giving equal amount of pay back period i.e., 3 years. However, when these projects are viewed in the light of time value of money, Proposal B is better than Proposal A as it gives higher cash inflows in the initial years which can be reinvested and more return can be generated an it.
It should be treated as a constraint to be satisfied than as a profitability measure to be maximized. These facts become more clear from the importance of the pay back in certain unique situations which are given below:
ADVERTISEMENTS:
(a) Firms facing liquidity crises
The firms which have a shortage of cash often prefer investments which ensure timely return of their initial investment. In case of such firms, the payback method finds more suitability than other techniques of capital Budgeting.
(b) Firms which have short term investment horizon
Sometimes the objective of the firm is to invest the funds for short period of time, generally not exceeding three years. In such situations, pay back method finds superiority over the other methods.
(c) Investment in Politically disturbed situations
Sometimes a firm may invest its funds in areas which are inherited with some kind of disturbance, in such case the main objective of the firm is to ensure return of at least the funds invested by it. hi such situations also, pay back method is preferred.
Method # B. Discounted Cash Flow Techniques
I. Net Present Value (NPV) Method
Under this approach, the cash outflow associated with the project is deducted from the sum of present values of cash inflows.
In case of non-conventional cash flow, when cash outflow occurs more than once, NPV is given as:
If NPV is zero, it is indifferent. However, practically such projects are not accepted as the objective of the financial management to maximise the shareholder wealth.
If there are number of given projects involving same amount of investment, then they can be ranked on the basis of their amount of NPV. The project having highest positive value of NPV would be ranked as number one and so on the remaining projects would be ranked.
Steps Involved In Calculating Net Present Value
Step 1- First of all calculate the cash outflow linked with the proposal. Cash Outflow associated with any kind of project can be calculated using the following formulae
Cash Outflows
Cost of New Machine
+ Installation Cost
+/- Increase/Decrease in Working Capital
– Proceeds from the sale of old machine
-Investment allowance
+/- Payment/Saving in Tax liability.
Resultant figure would be the cash outflow of the project
Note: The point relating to proceeds from the sale of old machine and payment/saving in tax Liability will arise only in case of problems involving replacement of old machine with the new one.
Step 2 – Calculate cash flow after tax for each year and find out their present values using the appropriate discount rate.
The proforma for the same is shown below:
Step 3 – Take the sum of all present values of cash flow after taxes and subtract cash outflows from it. The resultant value is the net present value.
Other Important Points
(a) Whenever information pertaining to increase or decrease in working capital would be given in the question, it will have impact at two places i.e. Calculation of Cash Outflows and Terminal Cash flow after tax (CFAT).
(b) Similarly, whenever information pertaining to salvage value/scrap value is given in the question, it will have impact at two places i.e., calculation of depreciation and terminal Cash flow after tax (CFAT).
(c) There can be payment of taxes as well as saving in tax liability depending upon the sale price of the old machine. If the old machine is sold at price above its book value, there will be profit on its sale and it would lead to increase in tax liability. But if the old machine is sold for a value lower than its book value, there will be loss on its sale and it would lead to savings of tax liability.
Merits And Demerits of NVP Approach
Merits
(a) It takes into account the concept of time value of money and therefore perfectly matches the requirement of wealth maximization approach of the financial management.
(b) It considers all the cash flows generated during the life time of the project.
(c) The method is best suited for mutually exclusive projects.
(d) It provides easy mean to incorporate risk element in the project evaluation by altering the discount rate or the cash flows.
Demerits
(a) It is difficult to use and requires more skills far being used.
(b) In this case, the cost of capital is used to discount the cash flows. A slight error in the calculation of cost of capital, which is difficult to calculate, may give false results.
(c) The NPV method gives results in absolute terms. As a result of this, the NPVs of the two projects are comparable only if the cash outflow of the two are same.
For example, consider the two projects-A and and B with following details:
If one looks at net present values only without looking at cash outlay, he would say Project B is better but when the cash outflows are also taken into consideration, it would be revealed that in terms of percentage return, project A is better.
Ii. Internal Rate Of Return (Irr) Method
Internal rate of return is theoretically defined as the rate at which the present value of cash outflows is equal to the present value of cash inflows. In other words we may say that IRR is that value at which NPV of the project is zero.
It is also known as yield on investment, marginal efficiency of capital, marginal productivity of capital and rate of return.
Accept-Reject Rule
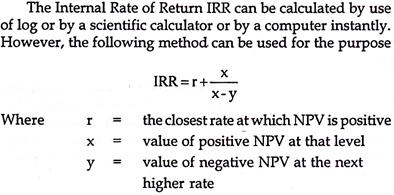
For acceptance or rejection of a project, the calculated value of IRR is compared against the given cost of capital. If IRR is greater than the cast of capital, the project is selected and if it is less than the cost of capital, the proposal is rejected. The method of calculating IRR differs in case of project having cash inflows in form of annuities and mixed stream of cash inflow.
Calculation of IRR in case of Annuities
(a) Calculate payback period of the project.
(b) Move row wise against the life of the project to find two values one greater and other smaller than the pay back period.
(c) Note down the two values and also the interest rates corresponding to them. The value smaller than pay back period will be designated as DFrL and the interest rate corresponding to it will be rL Likewise for the value greater than the pay back period, these values will be designated as DFrH and rH respectively.
(d) Using the aforesaid values, the precise value of the IRR can be calculated using the formula given below:
Calculation of IRR In Case of Mixed Stream of Cash Flows
(a) Calculate average cash flow after tax and find the fake pay back period of the project.
(b) (PVAF), move row wise against the life of the project to find two values one greater and other smaller than the payback period.
(c) Note down the two values and also the interest rates corresponding to them. The value smaller than payback period will be designated as DFr; and the interest rate corresponding to it will be rL. Likewise for the value greater than the payback period, these values will be designated as DFrw and rH respectively.
(d) The values so observed are to be subjectively decreased or increased depending upon the relationship between the pattern of actual cash flows and average cash flows. If the actual cash flows are higher in the initial year and lower in the subsequent years, adjust a few percentages upwards. In case of a reverse situation, adjust a few percentages downwards.
(e) Using the aforesaid values, the precise value of the IRR can be calculated using the formula given below :
Merits And Demerits Of IRR
Merits
(a) It takes into account the concept of time value of money and therefore perfectly matches the requirement of wealth maximization approach of the financial management.
(b) It considers all the cash flows generated during the lifetime of the project.
(c) It is easier to use. It can be used even by the non-technical persons as it simply involves comparison of the internal rate of return with the cost of capital whereas even in case of NPV method, even if the NPV is positive, other facts such as size of investment etc., are to be considered.
(d) If the projects are qualified on the basis of IRR metl^d only, the share price of the company will always tend to rise as it is compared with the required rate of return for the purpose of accepting or rejecting the project. The project stands to qualify only if its IRR is more than the required rate of return of the investor.
It implies all the investment would yield more than the expected return of the shareholders and therefore the share price of the company will always tend to rise.
Demerits
(a) It involves complex method of calculation.
(b) Under the IRR method, it is presumed that all the intermediate cash flows can also be reinvested at the IRR. For example, if project A has IRR of 18% and the life of project is 10 years, it implies that the cash flow received in the first year can be reinvested at the rate of 18% for remaining nine years.
Likewise, cash flow received in the subsequent years can also be reinvested at the rate of 18%. This presumption does not hold good in actual practice.
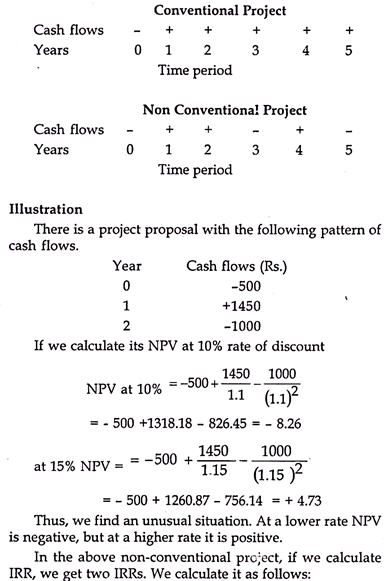
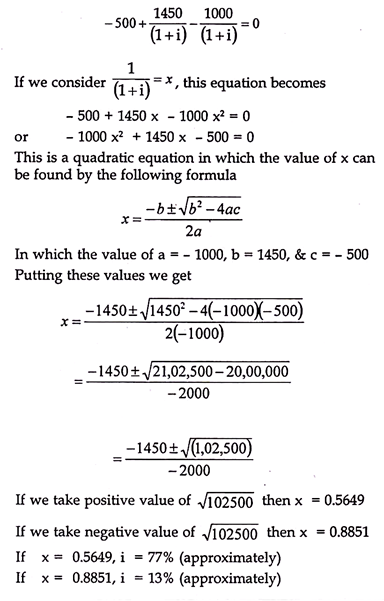
(c) In case non-conventional cash flows, there may be indeterminate or multiple IRR as can be seen from following example:
For example, there is project involving cash outflow at time ‘t’ = 0 and time ‘t’ = 2.
Cash Inflow takes place at time t = 1
Sometimes, we may have indeterminate value of IRR as shown below:
There is cash outflow at time 7 = 0′ and time 7 = 2′ and cash inflow at time 7 = 1′.
The IRR in this case would be calculated using equation given below :
i.e., indeterminant value of IRR.
Other Important Points
Pay back period and Internal rate of return have reciprocal relationship i.e.,
IRR = 1 / Payback period
This relation holds good when the following two conditions are satisfied:
(i) The useful life of the project should be at least twice the pay-back reciprocal.
(ii) The cash inflows should be uniform over the life of the project/asset.
NPV and IRR methods, both, come under discounted cash flow technique. Both the methods considers the time value of money but these methods differ in certain aspect and give conflicting results also in some cases.
The similarities and dissimilarities between NPV and IRR are discussed below :
Similarities in the Results under NPV and IRR
Both the methods would give identical results in the following situations:
(i) When the projects have conventional cash flow i.e., one time investment followed by future stream of cash inflows.
(ii) When the projects are of independent nature i.e., acceptance of one does not result in rejection of others.
The reason why identical results would be given in the above cases can be explained through a diagram. Before we proceed further, we must recall that in case of NPV, the project is accepted if it is greater than zero otherwise it is rejected. Also, in case of IRR, the project is accepted if its IRR is greater than the cut off rate and otherwise it is rejected. When NPV is zero, IRR is equal to the discount rate or the cost of capital, as can be observed from Figure 3.3.
NPV is represented by Y axis and the cost of capital K is represented by X-axis. When K = 0, NPV is maximum. As ‘K.’ increases, the value of NPV starts decreasing and it becomes zero when K = 10. This implies IRR in this case is 10% because when IRR is equal to the discount rate, NPV = 0. When discount rate is less than IRR i.e., when it is in the range of 0% to 10%, NPV is positive as can be seen from the shaded part of the diagram.
Thus, as long as discount rate is less than IRR, the project shall be accepted as it gives positive NPV as well as IRR is also greater than discount rate. . When the discount rate is more than IRR i.e., let us say discount rate is 15%. At this value, the NPV is negative, therefore proposal shall be rejected.
The above details are summarized below :
Dissimilarities in the Results under NPV and IRR
NPV and IRR methods may give conflicting results in case of mutually exclusive projects, Such conflicting results may be due to any of the following reasons:
(a) Size disparity problem i.e., the project involves different cash outlay.
(b) Time disparity problem i.e., the project may have unequal lives.
(c) The projects may have different pattern of cash flows,
However, it should be remembered that whenever conflicting results are given by NPV and IRR, one should follow the recommendation of NPV because the objective of financial management is to maximize shareholder’s wealth.
IRR provides the rate of return on the investment and not the yield on investment whereas NPV provides the yield on investment which is more compatible with the objective of shareholder’s wealth maximization.
The above cases have been explained below using examples.
Size Disparity Problem
Consider two projects A and B, which are mutually exclusive in nature, having one year time horizon :
In terms of IRR, B is better than A but in terms of NPV, A is better than B because it has higher NPV Thus, conflicting results are being given by the two techniques of capital budgeting. In such a situation, NPV is preferred over IRR because the objective of firm is to maximise the shareholders’ wealth. This can be understood from the following explanation.
If the firm’s cost of capital is 25% then the firm would be left with [15000 – (10,000 + 25% of 10,000)] = Rs. 2,500 after one year in case of project A and Rs. [9,500 -<6,000 + 25% of 6,000)] = Rs. 2,000 in case of project B. Thus, the firm would be left with more funds in case of project A.
This implies that the firm would be left with more funds even after repayment of principle and interest on the same.
Time Disparity Problem
Sometimes the NPV and IRR of the two mutually exclusive proposals having same outlay or different outlay may give conflicting results because of difference in timing of receipt of cash inflows from the projects. A project which is giving higher cash inflows in the initial years will be preferred over the project giving higher cash inflows in the later years when it is evaluated using NPV method of capital budgeting.
As can be observed from the above details of the project A and B, project A has higher value of NPV than project B but lower value of IRR. Therefore, when evaluated in terms of NPV, project A is better whereas when evaluated in terms of IRR, project B is better. The conflict in the ranking of mutually exclusive proposal has arisen due to presence of different reinvestment rate assumptions in the two techniques.
The NPV approach assumes that the cash inflows received will be reinvested at the rate of 10% i.e., at a given cost of capital whereas IRR approach assumes that cash inflows received will be reinvested at the internal rate of return. The assumption made under IRR approach is not realistic as the reinvestment rate in some cases may be significantly higher than the cost of capital and it may not be feasible to reinvest the funds at that rate.
Proposals with Unequal Lives
A decision maker may come across mutually exclusive projects having different lives. Such projects may also give conflicting results in terms of NPV and IRR.
As can be observed from the above details, project A is better than project B when evaluated in terms of NPV whereas when evaluated in terms of IRR project B is better than project A. In such cases, as already mentioned above, project A shall be preferred over project B as it is better in the light of NPV approach.
The decision given by NPV is preferred over the decision given by IRR method because of the following reasons :
(a) Under the NPV method, it is assumed that the cash inflow received can be reinvested at the rate of cost of capital whereas under the IRR method it is assumed that cash inflow received can be reinvested at the internal rate of return.
The assumption made under IRR approach is not logical and realistic therefore NPV approach shall be preferred.
(b) In case of mutually exclusive project, NPV technique would always give correct ranking as the basis used is the absolute amount of net addition to the wealth of shareholders whereas the IRR approach fails to give correct ranking of the project.
(c) The NPV approach accepts the projects which have reinvestment rate of return higher than the cost of capital whereas IRR approach accepts those projects which have reinvestment rate higher than the implied rate.
Calculation of IRR of Project X
Step I : Fake Annuity = [ 35+80+90+75+20] / 5 = 60
Step II : Fake payback period = 200/60 = 3.333
Step III : Using table A4 [present value of annuity] and life of the project, we have two approximate rates 15% and 16%.
Using formula
IRR = Lower rate + [(NPV at lower rate / Difference in NPV)] x [Difference in rates] IRR = 15% + [2/99 / (2.99 – (-1.78))] x | = 15.63%
Calculation of IRR of Project Y
Step I : Fake Annuity = [ 218+10+10+4+3] / 5 = 49 Step II : Fake payback period = 200/49 = 4.081
Step III : Using table A4 [present value of annuity] and life of the project, we have two approximate rates 18% and 19%.
Using formula
IRR = Lower rate + [(NPV at lower rate / Difference in NPV)] x [Difference in rates] IRR = 18% + [1.29 / (1.29 – (-0.63))] * 1 = 18.67%
Project X will be preferred as it has higher NPV than project Y. NPV method is preferred over IRR method because of the reasons mentioned earlier in this section.
Modified Internal Rate Of Return
In case of Internal rate of return and Net present value methods of capital budgeting decisions, it is assumed that the cashflows received during the life time of the project are reinvested again .
In case of IRR , it is assumed that this reinvestment is done at the rate of IRR of the project whereas in case of NPV method , it is assumed that the reinvestment is done at the cost of capital. This assumption of reinvestment may not hold good in actual scenario and therefore it acts -as limitation for these two techniques.
In order to overcome this limitation, the decision maker can use of Modified Internal rate of return (M1RR) method. Modified internal rate of return (MIRR) is an improved version of the internal rate of return (IRR) approach to capital budgeting decisions.
It does not require the assumption that the project cash flows are reinvested at the IRR rather it is calculated with any reinvestment rate as desired by the decision maker.
Decision rule: Projects with MIRR greater the project’s hurdle rate should be accepted. In case of mutually exclusive projects, the project with higher MIRR should be preferred.
Profitability Index Method
In our standard practice of evaluating capital budgeting decisions, unfortunately some potential biases are created. For example, if we are considering mutually exclusive proposals and the assets (e.g., machines) cost different amounts, there is a potential bias in favor of accepting the more expensive asset, simply because of the larger size.
Consider the following situation:
Asset A, which cost Rs 100,000 and has an NPV of Rs 15,000, and
Asset B, which cost Rs. 200,000 and has an NPV of Rs. 20,000.
If our decision is based solely on the NPV of these project, we would choose asset B since it has the higher NPV. However, per rupee invested, asset A obviously has the higher return.
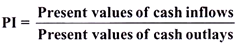
This implies, if the cost of the two assets differ by a considerable amount, we should use the profitability index instead of the NPV to make our decision. The profitability index, by definition, is the ratio of the present value of the benefits (PVB) to the present value of the cost (PVC).
We obviously prefer to invest in the asset that has the higher value for the profitability index.
Under this method, the ratio of present value of cash inflows to the present value of cash outflow is calculated and the decision regarding acceptance or rejection depends on the fact whether the ratio is greater than 1 or less than 1.
The formula is given as under:
Merits And Demerits Of The Pi Method
Merits
(a) It is simple to use and understand.
(b) It takes into account the concept of time value of money and therefore perfectly matches the requirement of wealth maximization approach of the financial management.
(c) It considers all the cash flows generated during the lifetime of the project.
Demerits
(a) In this case, the cost of capital is used to discount the cash flows. A slight error in the calculation of cost of capital, which is difficult to calculate, may give false results.
(b) Under this method, it is presumed that all the intermediate cash flows can also be reinvested at the discount rate being used. For example, if project A has discount rate of 15% and the life of project is 5 years, it implies that the cash flow received in the first year can be reinvested at the rate of 15%.
Likewise, cash flow received in the subsequent years can also be reinvested at the rate of 15%. This presumption does not hold good in actual practice.
Capital Budgeting Methods – Payback Method, Average Rate of Return and Internal Rate of Return (With Illustrations)
This will present three methods of ranking alternative investment proposals. Each attempts to determine analytically an array of investment opportunities which would be profitable for the firm.
In today’s world, many capital decisions are made only out of necessity, without any consideration given to profitability. Many firms have no formal evaluation process by which future investment alternatives that may add to the wealth of the firm and to the wealth of the shareholders can be examined.
Management is so involved in the day-to-day operations of the firm that it loses sight of its goal structure and makes investment decisions solely on what is termed the degree of necessity.
This situation can arise when repairs are necessary on the equipment or the plant, or major alterations in a product line are needed to keep revenues coming in.
In these situations, management leaves no room to consider the contribution of the equipment, plant, or product line to the overall goal and profit structure of the firm.
Rather, it makes these decisions to keep sales revenues coming in to meet immediate cash needs.
In a time of narrowing profit margins and increasing competition, it is essential for any firm wishing to achieve its goal structure to employ a formalized capital budgeting process which continually evaluates all aspects of the organization and future investment opportunities.
Ideally, this evaluation process should utilize some of the suggested techniques outlined below:
1. Payback Method:
The payback method of ranking investment alternatives is defined as the number of years it takes to recoup the initial investment for a project. The technique gives preference to investment proposals with the earliest payback periods. It utilizes net cash flow data, as illustrated in Table 5.
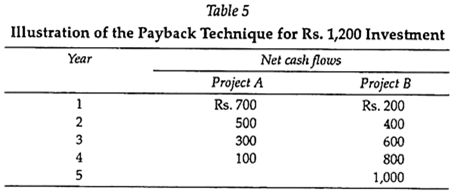
Both projects A and B require an initial outlay of Rs.1,200. The net cash flows shown in Table 5 indicate that project A would have a payback period of two years, while project B would have a payback period of three years.
This was determined by counting the number of years it takes to recover the initial outlay of Rs.1,200 through the net cash flows. The data in the above example indicate that project A is preferable to Project B because the payback period is shorter.
Though this technique is utilized frequently in American business, it has two major drawbacks. The first is that it does not take into account the earnings over the entire life of the project. In the above example, project A was preferred to project B, yet the revenue pattern for A stopped after the fourth year, while that of B continued, with net cash flows increasing through the fifth year.
The second drawback is that the pay-back method does not consider the time value of money. Though the technique does favor the earliest recapture of the investment, there is no formal process by which weights can be assigned to the cash flow stream, as is done in the concept of present value. As a result, we cannot design a preference structure which shows that rupees today are worth more than dollars in the future.
In the past, defense of the payback method has centered around the fact that revenue streams in the future face great uncertainty, and projects that return an early payback eliminate some of that uncertainty. Another defense of the payback method is that the immediate need for cash to keep the firm running, automatically gives preference to earlier payback projects. In reality these are not valid defenses but rather excuses for not utilizing a more sophisticated procedure for running the firm.
There are numerous techniques for handling the problem of uncertainty in cash flow streams. In addition, better forecasting and budgeting procedures are needed so that the firm can be aware of future cash squeezes in advance and not be forced to accept projects solely for their immediate cash contribution.
2. Average Rate of Return:
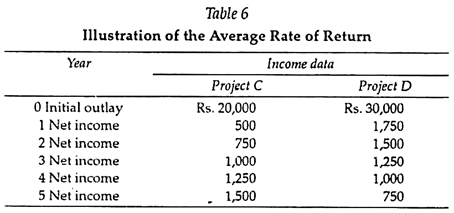
One method of ranking investment alternatives is primarily an accounting method consisting of a ratio of the average annual profit after taxes to the average net investment. Table 6 presents income data for projects C and D, which will be utilized in the calculation of the average rate of return (ARR).
Following equation shows the format for solving the average rate of return-
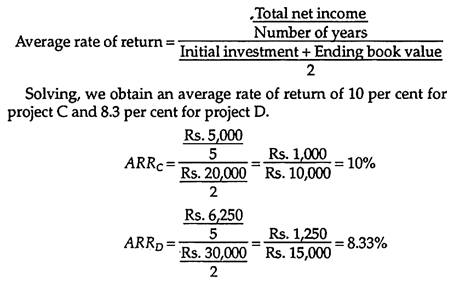
On the basis of this analysis, project C is preferable to project D.
One advantage of this method over the payback method of ranking investment alternatives is that the average rate of return does consider the earnings over the entire life of the project. However, there are two strong criticisms of the average rate of return. The first is that the concept does not take into account the time value of money.
This is clearly evident by the fact that project C is preferred to project D, yet project D is the one with heavier inflows during the early life of the project. The second criticism is that the technique utilizes profit after taxes as an accounting concept and does not consider the net cash flows of the project.
Thus the average rate of return, like the payback method, leaves much to be desired as a technique by which to evaluate alternative investment proposals.
3. Internal Rate of Return:
The internal rate of return (IRR) method of ranking alternative investment proposals is the first method we will be discussing which incorporates the concept of the time value of money.
Recognizing that a rupee today is worth more than a rupee tomorrow, this technique utilizes the concept of present value in the calculation process. Thus the concepts of the present value of a lump sum and the present value of an annuity are applied to the IRR ranking method.
Formally defined, the internal rate of return is that rate of discount which equates the present value of the net cash flows with the present value of the investment.
The equation for the internal rate of return can be shown as:
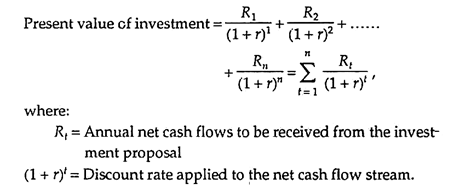
If an even series of net cash flows is being dealt with, solving for r is fairly simple. Assume we are interested in determining the internal rate of return for a project that cost Rs.15,000 today and is expected to return Rs.5,000 in net cash flows each year for four years.
The format for this problem is shown in following equation:
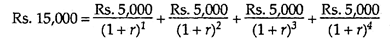
To find the internal rate of return, we divide the cost by the annual net cash flows and obtain the table interest factor (Rs.15,000/Rs.5,000 = 3). Then we look in the present value of an annuity table under the row of present value factors for four years and read across the row until we find the closest interest factor calculated in this table.
Then read up the column to the top where the discount factors are listed. The internal rate of return is close to 12 per cent. The steps outlined show how to interpolate to find the exact rate of return, which is 12.6 per cent.
Various Methods of Capital Budgeting (With Calculations)
Various methods of capital budgeting are as follows:
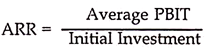
Method # 1. Accounting Rate of Return:
The Accounting Rate of Return also called the Average Rate of Return (ARR) is the average of the rate of return for different years for the whole life of an asset. It is a ratio between the Profit before Interest and Tax (PBIT) and the amount of initial investment made in the project.
Acceptance and Ranking Rule:
When we adopt ARR as the decision criterion, then the acceptance rule is that the calculated ARR should be greater than some specified rate. We will reject those proposals which have an ARR lower than this specified rate. So far as ranking of projects is concerned, the project with a higher ARR should be ranked higher than other a project which has a lower ARR.
Evaluation of ARR Method:
The ARR method is a relatively simple method involving the calculation of averages. It is also based on easily understood accounting information like PBIT/PAT, depreciation, investment etc. However, when it is evaluated for its suitability as an investment criterion for making long term investment decisions, we find it deficient in several respects. Firstly, it is ill defined; we do not know whether to use PBIT or PAT; Initial Investment or Average Investment.
Each variable will give different values of ARR. Secondly; accounting information itself is not very certain and subject to great manipulation. Thirdly, the average of income, whether PBIT or PAT ignores time value of money and, hence, not suitable for scientific decision making, and lastly, the bench-mark rate, against which the calculated ARR will be compared is arbitrary and there is no scientific basis for its determination.
Method # 2. Payback Period:
The Payback period, also called ‘payout period’ by some authors, is the time duration required to recover the initial cash outflows. This method is based on cash flows and not on accounting data like the ARR.
Ordinary people not well versed in appraisal techniques, often use very simple technique to judge the profitability of any investment proposal. They think in terms of initial expenditure (outflow) and the time duration in which this amount can be recovered. Suppose, somebody spent Rs.50, 000 on any project and expects that within 3 year he can get back this amount, then the payback period is 3 years.
Payback period of any proposal can be calculated as follows:
Evaluation of Payback Method:
It is a simple method in concept and understanding that is why even lay men can understand and use it with ease. Moreover, since its emphasis is on early recovery of investment, it automatically takes care of risk. Projects with smaller payback are considered safer and secure as compared to the projects with longer payback. The payback method, however, suffers from some serious drawbacks.
Firstly, it takes into account only early cash flows which determine the payback and ignores those which come later. This may often lead to wrong conclusions.
Discounted Payback:
The concept of discounted cash flows for calculating payback period has emerged in recent years. It is suggested by some authors that in order to overcome the limitation of payback that it does not use time value of money, we may use the discounted cash flows in order to calculate the payback period. Obviously, the discounted payback will be longer than the simple payback period.
Method # 3. Net Present Value (NPV):
It is the net present value of all the cash flows that occur during the entire life span of a project – The outflows will have negative values while the inflows will have positive values. Obviously, if the present value of inflows is greater than outflows, we get a positive NPV and if the present value of outflows is greater than inflows, we get a negative NPV.
The positive NPV means a net gain in value maximization and, therefore, any project which gives a positive NPV is an acceptable project and if it gives a negative NPV, then the project should not be accepted.
NPV can be expressed as follows:
Acceptance Rule & Ranking Rule:
The acceptance rule for NPV is very simple. If the NPV is positive, then the proposal should be accepted and if it is negative, then it cannot be accepted. Ranking rule for NPV is not so simple. For same size projects, the ranking rule is simple, higher the NPV, higher shall be ranking of the project. But for unequal projects this rule cannot be applied.
Interpretations of NPV:
NPV is the absolute value of a net gain in future. This may be treated as a net addition to the value of the firm and, therefore, is also called unrealized capital gain. Another interpretation of NPV is that it represents the maximum price that a firm should pay for foregoing the right to undertake the project or to sell the project to some other party.
It also represents the amount that a firm could raise from the market at given rate of interest, in addition to the initial cost of the project, and ensure that this will be paid off from the receipts of the project.
For example; a firm is undertaking a project at a cost of Rs. 50,000 with a positive NPV of Rs. 10,000. In this case, the firm cannot borrow merely Rs. 50,000 to meet the initial cost, but can also raise Rs. 10,000 (for any other purpose) and be rest assured that this sum with interest can be paid off from the proceeds of the given project.
Properties of NPV:
The NPV method is a very scientific and an appropriate technique of capital budgeting and is, therefore, widely used for investment decision making.
The following properties can be identified:
(i) It is based on cash flows over the entire life of project.
(ii) It considers time value of money.
(iii) It is an absolute value.
(iv) It possesses the property of additions, i.e., the total NPV of two projects is the summation of their individual NPVs.
(v) NPV for different rates of interest can be found separately,
(vi) It allows different rates of interest for different time period in the life of a project.
Limitations of NPV:
The NPV method, though very good, suffers from the following limitations:
(i) It gives the absolute value and therefore, comparison between two different projects is not easy, especially when they are of different sizes.
(ii) Many a times, it is not possible to know in advance the rate of interest at which discounting is to be done. Similarly a given NPV may not be appropriate if the rate of interest has changed.
(iii) It may lead to wrong decision making especially when limited funds are available and we have to choose between different options.
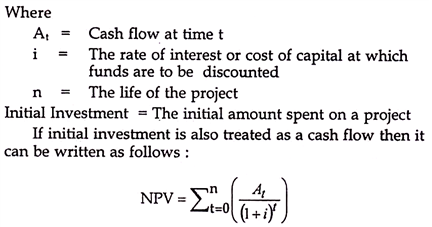
Benefit-Cost Ratio or Profitability Index (P.I.):
NPV is an absolute value and therefore is not appropriate for comparing the relative profitability between different projects. In order to overcome this limitation of NPV, we make one modification in it to make it a relative measurement. This is called Profitability Index (P.I.) or Benefit Cost Ratio (B-C Ratio).
Acceptance Rule & Ranking Rule – If the P.I. is greater than 1, then the project is to be accepted and if it is less than 1, then it is to be rejected. However, if we have several projects, then the project with a higher P.I or B.C ratio should have a higher ranking.
Method # 4. Internal Rate of Return (IRR):
The NPV and PI are both based on a given rate of discount and, therefore, the NPV and PI values change as soon as the rate of discount is changing. Hence, any project which is acceptable at, say, 10% rate of discount may not be the same at, say, 12% rate.
Therefore, there is need to find out a technique which is autonomous in itself and is not dependent upon any externally determined rate of interest. This is where the concept of IRR is of great help. To understand it properly, let us see how NPV is affected by changes in rate of discount.
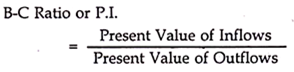
Relationship between NPV and Rate of Discount:
The relationship between, the rate of discount and the NPV can be presented in the above diagram. The above diagram shows an inverse relationship between rate of interest and NPV. At zero rate of interest the NPV is maximum at M level.
As the rate of interest increases, the NPV gradually falls. At R rate of interest the NPV is zero and beyond this, it is even negative. The rate R in the above case is called the Internal Rate of Return (IRR). We may, therefore, say that IRR is that rate of discount at which NPV is zero.
It can be expressed as follows:
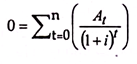
The rate of interest (i) at which the above equation holds good is the IRR.
Acceptance and Ranking Rule for IRR:
The IRR should be greater than the given discount rate (cost of capital) to make a project acceptable. If IRR is less than the cost of capital then, the proposal cannot be accepted, as it will lead to a negative NPV. As far as ranking rule is concerned, since, IRR is a rate of return, the project with a higher IRR should be ranked higher than the other project which has a lower IRR.
Virtues of IRR:
(a) It considers cash flows of projects in their entirety.
(b) It takes into account time value of money.
(c) It is useful in ranking of projects because it is a rate and not any absolute value.
(d) It is independent of any externally determined rate (discount rate or cost of capital), and, hence, ranking of projects will not change with change in cost of capital.
(e) It is particularly useful as it helps a businessman and also a financer in assessing the margin of safety in a project.
(f) It is more appealing to the businessmen who are used to thinking in terms of cost and return.
NPV vs. IRR:
Both NPV and IRR are considered scientific techniques for a project’s financial appraisal and both are commonly used. Both the techniques would ordinarily lead to same conclusion. The NPV is an absolute value of a gain or loss, while IRR is a rate of return from a given investment and, therefore, more appropriate for comparison between different project proposals as well as between a given IRR and different costs of capital. However, IRR is also not perfect.
It has the following limitations:
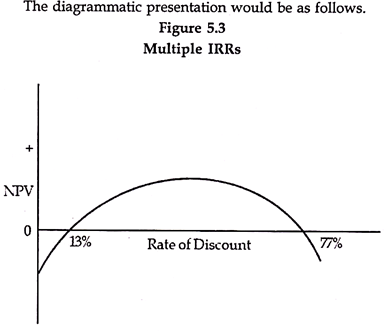
1. The biggest problem with IRR is that it is not uniquely defined and we may get more than one IRR in some cases. For this purpose we may divide projects in two categories- conventional projects and non-conventional projects. Conventional projects are those projects where there is only one change of sign for the cash flows. There are initial outflows followed by continuous inflows.
The non-conventional projects, on the other hand, are those projects in which there is more than one change of sign i.e. initial cash outflow followed by some inflows, followed by some outflow followed by inflows and so on. It is only in cases of non-conventional projects that we may have more than one IRR.
However, it is not essential that every non-conventional project has more than one IRR. This depends upon the quantum and pattern of cash flows. So a project being non-conventional is only a necessary but not a sufficient condition for multiple IRRs.
This presents a problem of interpretation and decision making. However, if we use the NPV technique at a given rate of discount we get a definite value and decision can be taken accordingly.
2. Another problem in using IRR is that it doesn’t distinguish between lending and borrowing. For example, in the following illustration we have two projects A and B, with their cash flows as –
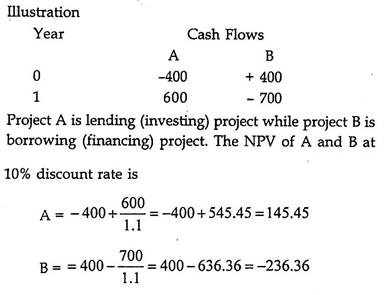
If we calculate IRR of these proposals, it is 50% and 75% respectively, indicating that the project B is better. The reality is that A has a positive NPV while B is having negative NPV, whereas IRR in both the cases is positive.
3. We have said earlier that using NPV and IRR ordinarily leads to same conclusions. But this may not always be so. Sometimes, NPV and IRR give different results especially when the pattern of cash flows is different.
This is explained in the followings illustration:
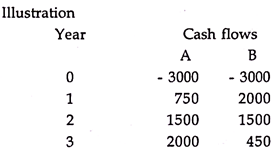
NPV at 10% for A is 424.11 while for B it is Rs. 395.94. Thus, A gives a higher NPV. However if we calculate IRR for the two projects, it is 16.75% and 19.18% for projects A and B respectively. This creates a dilemma. The conflict between the two techniques is mainly due to the differences in the timings of the cash-flows. In project A, higher amounts are occurring in the later years of the projects and its NPV will fall faster in respect of increase in discount rates. In project B the major cash flows occur initially hence its rate of fall is slower.
4. A comparison between NPV, PI and IRR shows that NPV is the best capital budgeting technique because of its conceptual charity and methodology of calculation. It is even better than PI in some respects.
For example:
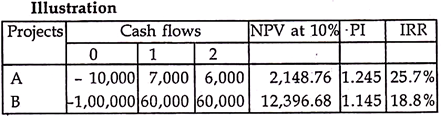
In the above case, project A seems to be superior both in respect to IRR and PI, while project B is better if we go by NPV. In such a situation, decision should be taken on the basis of NPV, (even if other projects have a higher rate of return). This is because the objective of firm is wealth maximization. Project B creates extra wealth of Rs. 12,396.68 while project A creates wealth of Rs. 2,148.76 only.
Hence, NPV rule is always the best when we have to make decision about a specific project or number of projects and when fund constraint is no problem, i.e. funds can be obtained from the market by paying its cost. However, when funds availability is a constraint, i.e. limited funds are available and we have to choose among different alternatives, then obviously NPV cannot work.
Capital Budgeting Methods and Techniques
Under Capital budgeting, there are many methods for evaluating and ranking the investment proposals and to choose the project which is most profitable or economical for investment. These evaluation methods may be broadly classified into two categories and subdivided into 5 categories.
It is better and useful to understand about the pattern of cash inflow required to calculate the values under each technique.
The pattern of cash inflow required to choose the best project will differ under each criterion.
The exact pattern or nature of cash inflow required is shown in the following table:
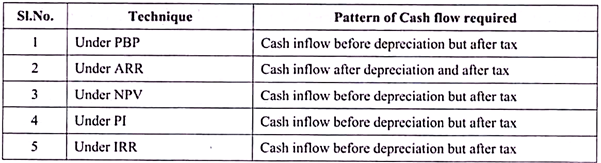
From the above table it is very clear that, except ARR, all the other techniques uses ‘Cash inflow before depreciation but after tax’ as a pattern of cash flow and the ARR alone uses Cash inflow after depreciation but after tax.
Note- Cash inflow of any step may be given in the problem, then just moving further from that stage gives you the Net Cash inflow.
Therefore a detailed discussion of each of the above techniques justifies the pattern of cash flow used to calculate the values and the steps to be followed while calculating the suitable cash inflow. This has been shown under the discussion of each technique.
As shown above, the techniques of capital budgeting are basically classified in to two categories, namely:
A. Traditional techniques, and
B. Discounted cash flow techniques.
Traditional techniques basically are of two types, namely:
(1) Payback period (PBP), and
(2) Accounting Rate of Return (ARR).
Method # A. Traditional Methods:
The traditional methods of capital budgeting techniques basically depend either on period or on accounting profit and do not take into account the time value of money concept or discounting concept to convert future cash inflows into present cash flows.
Basically there are two techniques under traditional methods of project evaluation, namely:
1. Payback Period Method (PBP) and Its Variants
(a) Post back period,
(b) Post pay back profitability method and
(c) Discounted payback period
2. Accounting Rate of Return Method (ARR)
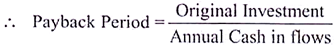
1. Payback Period Method:
Meaning of Payback Period (PBP):
Payback period method is one of the traditional methods of evaluating investment proposals. Payback period refers to the period within which the cost of the project is fully recovered. Hence it states the number of years required to recover the original investment.
Calculation of PBP:
Calculation of PBP depends on the type/pattern of cash inflows generated from the project.
Such Cash flows may be-
(i) Even cash flows (also called annuities) and/or
(ii) Uneven cash flows (also called mixed streams)
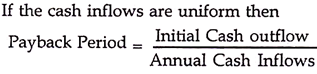
(i) Payback Period in Case Even Cash-Flows or Annuities:
If the project has constant/even/equal annual cash inflows over the life of the asset/project, the payback period can be computed by dividing original investment by the annual cash inflows.
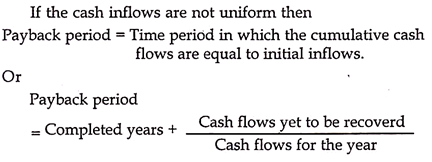
(ii) PBP in Case of Un-Even/Un Equal Cash Inflows or Mixed Streams:
In case the cash inflows are unequal over the life of the project, the payback period can be found out by using the following steps:
i. First calculate the ‘Cumulative Cash flows’.
ii. Then apply the following formula to calculate the PBP-

**Amount still to recover is the difference amount between Original investment and the cumulative amount for the year before full recovery.
Variants of PBP Technique:
PBP technique can be represented with other three forms, called variants of PBP.
They are:
(a) Post payback period
(b) Post-pay back Profitability and
(c) Discounted Payback period
(a) Post Payback Period:
Post payback period refers to that period, which is beyond the payback period over the life of the asset/project. In simple words, it is the difference between the life of the asset and payback period. This period indicates the amount of post back profitability or the cash flows exists after payback period.
The simple equation is, Post back period = Life of Asset – Payback period
(b) Post Payback Profitability Method:
This method considers, total cash flows of the entire working life of the project; unlike the payback period, which considers the cash flows only up to the period, within which the original investment shall be recovered, are considered for evaluating the profitability of the project. The variant of PBP is also known as ‘Post payoff profitability’. This post payback profitability is calculated as;
Alternatively, payback profitability is calculated by using post back period and depreciation, which is equal to the ‘product’ of depreciation and post payback period. Therefore,
Payback profitability = Depreciation x Post payback period.
(c) Discounted Payback Period:
Discounted payback is another variant of the payback period method. Discounted payback period means, it involves discounted cash flows instead of accounting cash flows for calculating the PBP. Under this method, the present values of cash inflows arising at different time intervals are found out and these discounted cash flows are taken as the real cash inflows for determination of the payback period. The same old basic formula is used to find the PBP of even or uneven cash flows of the project.
Project Accept/ Reject Criterion under PBP and Its Variants:
The payback period can be used as a decision criterion to accept or reject investment proposals for making investment on it. Under this method, actual payback period (as calculated by using the formulas under above methods) is compared with predetermined payback period, which is determined by the management or given as life of the project. If the actual payback period is less than the predetermined payback period, accepts the project, otherwise straight away reject the project.
In simple words, lower payback period project is acceptable and the higher PBP is rejected in the case of mutually exclusive projects; where the projects are arranged in an ascending order according to the length of their payback periods & the project which has shortest PBP is acceptable; where as in the case of independent projects, the decision left to the discretion of the management to accept whatever the project they want to invest keeping other criteria’s in mind along with PBP rationale.
Under Payback profitability, Select the projects with higher payback profitability and reject the projects with lower payback profitability is followed.
Merits of Payback Period Technique:
The payback method, being the fundamental/traditional/basic method of project evaluation, enjoys the following merits:
1. Useful in evaluating projects, which involve high uncertainty.
2. This method is simple to understand and easy to calculate.
3. This method prefers original investment in short term projects first.
4. This method makes it clear that no profit arises until the payback period is over.
5. As a decision criterion, period is the sole aspect for decision; hence it is an unambiguous technique.
Demerits of Payback Period Technique:
Though, it is the basis for other techniques, as a decision criterion, but if suffers from the following limitations:
1. It ignores time value of money. It treats all cash flows alike irrespective of their timings.
2. It completely ignores cash inflows after the payback period.
3. It gives importance to liquidity only and ignores the profitability aspect of the projects.
4. It gives weightage to the quantity aspect of cash flows and not quality aspect of cash flows.
Suitability of PBP Technique & Its Variants:
The payback period, post back period and payback profitability methods are suitable in the following cases:
1. When the project required small investment.
2. When the project will complete within a short period.
3. Where the project is productive, as soon as the investment is made.
4. Where the project carrying high risk and only the immediate future can be made.
2. Accounting Rate of Return Method [ARR1]:
ARR is the second traditional technique, depends on the accounting profits, original investment, depreciation and tax. ARR1 is also called as – Average Rate of Return [ARR2] or Return on Investment [ROI] method or Return on Original Investment [ROOI].
Accounting or Average rate of return is ‘the ratio of net earnings to its net investment or average income to average investment’.
ARR is expressed in percentage, has two variants:
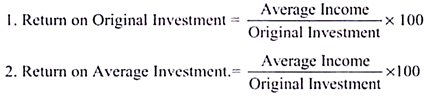
Average Income:
Average Income is the annual profit arrived after deducting the depreciation and tax.
This is calculated by using the following formula:

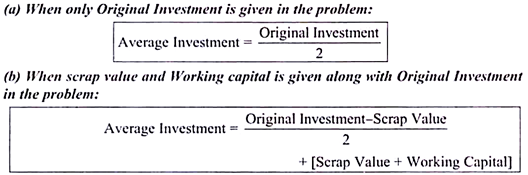
Average Investment:
Average Investment is calculated in either of two ways depending on the information given in the problem.
Accept or Reject Rule:
Accounting rate of return is used as a decision criterion to accept or reject investment proposals. According to the ARR method, the actual ARR is compared with a minimum required rate of return or cut-off rate. If the ARR is higher than the minimum required rate, the project is accepted and if the ARR is lesser than the minimum required rate, the project is rejected.
Merits of ARR:
Accounting rate of return method has the following merits:
1. It is simple to understand and easy to calculate.
2. It is based on historical accounting data of profits, depreciation and tax.
3. Under this method, the benefits associated with the project over its entire life are taken in to account.
Demerits of ARR:
This method is suffers from following drawbacks:
1. It takes in to account accounting income instead of cash flows.
2. It does not take in to account the time value of money. The timings of cash inflows and outflows is a major decision variable in financial decision making.
3. This method does not take in to account any benefits, which can accrue to the firm from the sale of equipment, which is replaced by the new investment.
Suitability of ARR:
This method is more suitable for short-term projects with even flow of cash.
Method # B. Discounted Cash Flow Methods (DCF):
Meaning:
Modern/Time Value adjusted methods/discounted cash flow methods are basically considering the time value of money concept by using the risk adjusted rate or interest rate in order to convert future cash inflows into present cash flows.
There are three discounted cash flow methods which were discussed in this text namely:
1. Net Present Value (NPV)
2. Profitability Index (PI) or Benefit Cost Ratio (BCR)
3. Internal Rate of Return (IRR)
Unlike, traditional methods – PBP and ARR where both ignores the time value concept, the discounted cash flow methods – NPV, PI and IRR use cash flows instead of accounting profits/earnings. Hence these discounted cash flow methods are superior to traditional methods.
Meaning of Discounting:
The process of converting future cash inflows into present cash flows by multiply them by the discount factor or interest factor is known as ‘discounting’.
Meaning of Discounted Cash Flows:
Discounted cash flows are the present value of cash flows converted by multiplying the future cash flows into present cash flows.
Steps in Discounting Process:
Discounting process basically involve 3 stages in all the discounted cash flow techniques, namely-
1. Calculation of Net cash flows – both inflows and outflows over the entire life of the assets.Net Cash inflows refer to the cash inflow after tax but before depreciation.
2. Discounting the net cash flows by taking the discount factors. (Cash inflow x Discount factor).
3. Aggregating of discounted cash inflows and comparing the total with discounted cash outflows to take the decision with regard to accept the project or reject the project for investment.
Let us discuss each one of the discounted cash flow methods and their application in taking decision by the management of the company. In this text, we have covered three discounted cash flow techniques namely, NPV, PI and IRR.
1. Net Present Value Method (NPV):
Meaning:
Net present value is the difference between ‘the total present values of cash inflows of the different years and present values of cash outflows.’
In simple words N.P.V difference between present values of cash inflows and present values of cash outflows.
NPV method is also called as Excess Present Value method. N.P.V is one of the best methods for evaluating capital investment proposals, since it considers the time value factor to convert the future less valuable cash inflows into present value of cash inflows over the entire life of the asset.
Under this method, present values of cash inflows and present values cash outflows are calculated by taking appropriate discount factor. Then the total present values of cash inflows are compared with total present values of cash outflows to decide the extent of NPV i.e. positive value or negative value and /or highest value or lowest value.
Calculation of NPV:
N.P.V = Total present value of cash inflow – Total present value of cash outflow
Note:
The Present Value of Cash inflows has two dimensions, namely-
(a) Present Value of Annuities or Even Cash flows = Annuity flow x PVAF
(b) Present Value of Mixed Streams or uneven cash flows = Annual Cash inflow x PVF
Accept or Reject Criterion:
The rationale of accepting or rejecting the project lies with two types of projects, namely-
(a) In case of independent projects – Accept any positive NPV project because the acceptance of one project will not result in the rejection of the other. The decision left to the discretion of the management; either they can accept both or any one.
(b) In case of dependent or mutually exclusive projects – The Management can make the choice between the projects in such way that; it can accept only positive or highest NPV project and reject the negative or lowest NPV project. Hence in case of mutually exclusive projects, the acceptance of one will end with the rejection of the other.
Therefore,
Accept the proposal, if N.P.V > 0 and Reject the proposal, if N.P.V < 0
Merits of NPV Method:
The NPV technique of capital budgeting has the following merits:
1. This method is in consistent with the objective of wealth maximization; therefore, maximizing NPV is termed as maximizing wealth.
2. Compared to traditional methods it considers the time value of money to convert the future cash flows into present cash flows.
3. This method takes in to account the profits earned during the entire life of the projects and discounts them into present value.
4. This method is useful for mutually exclusive projects, to judge the more beneficial projects among alternatives.
5. Unlike traditional techniques, NPV technique counts both quality and quantity dimensions of cash flows.
Demerits of NPV Technique:
Though NPV technique of capital budgeting is one of the most preferable and authoritative technique, it suffers from the following Demerits:
1. This method is somewhat difficult to calculate and understand, when compared to traditional methods.
2. This method is not suitable for projects with different economic life and with different amounts of investment.
3. It is difficult to determine the appropriate discounting rate to calculate the NPV.
4. This method is not measuring the size of the projects.
2. Profitability Index [PI] or Benefit Cost Ratio [BCR]:
Profitability Index (PI) is another time-adjusted technique, which supplements the NPV method. PI index indicates the number of times that the present value of cash inflows available to the present value of outflows. If the index is greater than one (1), it is a better indicator/index and if it is lower than one (1) it indicates the lower index.
Meaning:
PI is defined as ‘the ratio between the gross present values of future cash inflows & the gross present values of cash outlays’. This method is also known as the Benefit -Cost Ratio because the numerator (i.e. total present value of cash inflows) measures benefits and the denominator (i.e. total present value of cash outflows) measures costs.
Calculation of PI:
PI is computed by dividing the total present value of cash inflows by the present value of cash outflows. Therefore,
Accept / Reject Criterion under PI:
PI rule states that, when Profitability Index is greater than one, the project is accepted and when profitability index is less than one, the project is rejected.
In a nutshell, PI > 1 = Accepted and PI < 1 = Rejected
3. Internal Rate of Return Method [IRR]:
IRR is another Discounted Cash Flow method for appraising capital investment decisions. It is also called Time Adjusted Return on Investment or Break Even Rate.
Meaning of IRR:
Internal rate of return is that rate at which the sum of discounted cash inflows equals the sum of discounted cash outflows. In other words, it is the rate, which balances the total present values of cash inflows & total present values of cash outflows to zero. In short, it is a rate at which the NPV of the project is exactly zero.
Decision Criteria of IRR:
1. In case of independent project, accept the project when the IRR is more than the cut off rate reject the project when the IRR is lesser than the cut off rate.
2. In case of mutually exclusive projects, accept the project with the largest IRR provided it is greater than the cutoff rate & reject others, which has lower IRR than cutoff rate.
Merits of IRR technique:
The IRR method has following merits:
1. Like NPV, this method also takes in to account time value of money.
2. This method considers the profits over the entire life of the projects.
3. Compared to NPV method, this method does not require the discounting rate. The IRR itself is a break-even rate.
4. The IRR is more realistic and it is inconsistent with rate of interest.
5. This method also is in consistent with wealth maximization objective of the firm.
Demerits of IRR:
The IRR method has the following demerits:
1. It is the most difficult method to calculate and understand investment proposals.
2. The IRR method gives inconsistent results with NPV method if projects are differing in their economic life or cash flows.
Compare & Contrast NPV & IRR:
Both NPV & IRR techniques are, being the time adjusted methods of appraising capital investment project; both of them are having some ‘similarities and distinctions’.
Similarities between NPV & IRR:
Both the methods would give consistent results in terms of acceptance or rejection of investment proposals. In the case of conventional and independent projects (i.e., the acceptance of one does not preclude the acceptance of others) positive (>o) and higher NPV projects are accepted and lower or negative (< o) projects are rejected.
In the same way, IRR will accept the project when its IRR ≥ K (K = required rate of return) and if IRR ≤ K, the project will be rejected. In all the above cases, the two approaches lead to identical results/concurrent results with regard to accept-reject decision.
Distinction between NPV & IRR:
In certain situations, both NPV & IRR will give contradictory results. In case of mutually exclusive investment projects (i.e., the acceptance of an investment precludes the acceptance of others), the NPV method finds one proposal acceptable and IRR favours another.
There are three components, with which both the proposals gives contradictory results; namely:
(i) Size Disparity Problem:
NPV accepts – Bigger size cash outlays and inflows projects due to higher NPV; but IRR will become lower than required rate of return, hence in the above case, IRR will reject the project.
(ii) Time-Disparity Problem:
In the case of pattern of cash inflows generated with same outlay; NPV favours lower initial cash inflows (ascending order) project, but IRR favours descending order cash inflows project.
(iii) Un-Equal Expected Lives:
Both the proposals would give conflicting ranking to mutually exclusive projects when the projects have different expected lives. Project with higher lives would be preferred by NPV and the project with lower life will be favoured by IRR.
Calculation of IRR:
The following important factors should be kept in mind before calculating IRR, they are:
(i) In Case of Even/Annuity Cash Flows:
When cash inflows are equal over the entire life of the asset, the IRR is calculated by referring a factor in the annuity table. The factor is the value of rupee at the given rate of discount in the given period; is determined by dividing the original investment from the cash flow per year and annuity factor should be identified by referring the table along with the given discount rate and for required period.
The formula to find factor is-

X Ltd. has an investment proposal under consideration. The Project costs Rs.30, 000. The Project has 5 years of life with uniform cash inflows of Rs.10,000 per annum. Calculate the IRR.
Solution:
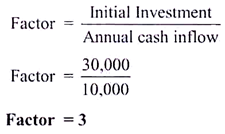
The interest rate can be located by referring the factor 3 in the present value of annuity table corresponding to 5 years column. The factor 3 is lying in between 18% (Rs.3.127 PV of annuity of Re 1) and 20%. (Rs.2.991 PV of an annuity of Re 1) The exact rate can be determined by interpolation. In this case Rs.2.991 is very near to 3 and hence IRR can be taken as 20%
(ii) In Case of Uneven or Mixed Streams of Cash Flows:
When cash inflows are unequal over the entire life of the asset, then follow the Trial &Error method to calculate the IRR. However, this procedure is a tedious and time- consuming one, hence the two trial rates namely lower trial rate and higher trial rates will be given in the problem itself.
Procedure of Computing IRR:
The convenient way for computing IRR is to take two trial discounting rates (lower rate & higher rate or low trail & high trail), finding the present values for cash inflows at these two trial discounting rates and apply the following ABCDO alphabet formula to interpolate the exact IRR rate-
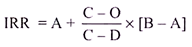
Where,
A = Lower trial discounting rate
B = Higher trial discounting rate
C = the present values for cash inflows at Lower trial rate
D = present values for cash inflows at Higher trial rate
O = Original outlay/ initial investment