
After reading this article you will learn about:- 1. Meaning of Programme Evaluation Review Technique (PERT) 2. Steps Involved in PERT Planning Techniques 3. Example.
Meaning of Programme Evaluation Review Technique (PERT):
PERT was first used in 1957 as a method of planning and controlling the Polaris Missiles Programme by Booz, Allen and Hamilton together with U.S. Naval department. The aim was to finish the project two years in advance. PERT describes basic network technique which includes planning, monitoring and control of projects. PERT finds applications in planning and control of complex set of tasks, functions and relationships.
It is a very important technique in the field of project Management. PERT is commonly employed for conducting the initial review of a project. PERT is a very useful device for planning the time and resources. It represents an important step in the development of managerial science. It points out potentially troublesome areas (which may disrupt programme objectives) against which a timely action can be taken to prevent their occurrences. PERT helps in decision making.
PERT, actually, developed as a research and development planning tool where activity timings could not be estimated with enough certainty. To some extent a similar situation occurs in design work also. PERT can be employed at those places where a project cannot be easily defined in terms of time or resources required.
ADVERTISEMENTS:
Of course, events can be readily defined which means it is known that, first, part A will be manufactured, only then subassembly 5 can be built and so on. PERT technique proves very much advantageous when used for non-repetitive type of projects, R & D prototype production, defence projects, etc.
Because of the uncertainty of activity timings, PERT acquired the shape of a probabilistic model. It uses linear programming and probability concepts for planning and controlling activities. Probability concept helps in estimating activity timings; and the maximization of (attainment of) the predefined objective is achieved through the Linear programming feature of PERT. The statistical probability feature of PERT foretells the probability of reaching the specified target dates. PERT is mainly concerned with events and is thus an event-oriented system.
The basic tool used in PERT technique is the network or flow plan. Network consists of a series of related events and activities. An important point is that, as a person plans the activities in his mind, so the flow plan (or diagram) evolves and, it even points out the gaps in the drawing. The network thus drawn shows, how various activities of a project depend on each other and that certain activities have to be completed before the others can start.
Steps Involved in PERT Planning Techniques:
The PERT planning technique consists of the following steps:
ADVERTISEMENTS:
(1) The project is broken down into different activities systematically.
(2) Activities are arranged in logical sequence.
(3) The network diagram is drawn. Events and activities are numbered.
(4) Using three times estimate, the expected time for each activity is calculated.
ADVERTISEMENTS:
(5) Standard deviation and variance for each activity are computed.
(6) Earliest starting times and latest finishing times are calculated.
(7) Expected time, earliest starting time, and latest finishing times are marked on the network diagram.
(8) Slack is calculated.
ADVERTISEMENTS:
(9) Critical path(s) are identified and marked on the network diagram.
(10) Length of critical path or total project duration is found out.
(11) Lastly, the probability that the project will finish at due date is calculated.
Example on PERT:
A small engineering project consists of 9 activities.
ADVERTISEMENTS:
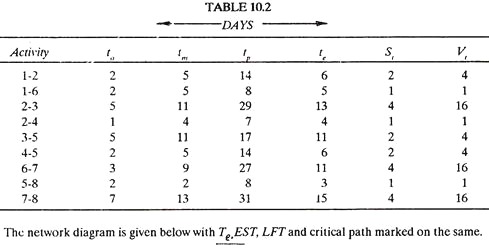
Three time estimates for each activity are given in Table 10.2:

(a) Calculate values of expected time (Te), standard deviation (St) and variance (Vt) for each activity.
(b) Draw the network diagram and mark te on each activity.
ADVERTISEMENTS:
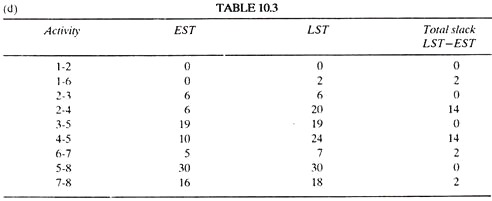
(c) Calculate EST and LFT and mark them on the network diagram.
(d) Calculate total slack for each activity.
(e) Identify the critical path(s) and mark on the network diagram.
(f) Find the length of critical paths or the total project duration.
ADVERTISEMENTS:
(g) Calculate variance of critical path.
(h) Calculate the probability that jobs on critical path will be finished by the due date of 38 days.
(i) Calculate the approximate probability that the jobs on the next most critical path will be completed by the due date of 38 days.
(j) Estimate the probability that the entire project will be completed by the due date of 38 days. Explain it.
(k) If the project due date changes to 35 days what is the probability of not meeting the due date.
(l) Find the due date which has a probability of 94.5% of being met.
ADVERTISEMENTS:
Solution:
The concept of expected time and the estimation of variability of activity times (which is necessary before solving the problem) is given below:
1. Estimation of Activity Time:
For dealing with uncertainties associated with different activities, PERT approach computes expected time for each activity from the following three time estimates:
(a) Optimistic Time (to):
It is the shortest possible time in which an activity can be completed if everything goes exceptionally well.
ADVERTISEMENTS:
(b) Most Likely Time (tm):
It is the time in which the activity is normally expected to complete under normal contingencies.
(c) Pessimistic Time (tp):
It is the time which an activity will take to complete in case of difficulty, i.e., if mostly the things go wrong. It is the longest of all the three time estimates.
The to, tm and tp are combined statistically to develop the expected time (te) for an activity. The fundamental assumption in PERT is that the three time estimates form the end points and mode of Beta distribution (Fig. 10.3). It is further assumed that tp and to are about equally likely to occur whereas the probability of occurrence of t is 4 times that of tp or to.

Therefore, te is given by,
![]()
(2) Estimation of Variability of Activity Times:
The purpose is to find, how reliable-‘te’ as got from equation (1) is;
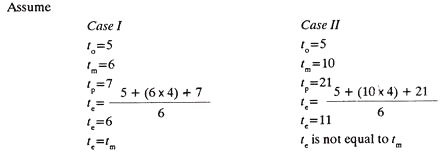
This indicates that, if the time required for an activity shows high variability (Case II) and there is wide range of (21-5=16) three times estimates, the certainty and confidence to correctly anticipate the actual time from relation (1) decreases and thus the need to measure the variability in the time of an activity arises. Knowing the variability, the reliability of te values can be assessed. PERT, using statistical probability concept, employs standard deviation (St) and variance (Vt) as measures of variability.
They are given by:
ADVERTISEMENTS:
This supports the above concept.

This supports the above concept.
Coming to the actual problem:
(a) The Table 10.2 gives the values of to, tm and tp for each activity. The values of te, St and Vt are calculated by using equations (1), (2), and (3) and have been added in the Table 10.2.

(e) Critical path is 1-2-3-5-8 and it is marked on the network diagram.
(J) The length of the critical path or the total project duration (Te) is sum of the duration of each critical activity, i.e., 6 + 13 + 11 + 3 = 33 days.
(g) Variance of the critical path is sum of the variance of each critical activity, i.e., 4 + 16 + 4 + 1 =25.
(h) The probability that the project will meet the scheduled or the due date is calculated from the following relation:
![]()
where Te is the total project duration = 33 days
St is the standard deviation
![]()
D is the due or scheduled date (time) = 38 days.
Z is the number of standard deviations by which D exceeds Te
Substituting different values in equation (4).
Z = 38-33/5 = 1; for the value of Z=1 the corresponding value of probability can be read from Table 10.4 and this is 0.841.

(i) The next most critical path is 1-6-7-8, of 31 days duration.
Variance of the path = 1 + 16 + 16=33
Therefore, St = √33 = 5.74
And Z = D-Te/St = 38-31/5.74 = 1.22
From Table 10.4 for Z= 1.22, the approximate probability of meeting due date is 0.888.
(j) To complete the project, there are three paths from first to last event,
(a) 1-2-3-5-3 (33 days)
(b) 1-2-4-5-8 (19 days)
(c) 1-6-7-8 (31 days)
Path (b) involves much less time, so its probability of completing in 38 days is very high.
Paths (a) and (c) are independent of each other and the probabilities of paths (a) and (c) to complete in due time of 38 days are 0.841 and 0.888 respectively. Therefore the probability of their both being completed in 38 days is = 0.841 x 0.888 = 0.7468.
(k) Again Z = D-Te/St = 35-33/5 = 0.4
From Table 10.4 for Z = 0.4, the probability of meeting due date is 0.655; and hence the probability of not meeting the due date
= 1 – 0.655 = 0.345
(1) From Table 10.4, for the probability of 94.5% or 0.945, the value of Z = 1.6
and Z = D-Te/St, therefore 1.6 = D-33/5
and thus D – 41 days.