
The following points highlight the top eight methods used for determining the variability of return on mutual funds. The methods are: 1. Standard Deviation 2. Sharpe Ratio 3. Treynor Ratio 4. Sortino Ratio 5. Differential Return 6. Jensen’s Alpha 7. Appraisal Ratio 8. M2 Measure.
Method # 1. Standard Deviation:
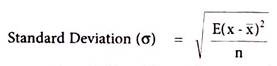
Standard deviation looks at funds volatility in terms of rise and fall in its returns. Maximum volatility in a security is the riskiest, considering the unevenness it brings about in its performance. Standard deviation of a fund measures this risk by measuring the degree to which the fund fluctuates in relation to its mean return. That is the average return of a fund over a period of time.
The fund with higher standard deviation is more riskier because it fluctuates widely between negative and positive returns with in a short period. To determine how well a fund is maximizing its returns received for its volatility, you can compare the fund to another with a similar investment strategy and similar returns.
The fund with the lower standard deviation would be more optimal because it is more maximizing the return received for the amount of risk acquired. Standard deviation is a measure of dispersion in return. It quantifies the degree to which returns fluctuate around their average. A higher value of standard deviation means higher risk.
When used to measure the volatility of the performance of a security or a portfolio of securities, standard deviation is generally calculated for monthly returns over a specific time period- usually 36 months.
Annualized Monthly Deviation = Monthly Standard Deviation x Square Root of 12
Standard deviation allows portfolios with similar objectives to be used to compare over a particular time frame. It can also be used to gauge much more risk a fund in one category has, as compared to the other.
Problem 1:
ADVERTISEMENTS:
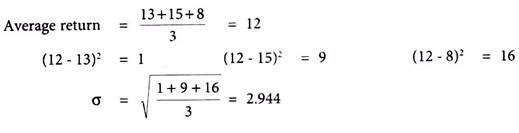
PQR Fund has made a return of 13%, 15% and 8% respectively for 1st, 2nd and 3rd year. Calculate standard deviation of the return of the fund.
Solution:
Problem 2:
ADVERTISEMENTS:
Mr. Kumar is a fund manager of an equity fund which is expected to provide risk premium of 10% and standard deviation of returns of 16%. Miss Akrita, a client of Mr. Kumar choose to invest Rs.70,000 in equity fund and Rs.30,000 in T-Bills. If T-Bills are trading at 7% p.a., what will be the expected return and standard deviation of return on the portfolio of Miss Akrita?
Solution:
Expected return on Equity fund =7+10 =17%
Expected return on portfolio of Miss Akrita = (0.70 x 17) + (0.30 x 7) = 14%
ADVERTISEMENTS:
Expected standard deviation of the return on portfolio = (0.70 x 0.16) + (0.30 x 0) = 11.2%
Method # 2. Sharpe Ratio:
One approach is to calculate portfolio’s return in excess of the risk-free return and divide the excess return by the portfolio’s standard deviation. This risk adjusted return is called ‘Sharpe ratio’. This ratio named after William Sharpe, thus measures reward to variability. This ratio describes how much return is receiving for the extra volatility that an investor endures for holding a riskier asset. An investor always needs to be properly compensated for the additional risk he undertakes for not holding a risk-free asset.
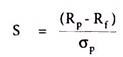
Where, S = Sharpe ratio of the fund
ADVERTISEMENTS:
Rp = Annualized average rate of return of the fund
Rf = Annualized risk-free rate of return
σp = Standard deviation of average return of the fund
This equation calls for three terms:
ADVERTISEMENTS:
(a) Annualized return of the fund,
(b) Annualized risk-free return, and
(c) Annualized standard deviation.
This ratio is also known as ‘reward to variability ratio’. It measures the risk premium earned per unit to total risk. Risk premium is excess expected return over risk-free return and total risk involved in funds is standard deviation of expected return from the funds. When we compare position of two or more funds, a fund with higher Sharpe ratio gets a better rank. The Sharpe ratio is a measure of relative performance, in the sense that it enables the investor to compare two or more investment opportunities.
ADVERTISEMENTS:
A fund with a higher Sharpe ratio in relation to another is preferable as it indicates that the fund has higher risk premium for every unit of standard deviation risk. Because Sharpe ratio adjusts return to the total portfolio risk, the implicit assumption of the Sharpe measure is that the portfolio will not be combined with any other risky portfolios. Thus the Sharpe measure is relevant for performance evaluation when we wish to evaluate several mutually exclusive portfolios.
Sharpe ratio is a risk-adjusted measure of return used to evaluate the performance of a portfolio. The ratio helps to make the performance of one portfolio comparable to that of another portfolio by making an adjustment for risk. A fund with a higher Sharpe ratio in relation to another is preferable as it indicates that the fund has higher risk premium for every unit of standard deviation risk.
A ratio of more than or equal to 1 is good, more than or equal to 2 is very good, and more than or equal to 3 is excellent. Sharpe ratio broken -down into three components, asset return, risk-free return, and standard deviation of return. After calculating the excess return, it is divided by the standard deviation of the risky asset to get its Sharpe ratio.
The objective of the Sharpe ratio is to observe how much additional return is receiving for accepting additional volatility of holding the risky asset over a risk-free asset – the higher the better.
Problem 3:
XYZ Ltd. has got 12.04% as annualized standard deviation. The annualized return for the same fund is 16.8% and the average yield on one-year Treasury paper is 6.8%.
ADVERTISEMENTS:
Calculate Sharpe ratio of the fund.
Solution:
![]()
Method # 3. Treynor Ratio:
Treynor ratio developed by Jack Treynor, measures returns earned in excess of that which could have been earned on a risk less investment per each unit of market risk. The Treynor measure adjusts excess return for systematic risk. It is computed by dividing a portfolio’s excess return, by its beta as shown in equation.
![]()
Where, T = Treynor ratio
ADVERTISEMENTS:
Rf = Risk-free return
Rp = Portfolio return
βp = Portfolio beta
As can be seen the numerator of the equation remains the same as in case of Sharpe ratio. The denominator standard deviation is replaced by Beta. As Treynor ratio indicates return per unit of systematic risk, it is a valid performance criterion when we wish to evaluate a portfolio in combination with the benchmark portfolio and other actively managed portfolios. Like Sharpe ratio it is a measure of relative performance.
Treynor ratio is a risk-adjusted measure of return based on systematic risk. It is similar to the Sharpe ratio with the difference being that the Treynor ratio uses beta as the measurement of volatility.
It is known as the ‘reward-to-volatility ratio’. For a completely diversified portfolio one without any unsystematic risk, the two measures give identical risk, because the total variance of a completely diversified portfolio is its systematic variance.
ADVERTISEMENTS:
A poorly diversified portfolio could have a high ranking on the basis of Treynor ratio and a low ranking on the basis of Sharpe ratio. The difference in ranking is due to difference in diversification.
Problem 4:
For an ABC Fund, the portfolio return is 16,2% and risk-free return is 5.5%. The beta of the portfolio is 1.2. Calculate Treynor ratio of the fund.
Solution:
![]()
This indicates that the fund has generated 0.09 percentage point above the risk-free return for every unit of systematic risk.
Method # 4. Sortino Ratio:
ADVERTISEMENTS:
Sortino ratio was developed by Frank A Sortino to differentiate between good and bad volatility in the Sharpe ratio. This differentiation of upwards and downwards volatility allows the calculation to provide a risk-adjusted measure of a security or fund’s performance in a clearer and comprehensive way.
It does not misses on the upward price changes and unlike standard deviation it does not discriminate between up and down volatility. The Sortino ratio is similar to the Sharpe ratio, except it uses downside deviation for the denominator instead of standard deviation.
Method # 5. Differential Return:
The second category of risk adjusted performance measure is referred to as differential return measure. The underlying objective of this category is to calculate the return that should be expected of the fund scheme given its realized risk and to compare that with the return actually realized over the period.
Method # 6. Jensen’s Alpha:
The most commonly used method of determining the return that should have been earned by the scheme at a given level of risk is by way of Alpha formulation:
∝ = (RP – RF) – βP(RB– RF)
Where, ∝ = the Jensen measure (alpha)
ADVERTISEMENTS:
βp = portfolio beta
Rp = portfolio return
RB = benchmark return
RF = riskless return
Calculation of alpha is a fairly simple exercise. The intercept term in the regression equation is the Alpha. This number is usually very close to zero. A positive alpha means that return tends to be higher than expected given the beta statistic.
Conversely, a negative alpha indicates that the fund is an under performer. Alpha measures the value added of the portfolio given its level of systematic risk. The Jensen measure is also suitable for evaluating a portfolio’s performance in combination with other portfolios because it is based on systematic risk rather than total risk.
Method # 7. Appraisal Ratio:
If we wish to determine whether or not an observed alpha is due to skill or chance we can compute an appraisal ratio by dividing alpha by the standard error of the regression.
![]()
Where, A = the appraisal ratio
α =alpha
σC =the standard error of the regression (non-systematic risk)
To interpret this ratio, notice that the ‘a’ in the numerator represents the fund manager’s ability to use his skill and information to generate a portfolio return that differs from the benchmark against which his performance is being measured (e.g. BSE Sensitive Index or Nifty). The denominator measures the amount of residual (unsystematic) risk that the investor incurred in pursuit of those excess returns. Thus this ratio can be viewed as a benefit to cost ratio that assess the quality of fund manager’s skill.
Method # 8. M2 Measure:
Franco Modigliani and his grand-daughter Lea Modigliani in the year 1997 derived another risk adjusted performance measure by adjusting the risk of a particular portfolio so that it matches the risk of the market portfolio and then calculate the appropriate return for that portfolio. It operates on the concept that a scheme’s portfolio can be levered or de-levered to reflect a standard deviation that is identical with that of the market. The return that this adjusted portfolio earns is called M2.
m2 = (σm/σmf)x(RmrRf) + Rf
Where, σm = Standard deviation of the market
Rf = Risk-free return
σmf = Standard deviation of the scheme
Rmf = Return on the scheme
Since the standard deviation have been equalized, M2 can be directly compared with the return in the market. A high M2 indicates that the portfolio has outperformed and a low M2 indicates underperformed portfolio. The measures discussed above are extensively used in the mutual fund industry to comment on the performance of equity schemes.
The same measures can be used to evaluate the performance of debt securities. However, measures involving use of beta are considered theoretically unsound for debt schemes as beta is based on the capital assets pricing model, which is empirically tested for equities.