This article provides a full proof formula to calculate break even point.
BEP can be calculated in a number of ways, depending on the nature of the information available.
Let us use the following symbols in our calculation:
P: Selling price per unit
ADVERTISEMENTS:
q: sales volume
f: fixed cost me
v: per unit variable cost.
Now for BEP, Sales = Total cost = Total Fixed cost + Total Variable cost.
(A) Break-Even Point in Units:
ADVERTISEMENTS:
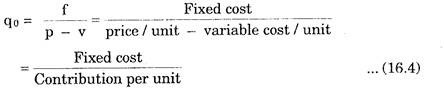
i.e. If q0 denotes the level of volume, where there is break-even, then
Total sales = p.q0
Total cost = f + q0v
Thus for break-even
Example 1:
A factory, producing only one item, which it sells for Rs. 10.50 per unit, has a fixed cost equal to Rs. 50,000 and variable cost Rs.6.50 per unit. How many units must be produced to break-even? How many units must be produced to procure a profit of Rs. 10,000? What would be the profit if 20,000 units are produced and sold?
Solution:
(i) Here f = 50,000
ADVERTISEMENTS:
p = 10.50 per unit
v = 6.50 per unit.
Thus the break-even point from (16.4) is
Q = f/p-v = 50,000/10.50-6.50 = 12,500 units
ADVERTISEMENTS:
(ii) Let q units be produced for a profit of Rs. 10,000.
Then total revenue = Price/unit x output = 10.50 q
Total cost = fixed cost + (output) (variable cost/unit)
= 50,000 + q (6.50)
ADVERTISEMENTS:
Profit = Total revenue – total cost
= 10.50 q -50,000 -6.50q
i.e. 10,000 = 4q – 50,000 or 4q = 60,000
q = 15,000 units
ADVERTISEMENTS:
(iii) Profit = Total revenue -total cost
= 10.50 (20,000) – [50,000 + 6.50 (20,000)] .
= 20,000 (10.50 – 6.50) – 50,000 i
= 80,000 – 50,000 = Rs. 30,000.
(B) Given Total Sales (S), Fixed Cost (F) and Total Variable Cost (V):
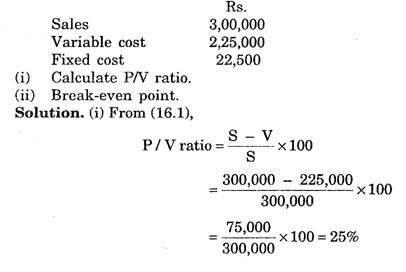
Example 2:
ADVERTISEMENTS:
The following figures relate to a small manufacturing company.